|
|
市場調査レポート
商品コード
1418701
飲料加工機器の世界市場 2023年~2030年Global Beverage Processing Equipment Market - 2023-2030 |
||||||
|
|
|||||||
カスタマイズ可能
適宜更新あり
|
|||||||


| 飲料加工機器の世界市場 2023年~2030年 |
|
出版日: 2024年01月23日
発行: DataM Intelligence
ページ情報: 英文 190 Pages
納期: 即日から翌営業日
|

- 全表示
- 概要
- 目次
概要
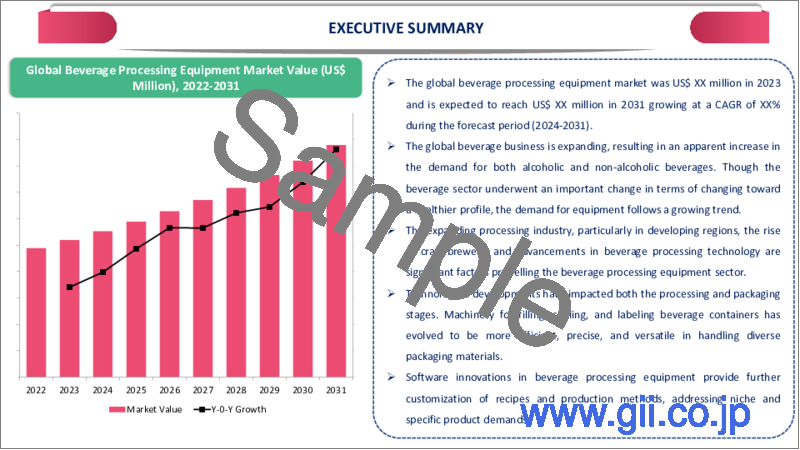
飲料加工機器の世界市場は、2022年に89億4,000万米ドルに達し、2023-2030年の予測期間中にCAGR 4.22%で成長し、2030年には124億4,000万米ドルに達すると予測されています。
飲料加工機器は、高品質の製品を製造するために不可欠です。豆乳、アーモンドミルク、オートミールミルクなどの植物性代替ミルクの人気の高まりは、様々な植物性原料を加工し、伝統的な乳製品の味と食感を模倣した植物性飲料を作るために設計された機器の必要性につながっています。
技術の進歩は、加工段階だけでなくパッケージングにも影響を及ぼしています。飲料容器の充填、密封、ラベル貼りのための機器は、より効率的で精度が高くなり、さまざまな包装材料に対応できるようになった。飲料加工機器におけるソフトウェア主導の進歩により、レシピや製造工程のカスタマイズが容易になり、ニッチで個性的な製品の提供に対応できるようになった。
飲料加工機器の普及に向けた政府のイニシアチブの高まりは、予測期間中の市場成長を後押しします。例えば、2022年6月29日、カナダ政府はカナダのワインセクターに対する新たな支援プログラムを開始しました。農業・農業食品大臣は、ワイナリーの成長を支援する2年間で最大1億6,600万米ドルの新たなワインセクター支援プログラムの詳細を発表しました。ワイン醸造所の増加に伴い、飲料加工機器の需要も増加しています。
力学
世界のアルコール飲料消費の増加
カナダの中毒精神保健センター(Centre for Addiction and Mental Health)とドイツのドレスデン工科大学(Technische Universitat Dresden)の研究チームが発表した調査によると、人々のアルコール消費量は30年前と比べて増加しています。2020年、世界全体の年間アルコール消費量は70%増加します。
ギャラップ社の2021年のデータによると、米国の成人の60%がアルコール飲料を飲んでいます。男性の63%がアルコール飲料を消費するのに対し、女性は57%です。Numerator社のデータによると、2021年5月までの52週間で、ミレニアル世代の90%がアルコールを購入しています。2022年にWine Market Council/NielsenIQ'sが発表したデータによると、消費者の22%がビール、17%がワイン、14%がスピリッツのみを購入し、残りの11%がサイダー、ハードセルツァーなどを選択しています。アルコール飲料の需要が世界的に高まるにつれて、飲料加工機器のニーズも予測期間中に高まっています。
飲料加工機器の技術的進歩
技術の進歩は飲料加工機器市場の成長を後押しする重要な役割を果たします。製品の品質、効率、業界内の技術革新を高めるのに役立っています。センサー技術やリアルタイムモニタリングなどの高度な制御システムは、飲料加工段階を正確に制御することを可能にします。その結果、製品の品質が安定し、人的ミスが減り、生産効率が向上します。
エネルギー効率の高い技術と設備設計は、飲料加工作業におけるエネルギー消費の低減に役立ちます。これは運用コストの削減だけでなく、環境維持の目標にも合致します。加工機器の技術的進歩により、温度、圧力、成分混合などの要素をより適切に制御できるようになります。これにより、製品の一貫性が高まり、全体的な品質が向上し、優れた味と食感に対する消費者の要求に応えることができます。
高い初期投資
高い資本要件は、飲料加工業界への参入を目指す新規事業や起業家にとって参入障壁となります。設備や機器に多額の初期投資が必要なため、中小企業は市場参入を断念し、競争とイノベーションが制限されます。飲料業界の新興企業は、製品開発、マーケティング、流通など、事業の複数の側面に同時に投資する必要があるため、しばしば財務上の課題に直面します。飲料加工設備には多額の初期費用がかかるため、資金繰りに負担がかかります。
高額な設備投資により、企業はリスクを回避するようになり、新しい技術や設備への投資をためらうようになります。このため、革新的な加工方法の採用が遅れ、新しい改良型飲料の開発が制限されます。飲料加工機器の維持・運用にもコストがかかり、特にエネルギーを大量に消費するプロセスや定期的なメンテナンスが必要な場合はなおさらです。運営コストの高さは、企業の財務資源をさらに圧迫し、収益性に影響を与えます。
目次
第1章 調査手法と調査範囲
第2章 定義と概要
第3章 エグゼクティブサマリー
第4章 市場力学
- 影響要因
- 促進要因
- 世界のアルコール飲料消費の拡大
- 飲料加工機器の技術進歩
- 抑制要因
- 初期投資の高さ
- 機会
- 影響分析
- 促進要因
第5章 産業分析
- ポーターのファイブフォース分析
- サプライチェーン分析
- 価格分析
- 規制分析
第6章 COVID-19分析
第7章 タイプ別
- 醸造設備
- ろ過装置
- 炭酸設備
- 砂糖溶解機、ブレンダー&ミキサー
- 熱交換器
- その他
第8章 飲料タイプ別
- アルコール飲料
- ノンアルコール飲料
- その他
第9章 地域別
- 北米
- 米国
- カナダ
- メキシコ
- 欧州
- ドイツ
- 英国
- フランス
- イタリア
- ロシア
- その他欧州
- 南米
- ブラジル
- アルゼンチン
- その他南米
- アジア太平洋
- 中国
- インド
- 日本
- オーストラリア
- その他アジア太平洋地域
- 中東・アフリカ
第10章 競合情勢
- 競合シナリオ
- 市況/シェア分析
- M&A分析
第11章 企業プロファイル
- Tetra Laval
- 会社概要
- 製品ポートフォリオと説明
- 財務概要
- 主な発展
- GEA Group Aktiengesellschaft
- Alfa Laval
- Krones AG
- Lee Industries
- Neologic Engineers Private Limited
- JBT Corporation
- KHS GmbH
- Pentair
- Praj Industries
第12章 付録
Overview
Global Beverage Processing Equipment Market reached US$ 8.94 billion in 2022 and is expected to reach US$ 12.44 billion by 2030, growing with a CAGR of 4.22% during the forecast period 2023-2030.
Beverage processing equipments are essential to produce a quality product. An increase in the processing industry in developing regions helps to boost market growth over the forecast period. growing popularity of plant-based milk alternatives, such as soy, almond, and oat milk, has led to a need for equipment designed to process various plant-based ingredients and create plant-based beverages that mimic the taste and texture of traditional dairy products.
Technological advancements have not only affected the processing stage but also the packaging. Equipment for filling, sealing, and labeling beverage containers has become more efficient, precise, and capable of accommodating a variety of packaging materials. Software-driven advancements in beverage processing equipment allow for easier customization of recipes and production processes, catering to niche and personalized product offerings.
Growing Government initiatives to promote beverage processing equipment helps to boost market growth over the forecast period. For instance, on June 29, 2022, the Government of Canada launched a new support program for Canada's wine sector. the Minister of Agriculture and Agri-Food announced detail of a new two-year up to $166-million wine sector support program that helps to grow wineries. As the number of wineres are growing demand for beverage processing equipment is also growing.
Dynamics
Growing Alcohol Beverages Consumption Globally
According to the research published by a team of investigators from the Centre for Addiction and Mental Health, Canada, and the Technische Universitat Dresden, Germany reported that people's consumption of alcohol increased compared with 30 years ago. Globally total volume of alcohol consumed per year increased by 70% in 2020.
According to the data given by Gallup, Inc. in 2021, 60% of United States adults drank alcoholic beverages. 63% of men consume alcoholic beverages compared to 57% of women. According to the data given by Numerator, 90% of Millennials purchased alcohol during the 52-week period till May 2021. According to the data published by Wine Market Council / NielsenIQ's in 2022, 22% of consumers choose beer, 17% of wine, and 14% of consumers buy Spirits only, and the remaining 11% choose cider, hard seltzers, etc. As demand for alcoholic beverages increases globally need for the beverage processing equipment also growing over the forecast period.
Technological Advancement in the Beverage Processing Equipment
Technological advancements play a crucial role in boosting the growth of the beverage processing equipment market. It helps to increase product quality, efficiency, and innovation within the industry. Advanced control systems such as sensor technology, and real-time monitoring, allow for precise control over the beverage processing stages. This results in consistent product quality, reduced human error, and increased production efficiency.
Energy-efficient technologies and equipment design help lower energy consumption in beverage processing operations. This not only reduces operational costs but also aligns with environmental sustainability goals. Technological advancements in processing equipment enable better control over factors such as temperature, pressure, and ingredient mixing. This leads to higher product consistency and improved overall quality, meeting consumer demands for superior taste and texture.
High Initial Investment
High capital requirements create barriers to entry for new businesses and entrepreneurs looking to enter the beverage processing industry. The substantial initial investment needed for equipment and facilities discourages smaller players from participating in the market, limiting competition and innovation. Start-up companies in the beverage industry often face financial challenges, as they need to invest in multiple aspects of their business simultaneously, including product development, marketing, and distribution. The significant upfront cost of beverage processing equipment strains their financial resources.
High capital investments make companies risk-averse, as they are hesitant to invest in new technologies or equipment. This leads to slower adoption of innovative processing methods, which restrict the development of new and improved beverages. Maintaining and operating beverage processing equipment is also costly, especially when it involves energy-intensive processes or regular maintenance. High operating costs further strain a company's financial resources and impact profitability.
Segment Analysis
The global beverage processing equipment market is segmented based on type, beverage type, and region.
Increasing Manufacturers's Demand for Brewery Equipment
The brewery equipment segment held 43.15 % of the global beverage processing equipment market share. One of the primary drivers of the brewery equipment segment's growth is the global surge in craft beer production. According to the data given by the Brewers Association in 2021, Total beer sales by volume edged up 1 percent in 2021, and craft beer sales rose by 8% to 24.8 million barrels. Independent brewers' share of the United States beer market by volume rose to 13.1% which is increased from 12.2 % by 2020.
In 2021, there were over 9,500 breweries in the United States. Consumers are looking for unique beer options and different flavors of beer which helps to increase the need for brewery equipment to produce quality products. As the number of breweries increases globally, demand for brewery equipment also increases to increase the production of craft beer.
Geographical Penetration
Growing Production of Functional Beverages in the Asia Pacific
Asia Pacific accounted for 40.15% of the market share in the global beverage processing equipment market. The growing population in the Asia Pacific helps to boost the consumption of beverages. India and China have large and growing populations country in the region. This demographic factor creates a substantial consumer base for beverages, including soft drinks, juices, and alcoholic beverages, driving demand for beverage processing equipment.
Rapid growth in the consumption of functional beverages in Asia Pacific helps to boost market growth over the forecast period. According to the data given by Glanbia Nutritional in 2022, Asia Pacific accounted for 40% of the sales of functional beverages in the global market. As demand for functional beverages increases in the region, major key players in the market are buying beverage processing equipment to speed up beverage production and improve their quality.
Competitive Landscape
The major global players in the market include: Tetra Laval, GEA Group Aktiengesellschaft, Alfa Laval, Krones AG, Lee Industries, Neologic Engineers Private Limited, JBT Corporation, KHS GmbH, Pentair and Praj Industries.
COVID-19 Impact Analysis:
The pandemic disrupted global supply chains, affecting the availability of raw materials, components, and finished equipment. Lockdowns, and factory closures globally disrupted the production and transportation of beverage processing equipment. The closure of restaurants, bars, and other food service establishments, as well as reduced foot traffic in public spaces, resulted in a significant decrease in the consumption of beverages outside the home. This reduced demand for beverage processing equipment, particularly in the commercial sector.
Social distancing measures and lockdowns affected the manufacturing process and slowed down the production of beverage processing equipment. This resulted in delays in delivering equipment to customers. Many beverage producers faced financial constraints due to reduced revenues during the pandemic. This led to delayed or canceled investments in new equipment, especially by smaller businesses.
Russia-Ukraine War Impact Analysis
With geopolitical instability and economic sanctions, prices for raw materials like steel, aluminum, and electronics increase. This drives up the production costs for beverage processing equipment, potentially leading to higher prices for consumers. The overall economic impact of the war affected consumer spending. The conflict results in a global economic downturn, and people reduce their spending on non-essential goods, which include beverages. This led to reduced demand for beverage processing equipment.
Currency fluctuations significantly impact international trade. Changes in the exchange rates of the Russia and Ukrainian along with other major currencies affect the cost of imported or exported equipment. Ongoing geopolitical tensions disrupt trade relationships and lead to political uncertainty, making it harder for companies to plan for the long term.
By Type
- Brewery equipment
- Filtration equipment
- Carbonation equipment
- Sugar dissolvers and blenders & mixers
- Heat exchangers
- Others
By Beverage Type
- Alcoholic beverages
- Non-alcoholic beverages
- Others
By Region
- North America
- U.S.
- Canada
- Mexico
- Europe
- Germany
- UK
- France
- Italy
- Russia
- Rest of Europe
- South America
- Brazil
- Argentina
- Rest of South America
- Asia-Pacific
- China
- India
- Japan
- Australia
- Rest of Asia-Pacific
- Middle East and Africa
Key Developments
- On June 20, 2023, The Timken Company, a leader in engineered bearings and industrial motion products has experienced high demand for the broad range of application-proven products and services it offers the food and beverage industry. Due to this increasing demand in 2022, the company launched GGB Bearings and achieved market growth of more than 30%.
- On September 30, 2021, Quintus Technologies reentered into food & beverage arena with the launch of new high-pressure processing systems. It offers a streamlined design, applications savvy, and unparalleled service for maximum uptime.
Why Purchase the Report?
- To visualize the global beverage processing equipment market segmentation based on type, beverage type and region, as well as understand key commercial assets and players.
- Identify commercial opportunities by analyzing trends and co-development.
- Excel data sheet with numerous data points of beverage processing equipment market-level with all segments.
- PDF report consists of a comprehensive analysis after exhaustive qualitative interviews and an in-depth study.
- Product mapping available as excel consisting of key products of all the major players.
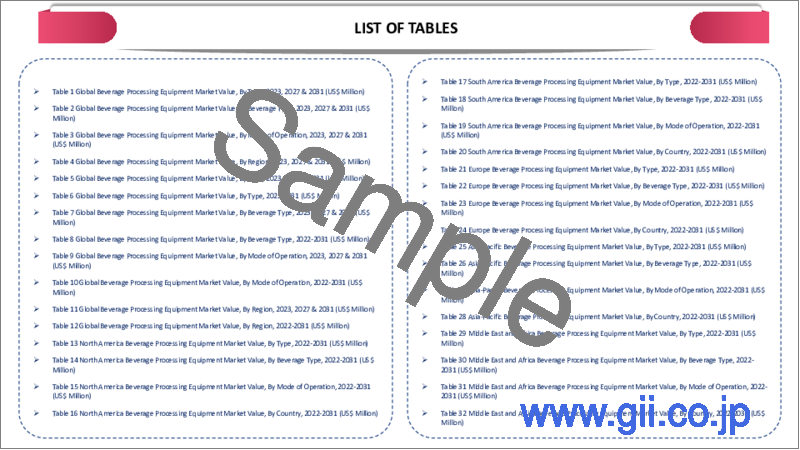
The global beverage processing equipment market report would provide approximately 53 tables, 50 figures and 190 Pages.
Target Audience 2023
- Manufacturers/ Buyers
- Industry Investors/Investment Bankers
- Research Professionals
- Emerging Companies
Table of Contents
1. Methodology and Scope
- 1.1. Research Methodology
- 1.2. Research Objective and Scope of the Report
2. Definition and Overview
3. Executive Summary
- 3.1. Snippet by Type
- 3.2. Snippet by Beverage Type
- 3.3. Snippet by Region
4. Dynamics
- 4.1. Impacting Factors
- 4.1.1. Drivers
- 4.1.1.1. Growing Alcohol Beverages Consumption Globally
- 4.1.1.2. Technological Advancement in the Beverage Processing Equipment
- 4.1.2. Restraints
- 4.1.2.1. High Initial Investment
- 4.1.3. Opportunity
- 4.1.4. Impact Analysis
- 4.1.1. Drivers
5. Industry Analysis
- 5.1. Porter's Five Force Analysis
- 5.2. Supply Chain Analysis
- 5.3. Pricing Analysis
- 5.4. Regulatory Analysis
6. COVID-19 Analysis
- 6.1. Analysis of COVID-19
- 6.1.1. Scenario Before COVID
- 6.1.2. Scenario During COVID
- 6.1.3. Scenario Post COVID
- 6.2. Pricing Dynamics Amid COVID-19
- 6.3. Demand-Supply Spectrum
- 6.4. Government Initiatives Related to the Market During Pandemic
- 6.5. Manufacturers Strategic Initiatives
- 6.6. Conclusion
7. By Type
- 7.1. Introduction
- 7.1.1. Market Size Analysis and Y-o-Y Growth Analysis (%), By Type
- 7.1.2. Market Attractiveness Index, By Type
- 7.2. Brewery Equipment*
- 7.2.1. Introduction
- 7.2.2. Market Size Analysis and Y-o-Y Growth Analysis (%)
- 7.3. Filtration Equipment
- 7.4. Carbonation Equipment
- 7.5. Sugar dissolvers and blenders & mixers
- 7.6. Heat Exchangers
- 7.7. Others
8. By Beverage Type
- 8.1. Introduction
- 8.1.1. Market Size Analysis and Y-o-Y Growth Analysis (%), By Beverage Type
- 8.1.2. Market Attractiveness Index, By Beverage Type
- 8.2. Alcoholic Beverages*
- 8.2.1. Introduction
- 8.2.2. Market Size Analysis and Y-o-Y Growth Analysis (%)
- 8.3. Non-alcoholic Beverages
- 8.4. Others
9. By Region
- 9.1. Introduction
- 9.1.1. Market Size Analysis and Y-o-Y Growth Analysis (%), By Region
- 9.1.2. Market Attractiveness Index, By Region
- 9.2. North America
- 9.2.1. Introduction
- 9.2.2. Key Region-Specific Dynamics
- 9.2.3. Market Size Analysis and Y-o-Y Growth Analysis (%), By Type
- 9.2.4. Market Size Analysis and Y-o-Y Growth Analysis (%), By Beverage Type
- 9.2.5. Market Size Analysis and Y-o-Y Growth Analysis (%), By Country
- 9.2.5.1. U.S.
- 9.2.5.2. Canada
- 9.2.5.3. Mexico
- 9.3. Europe
- 9.3.1. Introduction
- 9.3.2. Key Region-Specific Dynamics
- 9.3.3. Market Size Analysis and Y-o-Y Growth Analysis (%), By Type
- 9.3.4. Market Size Analysis and Y-o-Y Growth Analysis (%), By Beverage Type
- 9.3.5. Market Size Analysis and Y-o-Y Growth Analysis (%), By Country
- 9.3.5.1. Germany
- 9.3.5.2. UK
- 9.3.5.3. France
- 9.3.5.4. Italy
- 9.3.5.5. Russia
- 9.3.5.6. Rest of Europe
- 9.4. South America
- 9.4.1. Introduction
- 9.4.2. Key Region-Specific Dynamics
- 9.4.3. Market Size Analysis and Y-o-Y Growth Analysis (%), By Type
- 9.4.4. Market Size Analysis and Y-o-Y Growth Analysis (%), By Beverage Type
- 9.4.5. Market Size Analysis and Y-o-Y Growth Analysis (%), By Country
- 9.4.5.1. Brazil
- 9.4.5.2. Argentina
- 9.4.5.3. Rest of South America
- 9.5. Asia-Pacific
- 9.5.1. Introduction
- 9.5.2. Key Region-Specific Dynamics
- 9.5.3. Market Size Analysis and Y-o-Y Growth Analysis (%), By Type
- 9.5.4. Market Size Analysis and Y-o-Y Growth Analysis (%), By Beverage Type
- 9.5.5. Market Size Analysis and Y-o-Y Growth Analysis (%), By Country
- 9.5.5.1. China
- 9.5.5.2. India
- 9.5.5.3. Japan
- 9.5.5.4. Australia
- 9.5.5.5. Rest of Asia-Pacific
- 9.6. Middle East and Africa
- 9.6.1. Introduction
- 9.6.2. Key Region-Specific Dynamics
- 9.6.3. Market Size Analysis and Y-o-Y Growth Analysis (%), By Type
- 9.6.4. Market Size Analysis and Y-o-Y Growth Analysis (%), By Beverage Type
10. Competitive Landscape
- 10.1. Competitive Scenario
- 10.2. Market Positioning/Share Analysis
- 10.3. Mergers and Acquisitions Analysis
11. Company Profiles
- 11.1. Tetra Laval*
- 11.1.1. Company Overview
- 11.1.2. Product Portfolio and Description
- 11.1.3. Financial Overview
- 11.1.4. Key Developments
- 11.2. GEA Group Aktiengesellschaft
- 11.3. Alfa Laval
- 11.4. Krones AG
- 11.5. Lee Industries
- 11.6. Neologic Engineers Private Limited
- 11.7. JBT Corporation
- 11.8. KHS GmbH
- 11.9. Pentair
- 11.10. Praj Industries
LIST NOT EXHAUSTIVE.
12. Appendix
- 12.1. About Us and Services
- 12.2. Contact Us
