|
|
市場調査レポート
商品コード
1401335
農業用インプルメントの世界市場:2023年~2030年Global Agricultural Implements Market - 2023-2030 |
||||||
|
|
|||||||
カスタマイズ可能
適宜更新あり
|
|||||||


| 農業用インプルメントの世界市場:2023年~2030年 |
|
出版日: 2023年12月29日
発行: DataM Intelligence
ページ情報: 英文 186 Pages
納期: 即日から翌営業日
|

- 全表示
- 概要
- 目次
概要
世界の農業用インプルメント市場は、2022年に151億2,000万米ドルに達し、2023年から2030年の予測期間中にCAGR 7.2%で成長し、2030年には260億1,000万米ドルに達すると予測されています。
世界の農業用インプルメント市場は、ここ数年大きな成長を遂げています。植え付け、収穫、灌漑といった幅広い農作業をより効果的かつ迅速に行い、手作業の軽減にも役立つため、農家はこうした先進技術や機械を大いに採用しているからです。したがって、このような要因は世界の農業用インプルメント市場を牽引するのに役立ちます。
さらに、多くの農家がさまざまな目的でこうした機械を導入する意欲を示しているため、多くの製造企業も市場拡大のために革新的で高品質な製品を発売しています。
トラクターセグメントは市場シェアの半分以上を占めています。同様に、アジア太平洋地域は、農業目的のためにこれらの機械の使用量を増加させるのに役立つ広大な農地を持っているので、最大の市場シェアを獲得し、農業用インプルメント市場を独占しています。従って、市場成長の拡大に貢献することができます。
ダイナミクス
農業における先端技術の利用に対する需要の高まり
農家は、これらの先端技術や機械を様々な農作業に導入しており、これらの機械が農作業の効率を短時間で向上させ、農作物の生産性や品質の向上に役立っています。これらの機械はまた、手作業への依存を減らすのにも役立ちます。したがって、このような要因は市場の成長を高めるのに役立ちます。
製品発表数の増加
農作物が最適な時期に植えられ、栽培され、収穫されることを確実にし、その結果、農作物の品質が向上し、また、より効果的かつ迅速に作動するため、手作業への依存を減らすのに役立つため、先進的な機械に対する需要が農家の間で高まっています。従って、このような要素は市場成長の拡大に役立ちます。
機械に対する認識の低さ
一部の農家は、先進的な農業機械の操作、利点、能力を知らない可能性があります。彼らは、伝統的な手作業に頼り続けたり、他の代替手段を選んだりする可能性があり、それが採用率に影響する可能性があるため、機械に関する認識不足が市場成長の妨げになる可能性があります。
目次
第1章 調査手法と調査範囲
第2章 定義と概要
第3章 エグゼクティブサマリー
第4章 市場力学
- 影響要因
- 促進要因
- 農業における先端技術の利用に対する需要の高まり
- 製品の発売
- 抑制要因
- 機械に対する認識の低さ
- 機会
- 影響分析
- 促進要因
第5章 産業分析
- ポーターのファイブフォース分析
- サプライチェーン分析
- 価格分析
- 規制分析
第6章 COVID-19分析
第7章 タイプ別
- 農業機械・設備
- 芝生・庭園用トラクター
- 家庭用芝生・園芸機械
- 工具、ギアボックス、クラッチ、部品
- その他
第8章 製品別
- トラクター
- ハーベスター
- 植付機械
- 灌漑・作物処理機械
- 散布機械
- 乾牧草・飼料用機械
- その他
第9章 流通チャネル別
- B2C
- B2B
- その他
第10章 オペレーション別
- 自動
- 半自動
- 手動
- その他
第11章 容量別
- 小
- 中
- 大
第12章 用途別
- 収穫と脱穀
- 植物保護
- ポストハーベスト
- 農産物加工
- 播種と定植
- 雑草栽培
- 土地開発
- 苗床準備
- その他
第13章 地域別
- 北米
- 米国
- カナダ
- メキシコ
- 欧州
- ドイツ
- 英国
- フランス
- イタリア
- ロシア
- その他欧州
- 南米
- ブラジル
- アルゼンチン
- その他南米
- アジア太平洋
- 中国
- インド
- 日本
- オーストラリア
- その他アジア太平洋地域
- 中東・アフリカ
第14章 競合情勢
- 競合シナリオ
- 市況/シェア分析
- M&A分析
第15章 企業プロファイル
- AGCO Corporation
- 会社概要
- 製品ポートフォリオと説明
- 財務概要
- 主な発展
- Abanga and Grace Agro Industries Ghana Limited
- APV GmbH
- Bellota Agrisolutions
- CLAAS KGaA mbH
- Escorts Limited.
- HORSCH
- ISEKI & CO.,LTD.
- J C Bamford Excavators Ltd.
- Deere & Company.
第16章 付録
Overview
Global Agricultural Implements Market reached US$ 15.12 billion in 2022 and is expected to reach US$ 26.01 billion by 2030, growing with a CAGR of 7.2% during the forecast period 2023-2030.
The global agricultural implements market has witnessed significant growth over the years, as farmers are highly adopting these advanced technologies or machinery as they operate a wide range of agricultural tasks such as planting, harvesting, and irrigation more effectively and quickly, and also help in reducing manual labor. Hence, such factors can help in driving the global agricultural implements market.
Furthermore, as many farmers are showing more willingness to adopt these types of machinery for various purposes, many manufacturing companies are also launching innovative high-quality products to expand their markets. For instance, in January 2022, John Deere launched the John Deere 5045D power Oro 4WD V3 tractor, this model helps in preventing slippage and performs effectively in toughest tasks. Hence, such products can help in increasing the market growth.
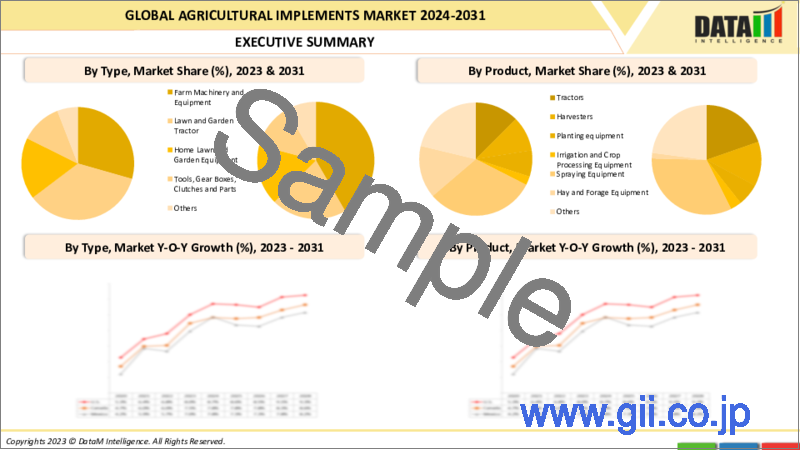
The tractors segment accounts for over half of the market share. Similarly, the Asia-Pacific dominates the agricultural implements market, capturing the largest market share, as the region has vast agricultural lands which helps in increasing the usage of these machinery for agricultural purposes. Hence, it can help in increasing the market growth.
Dynamics
Raising Demand for the Usage of Advanced Technologies in Agriculture
Farmers are highly adopting these advanced technologies or machinery for various agricultural practices as they help increase the efficiency of farming operations in less period of time, this helps in increasing the crop productivity and quality. These machineries also help in reducing the dependency on manual labor. Hence, such factors help in increasing the market growth.
Furthermore, as the demand for these machinery is increasing, many companies are highly investing in launching high-quality products in order to attract larger consumer bases. For instance, in October 2023, BigHaat company launched a new range of Pahalwaan Sprayers, strong, durable, and stylish sprayers for agricultural use, These sprayers come in four models, each equipped with unique features tailored to meet diverse needs. Hence, such products can help in increasing the market growth.
Increasing number of Product launches
The demand for advanced machinery is rising among farmers, as they help ensure that crops are planted, cultivated, and harvested at the optimal time, resulting in better quality produce, also they operate more effectively and quickly which helps reduce the dependency on manual labor. Hence, such factors can help in increasing the market growth.
Furthermore, manufacturing companies are launching products in order to expand their portfolios and attract larger consumers. For instance, in September 2023, the Swaraj Tractors, a part of Mahindra Group launched a new range of tractors in the 40 to 50 HP category. These new tractors are designed to meet the diverse and evolving needs of Indian farmers, offering them power, reliability, and style. Hence, such products can help in increasing the market.
Less Awareness about the Machinery
Some farmers may not be aware of operating the machinery, benefits, and capabilities of advanced agricultural implements, They may continue to rely on traditional, manual methods or may opt for other alternatives, which could affect the adoption rate, hence, the lack of awareness about the machinery can hamper the market growth.
Segment Analysis
The global agricultural implements market is segmented based on type, product, distribution channel, operation, capacity, application and region.
Increase in Demand for Effective Farming
The tractor segment holds the maximum share of the global agricultural implements market, farmers are highly adopting advanced agricultural tractors as they help in completing various agricultural activities more effectively and quickly, which can help in increasing crop productivity, hence, such factors can help in increasing the market growth.
Furthermore, the demand for tractors is increasing among farmers, so many manufacturing companies are focusing on launching innovative products to attract larger consumer bases. For instance, in May 2022, Tractors and Farm Equipment Limited launched an Eicher Prima G3 Series, it has a 40 - 60 hp range, that offers premium styling and progressive technology. Hence, such a product. Hence, such products can help in increasing the market growth.
Geographical Penetration
Vast Agricultural land and Government Initiatives in Asia-Pacific
Asia-Pacific region holds the largest share in the global agricultural implements market, farmers in this region are highly adopting this machinery, as the presence of vast agricultural lands, and the demand for high productivity is increasing in this region, hence, it can help in increasing the market growth in this region.
Furthermore, the presence of vast agricultural lands in this region, for instance, according to the Department of Agriculture, Fisheries and Forestry report, Australia has around 427 million hectares of agricultural land, which can help in increasing the usage of agricultural implements for various agricultural purposes.
Additionally, as the demand for this machinery is increasing, the government in this region is providing some initiatives in order to help the farmers adopt this machinery. For instance, the government of India has provided a Sub Mission on Agricultural Mechanization (SMAM), making farm machines accessible and affordable for small and marginal farmers through the establishment of Custom Hiring Centers (CHCs).
The creation of Hubs for hi-tech & high-value farm equipment and Farm Machinery Banks by the government. As of now, more than 13 lakh agricultural machines have been distributed and more than 27.5 thousand Custom Hiring Institutions established. Hence, such initiatives can help in increasing the market growth in this region.
Competitive Landscape
The major global players in the market include AGCO Corporation, Abanga and Grace Agro Industries Ghana Limited, APV GmbH, Bellota Agrisolutions, CLAAS KGaA mbH, Escorts Limited., HORSCH, ISEKI & CO., LTD., J C Bamford Excavators Ltd., and Deere & Company.
COVID-19 Impact Analysis
The pandemic has brought a disruption in the supply chain, many agricultural practices are also affected due to less availability of labor, raw materials, and others. Also, many manufacturing companies are shut down due to government lockdown restrictions, this has led to a decrease in the adoption rate, which has shown a negative impact on the global agricultural implements market.
By Type
- Farm Machinery and Equipment
- Lawn and Garden Tractor
- Home Lawn and Garden Equipment
- Tools, Gear Boxes, Clutches and Parts
- Others
By Product
- Tractors
- Harvesters
- Planting equipment
- Irrigation and Crop Processing Equipment
- Spraying Equipment
- Hay and Forage Equipment
- others
By Distribution Channel
- B2C
- B2B
- Others
By Operation
- Automatic
- Semi-Automatic
- Manual
- Others
By Capacity
- Small
- Medium
- Large
By Application
- Harvesting and Threshing
- Plant Protection
- Post-Harvest
- Agro-Processing
- Sowing and Planting
- Weed Cultivation
- Land Development
- Seed Bed Preparation
- Others
By Region
- North America
- U.S.
- Canada
- Mexico
- Europe
- Germany
- UK
- France
- Italy
- Russia
- Rest of Europe
- South America
- Brazil
- Argentina
- Rest of South America
- Asia-Pacific
- China
- India
- Japan
- Australia
- Rest of Asia-Pacific
- Middle East and Africa
Key Developments
- In July 2023, Balwaan Krishi announced the launch of its ISI-certified latest range of Agricultural machinery This equipment such as the Balwaan Water Pump, Brush cutter backpack and side pack, Portable sprayer, and Knapsack prayer are set to revolutionize the agricultural industry.
- In November 2022, Mahindra & Mahindra Farm Equipment Sector (FES), a part of the Mahindra Group, inaugurated its first dedicated farm machinery plant (non-tractor) in Pithampur, Madhya Pradesh.
- In August 2021, Agritech startup Farmkart had launched a tech-enabled platform rent4farm. This rent4farm platform will help farmers rent high-quality machinery and equipment at competitive rates.
Why Purchase the Report?
- To visualize the global agricultural implements market segmentation based on type, product, distribution channel, operation, capacity, application, and region, as well as understand key commercial assets and players.
- Identify commercial opportunities by analyzing trends and co-development.
- Excel data sheet with numerous data points of agricultural implements at the market with all segments.
- PDF report consists of a comprehensive analysis after exhaustive qualitative interviews and an in-depth study.
- Product mapping available as Excel consisting of key products of all the major players.
The global agricultural implements market report would provide approximately 85 tables, 100 figures and 186 Pages.
Target Audience 2023
- Manufacturers/ Buyers
- Industry Investors/Investment Bankers
- Research Professionals
- Emerging Companies
Table of Contents
1. Methodology and Scope
- 1.1. Research Methodology
- 1.2. Research Objective and Scope of the Report
2. Definition and Overview
3. Executive Summary
- 3.1. Snippet by Type
- 3.2. Snippet by Product
- 3.3. Snippet by Distribution Channel
- 3.4. Snippet by Operation
- 3.5. Snippet by Capacity
- 3.6. Snippet by Application
- 3.7. Snippet by Region
4. Dynamics
- 4.1. Impacting Factors
- 4.1.1. Drivers
- 4.1.1.1. Raising Demand for the Usage of Advanced Technologies in Agriculture
- 4.1.1.2. Product launches
- 4.1.2. Restraints
- 4.1.2.1. Less Awareness about the Machinery
- 4.1.3. Opportunity
- 4.1.4. Impact Analysis
- 4.1.1. Drivers
5. Industry Analysis
- 5.1. Porter's Five Force Analysis
- 5.2. Supply Chain Analysis
- 5.3. Pricing Analysis
- 5.4. Regulatory Analysis
6. COVID-19 Analysis
- 6.1. Analysis of COVID-19
- 6.1.1. Scenario Before COVID
- 6.1.2. Scenario During COVID
- 6.1.3. Scenario Post COVID
- 6.2. Pricing Dynamics Amid COVID-19
- 6.3. Demand-Supply Spectrum
- 6.4. Government Initiatives Related to the Market During Pandemic
- 6.5. Manufacturers Strategic Initiatives
- 6.6. Conclusion
7. By Type
- 7.1. Introduction
- 7.1.1. Market Size Analysis and Y-o-Y Growth Analysis (%), By Type
- 7.1.2. Market Attractiveness Index, By Type
- 7.2. Farm Machinery and Equipment*
- 7.2.1. Introduction
- 7.2.2. Market Size Analysis and Y-o-Y Growth Analysis (%)
- 7.3. Lawn and Garden Tractor
- 7.4. Home Lawn and Garden Equipment
- 7.5. Tools, Gear Boxes, Clutches and Parts
- 7.6. Others
8. By Product
- 8.1. Introduction
- 8.1.1. Market Size Analysis and Y-o-Y Growth Analysis (%), By Product
- 8.1.2. Market Attractiveness Index, By Product
- 8.2. Tractors*
- 8.2.1. Introduction
- 8.2.2. Market Size Analysis and Y-o-Y Growth Analysis (%)
- 8.3. Harvesters
- 8.4. Planting equipment
- 8.5. Irrigation and Crop Processing Equipment
- 8.6. Spraying Equipment
- 8.7. Hay and Forage Equipment
- 8.8. Others
9. By Distribution Channel
- 9.1. Introduction
- 9.1.1. Market Size Analysis and Y-o-Y Growth Analysis (%), By Distribution Channel
- 9.1.2. Market Attractiveness Index, By Distribution Channel
- 9.2. B2C*
- 9.2.1. Introduction
- 9.2.2. Market Size Analysis and Y-o-Y Growth Analysis (%)
- 9.3. B2B
- 9.4. Others
10. By Operation
- 10.1. Introduction
- 10.1.1. Market Size Analysis and Y-o-Y Growth Analysis (%), By Operation
- 10.1.2. Market Attractiveness Index, By Operation
- 10.2. Automatic*
- 10.2.1. Introduction
- 10.2.2. Market Size Analysis and Y-o-Y Growth Analysis (%)
- 10.3. Semi-Automatic
- 10.4. Manual
- 10.5. Others
11. By Capacity
- 11.1. Introduction
- 11.1.1. Market Size Analysis and Y-o-Y Growth Analysis (%), By Capacity
- 11.1.2. Market Attractiveness Index, By Capacity
- 11.2. Small*
- 11.2.1. Introduction
- 11.2.2. Market Size Analysis and Y-o-Y Growth Analysis (%)
- 11.3. Medium
- 11.4. Large
12. By Application
- 12.1. Introduction
- 12.1.1. Market Size Analysis and Y-o-Y Growth Analysis (%), By Application
- 12.1.2. Market Attractiveness Index, By Application
- 12.2. Harvesting and Threshing*
- 12.2.1. Introduction
- 12.2.2. Market Size Analysis and Y-o-Y Growth Analysis (%)
- 12.3. Plant Protection
- 12.4. Post-Harvest
- 12.5. Agro-Processing
- 12.6. Sowing and Planting
- 12.7. Weed Cultivation
- 12.8. Land Development
- 12.9. Seed Bed Preparation
- 12.10. Others
13. By Region
- 13.1. Introduction
- 13.1.1. Market Size Analysis and Y-o-Y Growth Analysis (%), By Region
- 13.1.2. Market Attractiveness Index, By Region
- 13.2. North America
- 13.2.1. Introduction
- 13.2.2. Key Region-Specific Dynamics
- 13.2.3. Market Size Analysis and Y-o-Y Growth Analysis (%), By Type
- 13.2.4. Market Size Analysis and Y-o-Y Growth Analysis (%), By Product
- 13.2.5. Market Size Analysis and Y-o-Y Growth Analysis (%), By Distribution Channel
- 13.2.6. Market Size Analysis and Y-o-Y Growth Analysis (%), By Operation
- 13.2.7. Market Size Analysis and Y-o-Y Growth Analysis (%), By Capacity
- 13.2.8. Market Size Analysis and Y-o-Y Growth Analysis (%), By Application
- 13.2.9. Market Size Analysis and Y-o-Y Growth Analysis (%), By Country
- 13.2.9.1. U.S.
- 13.2.9.2. Canada
- 13.2.9.3. Mexico
- 13.3. Europe
- 13.3.1. Introduction
- 13.3.2. Key Region-Specific Dynamics
- 13.3.3. Market Size Analysis and Y-o-Y Growth Analysis (%), By Type
- 13.3.4. Market Size Analysis and Y-o-Y Growth Analysis (%), By Product
- 13.3.5. Market Size Analysis and Y-o-Y Growth Analysis (%), By Distribution Channel
- 13.3.6. Market Size Analysis and Y-o-Y Growth Analysis (%), By Operation
- 13.3.7. Market Size Analysis and Y-o-Y Growth Analysis (%), By Capacity
- 13.3.8. Market Size Analysis and Y-o-Y Growth Analysis (%), By Application
- 13.3.9. Market Size Analysis and Y-o-Y Growth Analysis (%), By Country
- 13.3.9.1. Germany
- 13.3.9.2. UK
- 13.3.9.3. France
- 13.3.9.4. Italy
- 13.3.9.5. Russia
- 13.3.9.6. Rest of Europe
- 13.4. South America
- 13.4.1. Introduction
- 13.4.2. Key Region-Specific Dynamics
- 13.4.3. Market Size Analysis and Y-o-Y Growth Analysis (%), By Type
- 13.4.4. Market Size Analysis and Y-o-Y Growth Analysis (%), By Product
- 13.4.5. Market Size Analysis and Y-o-Y Growth Analysis (%), By Distribution Channel
- 13.4.6. Market Size Analysis and Y-o-Y Growth Analysis (%), By Operation
- 13.4.7. Market Size Analysis and Y-o-Y Growth Analysis (%), By Capacity
- 13.4.8. Market Size Analysis and Y-o-Y Growth Analysis (%), By Application
- 13.4.9. Market Size Analysis and Y-o-Y Growth Analysis (%), By Country
- 13.4.9.1. Brazil
- 13.4.9.2. Argentina
- 13.4.9.3. Rest of South America
- 13.5. Asia-Pacific
- 13.5.1. Introduction
- 13.5.2. Key Region-Specific Dynamics
- 13.5.3. Market Size Analysis and Y-o-Y Growth Analysis (%), By Type
- 13.5.4. Market Size Analysis and Y-o-Y Growth Analysis (%), By Product
- 13.5.5. Market Size Analysis and Y-o-Y Growth Analysis (%), By Distribution Channel
- 13.5.6. Market Size Analysis and Y-o-Y Growth Analysis (%), By Operation
- 13.5.7. Market Size Analysis and Y-o-Y Growth Analysis (%), By Capacity
- 13.5.8.
- 13.5.9. Market Size Analysis and Y-o-Y Growth Analysis (%), By Application
- 13.5.10. Market Size Analysis and Y-o-Y Growth Analysis (%), By Country
- 13.5.10.1. China
- 13.5.10.2. India
- 13.5.10.3. Japan
- 13.5.10.4. Australia
- 13.5.10.5. Rest of Asia-Pacific
- 13.6. Middle East and Africa
- 13.6.1. Introduction
- 13.6.2. Key Region-Specific Dynamics
- 13.6.3. Market Size Analysis and Y-o-Y Growth Analysis (%), By Type
- 13.6.4. Market Size Analysis and Y-o-Y Growth Analysis (%), By Product
- 13.6.5. Market Size Analysis and Y-o-Y Growth Analysis (%), By Distribution Channel
- 13.6.6. Market Size Analysis and Y-o-Y Growth Analysis (%), By Operation
- 13.6.7. Market Size Analysis and Y-o-Y Growth Analysis (%), By Capacity
- 13.6.8. Market Size Analysis and Y-o-Y Growth Analysis (%), By Application
14. Competitive Landscape
- 14.1. Competitive Scenario
- 14.2. Market Positioning/Share Analysis
- 14.3. Mergers and Acquisitions Analysis
15. Company Profiles
- 15.1. AGCO Corporation*
- 15.1.1. Company Overview
- 15.1.2. Product Portfolio and Description
- 15.1.3. Financial Overview
- 15.1.4. Key Developments
- 15.2. Abanga and Grace Agro Industries Ghana Limited
- 15.3. APV GmbH
- 15.4. Bellota Agrisolutions
- 15.5. CLAAS KGaA mbH
- 15.6. Escorts Limited.
- 15.7. HORSCH
- 15.8. ISEKI & CO.,LTD.
- 15.9. J C Bamford Excavators Ltd.
- 15.10. Deere & Company.
LIST NOT EXHAUSTIVE
16. Appendix
- 16.1. About Us and Services
- 16.2. Contact Us
