|
|
市場調査レポート
商品コード
1401302
クリーンルーム技術の世界市場:2023年~2030年Global Clean Room Technologies Market - 2023-2030 |
||||||
|
|
|||||||
カスタマイズ可能
適宜更新あり
|
|||||||


| クリーンルーム技術の世界市場:2023年~2030年 |
|
出版日: 2023年12月29日
発行: DataM Intelligence
ページ情報: 英文 218 Pages
納期: 即日から翌営業日
|

- 全表示
- 概要
- 目次
概要
世界のクリーンルーム技術市場は、2022年に77億米ドルに達し、2023-2030年の予測期間中にCAGR 7.2%で成長し、2030年には134億米ドルに達すると予測されています。
インプラントや診断機器を含む医療機器の製造には、製品の無菌性を維持するためのクリーンルーム設備が必要です。高度な医療機器への需要の高まりがクリーンルーム技術の採用に寄与しています。半導体産業やエレクトロニクス産業では、マイクロエレクトロニクスや繊細な電子部品の製造にクリーンルーム環境が必要とされます。
ヘルスケアにおけるクリーンルーム導入の増加は、予測期間中の市場成長を後押しします。例えば、2023年6月12日、ヘルスケア包装のコンバーターおよびサプライヤーであるオリバーヘルスケアは、1,450平方メートルのクリーンルームを建設するために1,500万米ドルを投資しました。また、主要な主なプレーヤーによる研究開発活動の発展が、予測期間中の市場成長を後押ししています。例えば、2022年11月04日、Cochin University of Science and Technologyは、研究を後押しするために10,000クリーンルームを立ち上げました。
北米は、同地域でヘルスケア産業が成長しているため、クリーンルーム技術市場で最大の市場シェアを占めています。同地域の主要企業の中にはクリーンルーム技術を採用し、予測期間中に同地域の市場成長を後押しする企業もあります。例えば、2022年12月13日、アマゾンは、AWSクリーンルームと呼ばれるアマゾンウェブサービス用のクリーンルームを立ち上げ、プライバシーと技術を強化しました。
市場力学
世界の慢性疾患の高い有病率
慢性疾患の治療を目的とした医薬品やバイオテクノロジー製品の研究開発には、高度に管理された環境が必要とされることが多いです。研究手順の完全性を維持し、汚染を回避し、医薬品開発の規制要件に準拠するために、クリーンルーム技術はこれらの分野で非常に重要です。糖尿病、自己免疫疾患、心血管疾患などの慢性疾患治療薬の開発には、品質基準の完全な遵守が必要です。製薬業界では、医薬品製造プロセスにおいて無菌状態を維持するためにクリーンルーム設備が重要です。
世界保健機関(WHO)が2021年に発表したデータによると、慢性疾患は世界的に成人の死亡原因の第1位となっています。世界ではおよそ3人に1人が複数の慢性疾患を抱えています。米国では、10人中4人が2つ以上の慢性疾患を抱えているクリーンルーム技術は、インプラント機器や診断機器などの医療機器の製造環境において、汚染を防ぎ、製品の品質を維持するために頻繁に使用されています。
クリーンルーム技術に対する政府の厳しい規制
医薬品、バイオテクノロジー、ヘルスケア、半導体製造、航空機などの分野には、厳しい品質と安全性に関する規制が適用されています。クリーンルームを使用することで、これらのセクターは、製品が安全性、純度、品質に関する規制基準を満たしていることを保証します。政府の規則により、企業は特定の品質基準に従うことが頻繁に求められます。クリーンルーム技術は、汚染のリスクを最小限に抑え、高精度を必要とする製造作業に必要な制御された環境を提供することで、完成品の品質と安全性を保証します。
特に、バイオテクノロジーや製薬の分野では、高度に規制された環境で作業を行っています。医薬品の製造や研究において無菌状態を維持するため、適正製造基準(GMP)や医薬品安全性試験実施基準(GLP)といった厳格な基準により、クリーンルーム技術の導入が義務付けられています。また、半導体業界では、マイクロエレクトロニクス部品の製造時に汚染物質のイントロダクションを防ぐために、クリーンルーム基準の遵守が不可欠です。半導体業界団体や政府機関が定める厳しい規制が、クリーンルーム技術の採用を後押ししています。
高い運用コスト
中小企業は資金力に限りがあり、クリーンルーム技術の高い運用コストは困難です。これは、クリーンルーム設備を必要とする産業への参入や拡大の障壁となり、市場の包括性に影響を与えます。あらゆる規模の企業にとって、クリーンルーム施設の維持に関連する継続的な運用コストは、財務的な負担となります。定期的なモニタリング、メンテナンス、規制基準の遵守に関連するコストは、全体的な運営予算に寄与します。
半導体製造業や受託製造業など、伝統的に利益率の低い産業は、高い運営コストに特に敏感です。これらの業界ではクリーンルーム設備の必要性は不可欠だが、関連費用は競争力と収益性に影響します。特に製薬やバイオテクノロジーなどの分野で研究開発に携わる組織は、予算のかなりの部分をクリーンルーム環境の維持に充てています。高い運用コストは、技術革新や研究開発イニシアティブに利用できるリソースを制限します。
目次
第1章 調査手法と調査範囲
第2章 定義と概要
第3章 エグゼクティブサマリー
第4章 市場力学
- 影響要因
- 促進要因
- 世界の慢性疾患の流行
- クリーンルーム技術に対する政府の厳しい規制
- 抑制要因
- 高い運用コスト
- 機会
- 影響分析
- 促進要因
第5章 産業分析
- ポーターのファイブフォース分析
- サプライチェーン分析
- 価格分析
- 規制分析
- ロシア・ウクライナ戦争の影響分析
- DMIの見解
第6章 COVID-19分析
第7章 タイプ別
- 装置
- クリーンルーム用エアシャワー
- HVACシステム
- 層流システム
- 高効率フィルター
- デシケーターキャビネット
- ファンフィルターユニット
- その他
- 消耗品
- アパレル
- 手袋
- ワイプ
- 真空システム
- 消毒剤
第8章 構造タイプ別
- 標準/乾式壁クリーンルーム
- ハードウォールクリーンルーム
- ソフトウォールクリーンルーム
第9章 清浄度別
- ISO 1クリーンルーム
- ISO 2クリーンルーム
- ISO 3クリーンルーム
- ISO 4クリーンルーム
- ISO 5クリーンルーム
- ISO 6クリーンルーム
- ISO 7クリーンルーム
- ISO 8クリーンルーム
- ISO 9クリーンルーム
第10章 認証別
- クラス1
- クラス10
- クラス100
- クラス1000
- クラス10000
- クラス 100000
第11章 エンドユーザー別
- 製薬産業
- 半導体・電子
- バイオテクノロジー
- 医療機器メーカー
- 病院・ヘルスケア
- 自動車産業
- その他
第12章 地域別
- 北米
- 米国
- カナダ
- メキシコ
- 欧州
- ドイツ
- 英国
- フランス
- イタリア
- スペイン
- その他欧州
- 南米
- ブラジル
- アルゼンチン
- その他南米
- アジア太平洋
- 中国
- インド
- 日本
- オーストラリア
- その他アジア太平洋地域
- 中東・アフリカ
第13章 競合情勢
- 競合シナリオ
- 市況/シェア分析
- M&A分析
第14章 企業プロファイル
- Kimberly-Clark Corporation
- 会社概要
- 製品ポートフォリオと説明
- 財務概要
- 主な発展
- DuPont de Nemours, Inc.
- Azbil Corporation
- Taikisha Ltd.
- Illinois Tool Works, Inc.
- Ardmac, Ltd.
- Alpiq Group
- Clean Air Products, Inc.
- ICLEAN Technologies
- Hemair Systems
第15章 付録
Overview
Global Clean Room Technologies Market reached US$ 7.7 billion in 2022 and is expected to reach US$ 13.4 billion by 2030, growing with a CAGR of 7.2% during the forecast period 2023-2030.
The manufacturing of medical devices, including implants and diagnostic equipment, necessitates clean room facilities to maintain product sterility. The increasing demand for advanced medical devices contributes to the adoption of cleanroom technologies. The semiconductor and electronics industries require clean room environments to manufacture microelectronics and sensitive electronic components.
The growing adoption of cleanrooms in healthcare helps to boost market growth over the forecast period. For instance, on June 12, 2023, Oliver Healthcare, a converter and supplier of healthcare packaging invested US$ 15 million to build its 1,450 square metre cleanroom. Also, growing research and development activities by the major key players help to boost market growth over the forecast period. For instance, on November 04, 2022, Cochin University of Science and Technology, launched 10,000 Clean Room to boost research.
North America accounted largest market share in the clean room technologies market due to the growing healthcare industry in the region. Some of the major key players in the region adopt clean room technologies which help to boost regional market growth over the forecast period. For instance, on December 13, 2022, Amazon enhanced its privacy and technology by the launch of a clean room for Amazon Web Services called AWS Clean Rooms.
Dynamics
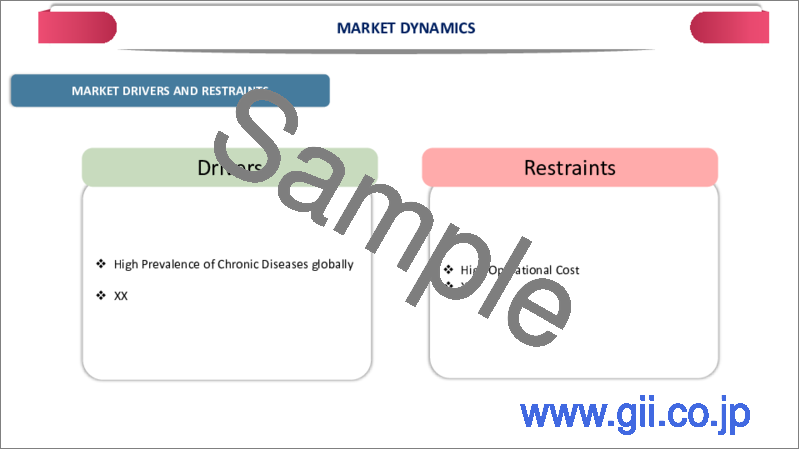
High Prevalence of Chronic Diseases globally
The research and development of pharmaceuticals and biotechnology products aimed at treating chronic diseases often require highly controlled environments. To preserve the integrity of research procedures, avoid contamination and comply with regulatory requirements for drug development, cleanroom technologies are crucial in these sectors. Complete adherence to quality standards is necessary in the development of drugs for chronic diseases such as diabetes, autoimmune disorders and cardiovascular diseases. In the pharmaceutical industry to maintain sterile conditions during the drug manufacturing process cleanroom facilities are important.
Based on data provided by the World Health Organisation in 2021, chronic illnesses are the leading cause of mortality for adults globally. Roughly one in three persons globally deal with several chronic illnesses. In United States, 4 out of 10 persons have two or more chronic diseases Cleanroom technologies are frequently used in manufacturing environments for medical devices, such as implanted devices and diagnostic equipment, to prevent contamination and preserve product quality.
Stringent Government Regulations for Cleanroom Technologies
Strict quality and safety regulations apply to sectors like pharmaceuticals, biotechnology, healthcare, semiconductor manufacturing and airplanes. Through the use of cleanrooms, these sectors ensure that their products fulfill regulatory standards for safety, purity and quality. Government rules frequently require enterprises to follow specific quality standards. Cleanroom technologies minimize the risk of contamination and guarantee the quality and safety of the finished goods by providing the controlled environments required for manufacturing operations that need high precision.
Specifically, the biotechnology and pharmaceutical sectors work in highly regulated environments. To maintain sterile conditions for medication manufacturing and research, stringent standards like Good Manufacturing Practice and Good Laboratory Practice require the implementation of cleanroom technologies. Also, in the semiconductor industry, compliance with cleanroom standards is essential to prevent the introduction of contaminants during the manufacturing of microelectronic components. Stringent regulations set by semiconductor industry associations and government bodies drive the adoption of cleanroom technologies.
High Operational Cost
Small and medium-sized enterprises (SMEs), have limited financial resources and find the high operational costs of cleanroom technologies challenging. The acts as a barrier to entry or expansion into industries that require cleanroom facilities, impacting the market's inclusivity. For companies of all sizes, the ongoing operational expenses associated with maintaining cleanroom facilities create financial strain. The costs related to regular monitoring, maintenance and compliance with regulatory standards contribute to overall operational budgets.
Industries with traditionally lower profit margins, such as semiconductor manufacturing or contract manufacturing, are especially sensitive to high operational costs. The need for cleanroom facilities in these industries is essential, but the associated expenses impact competitiveness and profitability. Organizations involved in research and development particularly in fields like pharmaceuticals and biotechnology, allocate a significant portion of their budgets to maintaining cleanroom environments. High operational costs limit the resources available for innovation and R&D initiatives.
Segment Analysis
The global cleanroom technologies market is segmented based on type, construction type, cleanliness, certification, end-user and region.
Growing Adoption of Cleanroom Technologies in the Pharmaceutical Industry
Based on the end-user, the clean room technologies market is divided into the pharmaceutical industry, semiconductor and electronic, biotechnology, foods and beverage, medical devices manufacturers, hospital and healthcare, automotive, plastic, optical and others. The pharmaceutical industry end-user segment growing rapidly over the forecast period due to the rapid industrial growth globally.
The pharmaceutical industry is expanding quickly on a globally basis. As per the 2022 data provided by Cross River Therapy company, the pharmaceutical industry in U.S. generated US$ 550 billion in revenue in 2021. Based on information provided by the Global Healthcare and Pharmaceutical Report, it is anticipated that the pharmaceutical market will reach a valuation of US$ 1.6 trillion by 2020.
The pharmaceutical industry segment accounted largest market share in the global clean room technologies market. To ensure the efficacy and safety of medicines, the pharmaceutical industry is subject to stringent regulatory standards and quality control procedures. To maintain sterile and controlled environments and meet regulatory requirements like Good production Practice standards, cleanrooms are essential to the pharmaceutical production process.
Geographical Penetration
Growing Adoption of the Clean Room Technologies Solutions in North America
North America accounted for 1/3rd of the market share in the global cleanroom technologies market due to the rising demand for cleanroom technologies in the pharmaceutical industry. The pharmaceutical and healthcare industries in U.S. are very innovative and revolutionary. In these industries, cleanrooms are necessary for conducting research and manufacturing biotechnology and pharmaceutical products. The employment of state-of-the-art cleanroom technologies is essential due to the presence of major pharmaceutical and biotechnology companies in the region.
Technological advancements in cleanroom technologies and growing product launches in the North America help to boost market growth over the forecast period. For instance, on July 16, 2020, Cleanrooms International, a United States-based company launched a mobile air ventilation unit Guardiair in the market. The newly launched mobile air filtration system minimizes airborne contagions and particles with 99.99% efficiency. It has an Indicator light for changing the HEPA filter. The newly launched instrument has a variety of powder-coat color options.
Competitive Landscape
The major global players in the market include Kimberly-Clark Corporation, DuPont de Nemours, Inc., Azbil Corporation, Taikisha Lcleanroomois Tool Works, Inc., Ardmac, Ltd., Alpiq Group, Clean Air Products, Inc., ICLEAN Technologies and Hemair Systems.
COVID-19 Impact Analysis
The pandemic led to disruptions in global supply chains, affecting the production and delivery of cleanroom technology components and equipment. Delays in the supply chain could have impacted the timely implementation of clean room projects. Many industries that utilize clean room technology, such as semiconductor manufacturing and pharmaceuticals have experienced delays or postponements in construction projects due to lockdowns, restrictions on movement and uncertainties surrounding the pandemic.
Companies across various sectors reassessed their priorities and investment plans in response to the economic challenges posed by the pandemic. Some projects related to cleanroom technology might have been delayed or scaled back as companies redirected resources to address immediate concerns. On the other side, the pharmaceutical and healthcare sectors experienced heightened demand for clean room facilities due to the urgent need for vaccine production and pharmaceutical research related to COVID-19. The increased demand has partially offset challenges faced by other industries.
Russia-Ukraine War Impact Analysis
Geopolitical tensions and conflicts disrupt global supply chains, affecting the production and delivery of components and equipment related to cleanroom technology. Companies in the clean room technology market face challenges in sourcing materials and components from regions affected by the conflict. Ongoing geopolitical tensions lead to uncertainties in the business environment. Companies delay or reconsider their investment decisions, leading to potential delays in the planning and execution of clean room projects.
Geopolitical conflicts have broader economic implications, potentially affecting the overall economic stability of the countries involved. Economic downturns or uncertainties influence the spending patterns of industries, including those relying on cleanroom technology. Geopolitical events lead to shifts in demand for cleanroom technology across regions. Industries that are more directly impacted by the conflict, such as those in the affected countries experience changes in demand for clean room facilities and technology.
By Type
- Equipment
- Cleanroom Air Showers
- HVAC Systems
- Laminar Airflow Systems
- High-Efficiency Filters
- Desiccator Cabinets
- Fan Filter Units
- Others
- Consumables
- Apparel
- Gloves
- Wipes
- Vacuum Systems
- Disinfectants
By Construction Type
- Standard/Drywall Cleanrooms
- Modular Cleanrooms
- Stick-Built Cleanrooms
- Hardwall Cleanrooms
- Steel
- Aluminum
- Other
- Softwall Cleanrooms
- Vinyl/PVC
- Polyurethane
- Other
By Cleanliness
- ISO 1 Cleanrooms
- ISO 2 Cleanrooms
- ISO 3 Cleanrooms
- ISO 4 Cleanrooms
- ISO 5 Cleanrooms
- ISO 6 Cleanrooms
- ISO 7 Cleanrooms
- ISO 8 Cleanrooms
- ISO 9 Cleanrooms
By Certification
- Class 1
- Class 10
- Class 100
- Class 1000
- Class 10000
- Class 100000
By End-User
- Pharmaceutical Industry
- Semiconductor and Electronic
- Biotechnology
- Medical Devices Manufacturers
- Hospital and Healthcare
- Automotive
- Others
By Region
- North America
- U.S.
- Canada
- Mexico
- Europe
- Germany
- UK
- France
- Italy
- Spain
- Rest of Europe
- South America
- Brazil
- Argentina
- Rest of South America
- Asia-Pacific
- China
- India
- Japan
- Australia
- Rest of Asia-Pacific
- Middle East and Africa
Key Developments
- On February 15, 2022, Integrity Cleanroom launched a new cleanroom consumable principal range. It helps to promote a positive impact socially, environmentally and economically throughout its global operation.
- On September 21, 2021, ASAP Innovations UK launched its best-selling cleanroom products. The products were launched at the Cleanroom Technology Conference at the National Conference Centre in Birmingham. The cleanroom product range includes latex gloves, for elasticity and durability and nitrile gloves, for better puncture and chemical resistance.
- On July 21, 2022, InfoSum, a data intelligence platform launched the clean room interoperability product platform sigma in the market. Through this a brand bring its first-party data and match it to a media owner with its audience data to scale that audience and control for frequency.
Why Purchase the Report?
- To visualize the global cleanroom technologies market segmentation based on type, construction type, cleanliness, certification, end-user and region, as well as understand key commercial assets and players.
- Identify commercial opportunities by analyzing trends and co-development.
- Excel data sheet with numerous data points of Clean Room Technologies market-level with all segments.
- PDF report consists of a comprehensive analysis after exhaustive qualitative interviews and an in-depth study.
- Product mapping available as excel consisting of key products of all the major players.
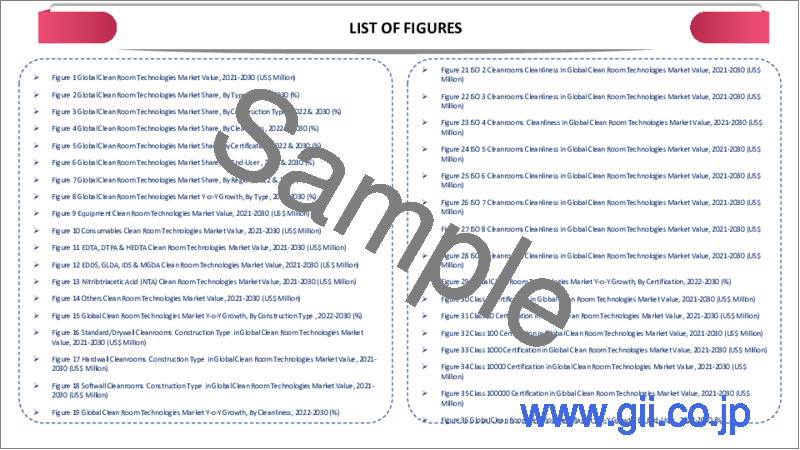
The global cleanroom technologies market report would provide approximately 77 tables, 89 figures and 218 Pages.
Target Audience 2023
- Manufacturers/ Buyers
- Industry Investors/Investment Bankers
- Research Professionals
- Emerging Companies
Table of Contents
1. Methodology and Scope
- 1.1. Research Methodology
- 1.2. Research Objective and Scope of the Report
2. Definition and Overview
3. Executive Summary
- 3.1. Snippet by Type
- 3.2. Snippet by Construction Type
- 3.3. Snippet by Cleanliness
- 3.4. Snippet by Certification
- 3.5. Snippet by End-User
- 3.6. Snippet by Region
4. Dynamics
- 4.1. Impacting Factors
- 4.1.1. Drivers
- 4.1.1.1. High Prevalence of Chronic Diseases globally
- 4.1.1.2. Stringent Government Regulations for Cleanroom Technologies
- 4.1.2. Restraints
- 4.1.2.1. High Operational Cost
- 4.1.3. Opportunity
- 4.1.4. Impact Analysis
- 4.1.1. Drivers
5. Industry Analysis
- 5.1. Porter's Five Force Analysis
- 5.2. Supply Chain Analysis
- 5.3. Pricing Analysis
- 5.4. Regulatory Analysis
- 5.5. Russia-Ukraine War Impact Analysis
- 5.6. DMI Opinion
6. COVID-19 Analysis
- 6.1. Analysis of COVID-19
- 6.1.1. Scenario Before COVID
- 6.1.2. Scenario During COVID
- 6.1.3. Scenario Post COVID
- 6.2. Pricing Dynamics Amid COVID-19
- 6.3. Demand-Supply Spectrum
- 6.4. Government Initiatives Related to the Market During Pandemic
- 6.5. Manufacturers Strategic Initiatives
- 6.6. Conclusion
7. By Type
- 7.1. Introduction
- 7.1.1. Market Size Analysis and Y-o-Y Growth Analysis (%), By Type
- 7.1.2. Market Attractiveness Index, By Type
- 7.2. Equipment*
- 7.2.1. Introduction
- 7.2.2. Market Size Analysis and Y-o-Y Growth Analysis (%)
- 7.2.3. Cleanroom Air Showers
- 7.2.4. HVAC Systems
- 7.2.5. Laminar Airflow Systems
- 7.2.6. High-Efficiency Filters
- 7.2.7. Desiccator Cabinets
- 7.2.8. Fan Filter Units
- 7.2.9. Others
- 7.3. Consumables
- 7.3.1. Apparel
- 7.3.2. Gloves
- 7.3.3. Wipes
- 7.3.4. Vacuum Systems
- 7.3.5. Disinfectants
8. By Construction Type
- 8.1. Introduction
- 8.1.1. Market Size Analysis and Y-o-Y Growth Analysis (%), By Construction Type
- 8.1.2. Market Attractiveness Index, By Construction Type
- 8.2. Standard/Drywall Cleanrooms*
- 8.2.1. Introduction
- 8.2.2. Market Size Analysis and Y-o-Y Growth Analysis (%)
- 8.3. Hardwall Cleanrooms
- 8.4. Softwall Cleanrooms
9. By Cleanliness
- 9.1. Introduction
- 9.1.1. Market Size Analysis and Y-o-Y Growth Analysis (%), By Cleanliness
- 9.1.2. Market Attractiveness Index, By Cleanliness
- 9.2. ISO 1 Cleanrooms*
- 9.2.1. Introduction
- 9.2.2. Market Size Analysis and Y-o-Y Growth Analysis (%)
- 9.3. ISO 2 Cleanrooms
- 9.4. ISO 3 Cleanrooms
- 9.5. ISO 4 Cleanrooms
- 9.6. ISO 5 Cleanrooms
- 9.7. ISO 6 Cleanrooms
- 9.8. ISO 7 Cleanrooms
- 9.9. ISO 8 Cleanrooms
- 9.10. ISO 9 Cleanrooms
10. By Certification
- 10.1. Introduction
- 10.1.1. Market Size Analysis and Y-o-Y Growth Analysis (%), By Certification
- 10.1.2. Market Attractiveness Index, By Certification
- 10.2. Class 1*
- 10.2.1. Introduction
- 10.2.2. Market Size Analysis and Y-o-Y Growth Analysis (%)
- 10.3. Class 10
- 10.4. Class 100
- 10.5. Class 1000
- 10.6. Class 10000
- 10.7. Class 100000
11. By End-User
- 11.1. Introduction
- 11.1.1. Market Size Analysis and Y-o-Y Growth Analysis (%), By End-User
- 11.1.2. Market Attractiveness Index, By End-User
- 11.2. Pharmaceutical Industry*
- 11.2.1. Introduction
- 11.2.2. Market Size Analysis and Y-o-Y Growth Analysis (%)
- 11.3. Semiconductor and Electronic
- 11.4. Biotechnology
- 11.5. Medical Devices Manufacturers
- 11.6. Hospital and Healthcare
- 11.7. Automotive
- 11.8. Others
12. By Region
- 12.1. Introduction
- 12.1.1. Market Size Analysis and Y-o-Y Growth Analysis (%), By Region
- 12.1.2. Market Attractiveness Index, By Region
- 12.2. North America
- 12.2.1. Introduction
- 12.2.2. Key Region-Specific Dynamics
- 12.2.3. Market Size Analysis and Y-o-Y Growth Analysis (%), By Type
- 12.2.4. Market Size Analysis and Y-o-Y Growth Analysis (%), By Construction Type
- 12.2.5. Market Size Analysis and Y-o-Y Growth Analysis (%), By Cleanliness
- 12.2.6. Market Size Analysis and Y-o-Y Growth Analysis (%), By Certification
- 12.2.7. Market Size Analysis and Y-o-Y Growth Analysis (%), By End-User
- 12.2.8. Market Size Analysis and Y-o-Y Growth Analysis (%), By Country
- 12.2.8.1. U.S.
- 12.2.8.2. Canada
- 12.2.8.3. Mexico
- 12.3. Europe
- 12.3.1. Introduction
- 12.3.2. Key Region-Specific Dynamics
- 12.3.3. Market Size Analysis and Y-o-Y Growth Analysis (%), By Type
- 12.3.4. Market Size Analysis and Y-o-Y Growth Analysis (%), By Construction Type
- 12.3.5. Market Size Analysis and Y-o-Y Growth Analysis (%), By Cleanliness
- 12.3.6. Market Size Analysis and Y-o-Y Growth Analysis (%), By Certification
- 12.3.7. Market Size Analysis and Y-o-Y Growth Analysis (%), By End-User
- 12.3.8. Market Size Analysis and Y-o-Y Growth Analysis (%), By Country
- 12.3.8.1. Germany
- 12.3.8.2. UK
- 12.3.8.3. France
- 12.3.8.4. Italy
- 12.3.8.5. Spain
- 12.3.8.6. Rest of Europe
- 12.4. South America
- 12.4.1. Introduction
- 12.4.2. Key Region-Specific Dynamics
- 12.4.3. Market Size Analysis and Y-o-Y Growth Analysis (%), By Type
- 12.4.4. Market Size Analysis and Y-o-Y Growth Analysis (%), By Construction Type
- 12.4.5. Market Size Analysis and Y-o-Y Growth Analysis (%), By Cleanliness
- 12.4.6. Market Size Analysis and Y-o-Y Growth Analysis (%), By Certification
- 12.4.7. Market Size Analysis and Y-o-Y Growth Analysis (%), By End-User
- 12.4.8. Market Size Analysis and Y-o-Y Growth Analysis (%), By Country
- 12.4.8.1. Brazil
- 12.4.8.2. Argentina
- 12.4.8.3. Rest of South America
- 12.5. Asia-Pacific
- 12.5.1. Introduction
- 12.5.2. Key Region-Specific Dynamics
- 12.5.3. Market Size Analysis and Y-o-Y Growth Analysis (%), By Type
- 12.5.4. Market Size Analysis and Y-o-Y Growth Analysis (%), By Construction Type
- 12.5.5. Market Size Analysis and Y-o-Y Growth Analysis (%), By Cleanliness
- 12.5.6. Market Size Analysis and Y-o-Y Growth Analysis (%), By Certification
- 12.5.7. Market Size Analysis and Y-o-Y Growth Analysis (%), By End-User
- 12.5.8. Market Size Analysis and Y-o-Y Growth Analysis (%), By Country
- 12.5.8.1. China
- 12.5.8.2. India
- 12.5.8.3. Japan
- 12.5.8.4. Australia
- 12.5.8.5. Rest of Asia-Pacific
- 12.6. Middle East and Africa
- 12.6.1. Introduction
- 12.6.2. Key Region-Specific Dynamics
- 12.6.3. Market Size Analysis and Y-o-Y Growth Analysis (%), By Type
- 12.6.4. Market Size Analysis and Y-o-Y Growth Analysis (%), By Construction Type
- 12.6.5. Market Size Analysis and Y-o-Y Growth Analysis (%), By Cleanliness
- 12.6.6. Market Size Analysis and Y-o-Y Growth Analysis (%), By Certification
- 12.6.7. Market Size Analysis and Y-o-Y Growth Analysis (%), By End-User
13. Competitive Landscape
- 13.1. Competitive Scenario
- 13.2. Market Positioning/Share Analysis
- 13.3. Mergers and Acquisitions Analysis
14. Company Profiles
- 14.1. Kimberly-Clark Corporation*
- 14.1.1. Company Overview
- 14.1.2. Product Portfolio and Description
- 14.1.3. Financial Overview
- 14.1.4. Key Developments
- 14.2. DuPont de Nemours, Inc.
- 14.3. Azbil Corporation
- 14.4. Taikisha Ltd.
- 14.5. Illinois Tool Works, Inc.
- 14.6. Ardmac, Ltd.
- 14.7. Alpiq Group
- 14.8. Clean Air Products, Inc.
- 14.9. ICLEAN Technologies
- 14.10. Hemair Systems
LIST NOT EXHAUSTIVE
15. Appendix
- 15.1. About Us and Services
- 15.2. Contact Us
