|
|
市場調査レポート
商品コード
1396653
量子コンピューティングの世界市場-2023年~2030年Global Quantum Computing Market - 2023-2030 |
||||||
|
|
|||||||
カスタマイズ可能
適宜更新あり
|
|||||||


| 量子コンピューティングの世界市場-2023年~2030年 |
|
出版日: 2023年12月15日
発行: DataM Intelligence
ページ情報: 英文 208 Pages
納期: 即日から翌営業日
|

- 全表示
- 概要
- 目次
概要
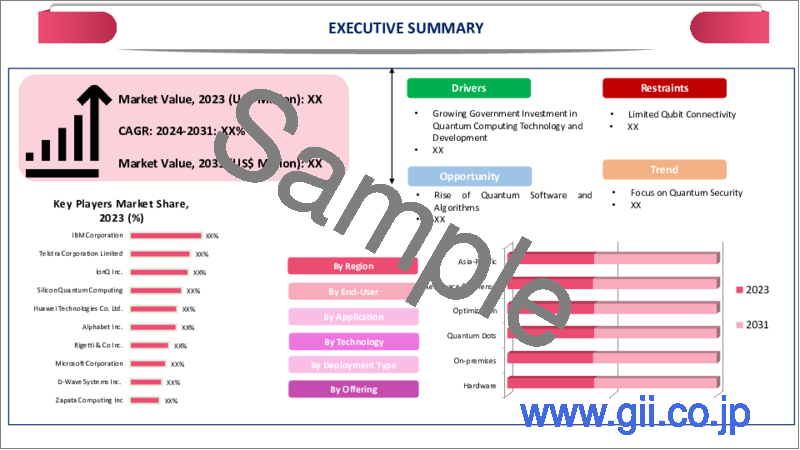
世界の量子コンピューティング市場は、2022年に6億5,010万米ドルに達し、2023-2030年の予測期間中に38.9%のCAGRで成長し、2030年には87億8,880万米ドルに達すると予測されています。
ロジスティクスや材料科学など様々な産業で量子コンピューティングの採用が拡大しており、市場の成長を後押ししています。量子コンピューティングは、分子間相互作用のシミュレーションや分子構造の最適化により、創薬の分野で有望視されています。製薬業界が創薬加速のために量子コンピューティングを活用することに関心を寄せていることは、大きな推進力となっています。
主要企業による量子コンピューティングへの投資の拡大は、予測期間中の市場成長をさらに後押しします。例えば、2023年11月2日、Nu Quantum社は量子コンピュータのネットワークインフラを構築するために700万ポンドを確保しました。この資金調達は、量子コンピュータの拡張に不可欠なエンタングルメント・ファブリックを構築するという同社のミッションを加速させるのに役立ちます。
北米では量子コンピュータの主要プレーヤーが存在感を高めており、予測期間中の市場成長を後押ししています。例えば、2023年10月26日、Alice &Bob社は北米での事業を拡大し、量子対応市場のための技術進歩を加速させました。同社は、フォールトトレラント量子コンピューティング時代のビジネスに大きなインパクトを与えることができる論理量子ビットの競争に注力しています。
力学
政府による量子技術への投資の増加
世界の政府による量子技術への投資の高まりは、量子コンピューティング市場の成長を後押ししています。各国政府は量子技術の重要性を認識しており、研究開発、商業化の取り組みを支援するための資金投入を増やしています。各国政府は、量子研究開発イニシアチブに多額の資金を提供しています。この資金は、量子コンピューティング技術の発展に携わる学術機関、研究機関、非公開会社を支援しています。
Qurecaが2023年に発表したデータによると、量子科学技術の研究と革新につながる量子への取り組みは世界的に増加しています。この投資は米国内で386億米ドルを超えます。彼らの予測によると、世界の量子技術市場は2040年までに1,060億米ドルに達すると予測されています。米国は、量子技術開発のために連邦政府資金を通じて8,540万米ドルを投資しています。
様々な産業における量子技術の採用拡大
量子コンピューティングは、複雑な物流やサプライチェーンのプロセスを最適化する可能性を秘めています。在庫管理、ルート計画、物流に関する最適化問題に対処し、より効率的で費用対効果の高いオペレーションを実現します。量子コンピューティングは、分子間の相互作用を正確にシミュレートできることから、特に研究が進められています。製薬業界やヘルスケア業界では、量子テクノロジーはモデル生物システムや創薬プロセスを加速し、個別化医療に貢献しています。
公共部門も量子技術に投資しており、予測期間2023-2030年の市場成長をさらに後押ししています。2022年、米国は18億米ドル、欧州連合は12億米ドルの資金を提供しました。中国は量子技術に153億米ドルの最高額を投資しました。量子技術への投資拡大が、2023~2030年の予測期間における市場成長を後押しします。
安定性とエラー訂正の問題
量子コンピュータは外的要因に非常に敏感で、デコヒーレンスや不安定性といった問題を引き起こします。信頼性への懸念は、ユーザーや企業が重要な計算を量子コンピュータに依存することの妨げとなっています。量子計算のエラー率は高く、計算結果の精度が制限されます。暗号アルゴリズムや複雑なシミュレーションなど、精度が重要視されるアプリケーションでは、誤差があると結果が信頼できなくなり、量子コンピュータの価値が低下します。
大きな数の因数分解や複雑な量子系のシミュレーションなど、実用的な量子コンピュータのアプリケーションの多くは、低いエラーレートを必要とします。既存の量子コンピュータのエラー率は、これらのアプリケーションで実用的な量子の利点を達成するための障壁となっています。効果的な量子エラー訂正の実装は、複雑でリソースを大量に必要とします。エラー訂正アルゴリズムには、量子ビットを追加する必要があるなど、オーバーヘッドが発生するため、量子計算のスケーラビリティと効率が損なわれます。
目次
第1章 調査手法と調査範囲
第2章 定義と概要
第3章 エグゼクティブサマリー
第4章 市場力学
- 影響要因
- 促進要因
- 政府による量子技術への投資の増加
- 様々な産業における量子技術の採用拡大
- 抑制要因
- 安定性とエラー訂正の問題
- 機会
- 影響分析
- 促進要因
第5章 産業分析
- ポーターのファイブフォース分析
- サプライチェーン分析
- 価格分析
- 規制分析
- ロシア・ウクライナ戦争の影響分析
- DMIの見解
第6章 COVID-19分析
第7章 オファリング別
- ハードウェア
- ソフトウェア
- サービス
- その他
第8章 展開タイプ別
- オンプレミス
- クラウドベース
第9章 技術別
- 量子ドット
- トラップイオン
- 量子アニーリング
第10章 用途別
- 最適化
- シミュレーションとデータ問題
- サンプリング
- 機械学習
- その他
第11章 エンドユーザー別
- 銀行、金融サービス、保険
- 航空宇宙・防衛
- 製造業
- ヘルスケア
- IT・通信
- エネルギー・ユーティリティ
- その他
第12章 地域別
- 北米
- 米国
- カナダ
- メキシコ
- 欧州
- ドイツ
- 英国
- フランス
- イタリア
- ロシア
- その他欧州
- 南米
- ブラジル
- アルゼンチン
- その他南米
- アジア太平洋
- 中国
- インド
- 日本
- オーストラリア
- その他アジア太平洋地域
- 中東・アフリカ
第13章 競合情勢
- 競合シナリオ
- 市況/シェア分析
- M&A分析
第14章 企業プロファイル
- IBM Corporation
- 会社概要
- 製品ポートフォリオと説明
- 財務概要
- 主な発展
- Telstra Corporation Limited
- IonQ Inc.
- Silicon Quantum Computing
- Huawei Technologies Co. Ltd.
- Alphabet Inc.
- Rigetti & Co Inc.
- Microsoft Corporation
- D-Wave Systems Inc.
- Zapata Computing Inc
第15章 付録
Overview
Global Quantum Computing Market reached US$ 650.1 million in 2022 and is expected to reach US$ 8,788.8 million by 2030, growing with a CAGR of 38.9% during the forecast period 2023-2030.
Growing adoption of quantum computing in various industries such as logistics and materials science helps to boost market growth. Quantum computing holds promise in the field of drug discovery by simulating molecular interactions and optimizing molecular structures. The pharmaceutical industry's interest in leveraging quantum computing for accelerated drug discovery is a significant driver.
Growing investments by major key players for quantum computing further help to boost market growth over the forecast period. For instance, on November 02, 2023, Nu Quantum secured £7m to build the networking infrastructure for quantum computers. The funding helps to accelerate the company's mission to build the entanglement fabric essential to scale quantum computers.
The growing presence of the major key players of quantum computing in the North America helps to boost regional market growth over the forecast period. For instance, on October 26, 2023, Alice & Bob expanded their business in North America and accelerated its technology advancements for the quantum-ready market. The company focused on the race to logical qubits that can create major impacts for businesses in the fault tolerant quantum computing era.
Dynamics
Rising Investment in Quantum Technology by the Government
The rising investment in quantum technology by governments globally helps to boost the market growth of the quantum computing market. Governments recognize the importance of quantum technologies and are increasingly investing funds to support research, development and commercialization efforts. Governments provide substantial funding for quantum research and development initiatives. The funding supports academic institutions, research organizations and private companies engaged in advancing quantum computing technologies.
According to the data given by Qureca in 2023, the global quantum effort leading to research and innovation in quantum science and technology is rising globally. Globally this investment exceeds US$ 38.6 billion. According to their estimation, the global quantum technology market is projected to reach US$ 106 billion by 2040. Australia has invested US$ 85.40 million through federal funding for the development of quantum technologies.
Growing Adoption of Quantum Technology in Various Industries
Quantum computing has the potential to optimize complex logistics and supply chain processes. It addresses optimization problems related to inventory management, route planning and distribution, leading to more efficient and cost-effective operations. Quantum computing is especially explored for its ability to simulate molecular interactions accurately. In the pharmaceutical and healthcare industries, quantum technology accelerates model biological systems and drug discovery processes and contributes to personalized medicine.
The public sector is also invested in quantum technology which further helps to boost market growth over the forecast period 2023-2030. In 2022, U.S. offered US$ 1.8 billion in funding and the European Union offered US$ 1.2 billion China invested the highest of US$ 15.3 billion in quantum technology. Growing investment in quantum technology help to boost market growth over the forecast period 2023-2030.
Stability and Error Correction Issues
Quantum computers are highly sensitive to external factors, leading to issues like decoherence and instability. Reliability concerns hinder the confidence of users and businesses in relying on quantum computers for critical computations. High error rates in quantum computations limit the accuracy of results. In applications where precision is crucial, such as in cryptographic algorithms or complex simulations, the presence of errors renders the outcomes unreliable and diminishes the value of quantum computing.
Many practical quantum computing applications, such as factoring large numbers or simulating complex quantum systems, require low error rates. Current error rates in existing quantum computers pose a barrier to achieving practical quantum advantage in these applications. Implementing effective quantum error correction is a complex and resource-intensive task. The overhead associated with error correction algorithms, such as the need for additional qubits, compromises the scalability and efficiency of quantum computations.
Segment Analysis
The global quantum computing market is segmented based on offering, deployment type, technology, application, end-user and region.
Quantum Computing Service Accounted Largest Market Share
Based on the offering, the quantum computing market is divided into hardware, software, service, consulting services, training & education services and others. The service offerings segment holds the largest market share in the quantum computing market. Quantum computing is a highly specialized and complex field. Many organizations, particularly those without in-house expertise, seek the assistance of service providers to navigate the intricacies of quantum technologies.
Service providers offer expertise in quantum algorithms, programming and optimization, helping clients harness the power of quantum computing without needing to develop in-house capabilities. Many quantum computing service providers offer cloud-based solutions, allowing organizations to access quantum computing resources remotely. The model reduces the barriers to entry for businesses that may not have the infrastructure or resources to maintain their quantum computers.
Growing service offerings of quantum computing help to boost segment growth over the forecast period. For instance, on March 24, 2023, a Japanese joint research group launched a quantum computing cloud service in the market. The joint research group includes RIKEN, National Institute of Advanced Industrial Science and Technology (AIST), National Institute of Information and Communications Technology (NICT), Osaka University, Fujitsu Limited, Nippon Telegraph and Telephone Corporation (NTT). Together they provide the newly developed technology to the customers in Japan as a cloud service.
Geographical Penetration
Rapid Industrial Growth in North America Helps to Boost Regional Market Growth
North America accounted largest market share 39.12% in the global quantum computing market due to rapid industrial expansion. North America is home to several leading quantum computing companies and startups. The include companies such as IBM, Google, Microsoft, Rigetti Computing and others. The presence of these industry leaders contributes significantly to the overall market share. The companies invested in research and development of quantum computing that helps to boost market growth over the forecast period.
North America attracts a substantial amount of investment and funding in the quantum computing sector. Government initiatives, private investments and venture capital funding contribute to the growth of quantum companies and research activities. Some of the major key players in the region follow merger and acquisition strategies to expand their business. For instance, on August 02, 2023, Airbus, BMW Group and Quantinuum collaborated to develop a hybrid quantum-classical workflow to speed up future research using quantum computers to simulate quantum systems.
Competitive Landscape
The major global players in the market include: IBM Corporation, Telstra Corporation Limited, IonQ Inc., Silicon Quantum Computing, Huawei Technologies Co. Ltd., Alphabet Inc., Rigetti & Co Inc., Microsoft Corporation, D-Wave Systems Inc. and Zapata Computing Inc.
COVID-19 Impact Analysis
The pandemic has disrupted research and development activities in the quantum computing sector, especially in terms of laboratory closures, restrictions on physical access to facilities and challenges in conducting experiments. Like many other industries, the quantum computing market has faced supply chain disruptions. Delays in the production and delivery of components and hardware impact timelines for quantum computing projects.
Governments and organizations globally shifted priorities and allocated resources to address immediate health and economic concerns during the pandemic. The has influenced funding and support for long-term research projects, including those in quantum computing. The pandemic highlighted the importance of digital technologies, remote collaboration and advanced computing. The increased focus on digital transformation has led to a growing interest in quantum computing as a potential solution for complex problems.
Russia-Ukraine War Impact Analysis
Geopolitical conflicts lead to global economic uncertainty, which affects investment decisions, funding and the overall business environment. Companies, including those in the quantum computing sector, reassess their strategies and timelines in response to economic uncertainties. Geopolitical tensions and conflicts potentially lead to disruptions in global supply chains. The impacts the availability of certain components or materials crucial for the manufacturing of quantum computing hardware.
Quantum computing is a field that often involves international collaboration and the movement of skilled researchers and scientists. Geopolitical tensions impact research collaborations and the mobility of talent, which influence the pace of advancements in the field. Government support and policies play a significant role in the development of emerging technologies, including quantum computing. Geopolitical events influence government priorities, funding allocations and regulatory environments for quantum research and development.
By Offering
- Hardware
- Software
- Service
By Deployment Type
- On-premises
- Cloud-based
By Technology
- Quantum Dots
- Trapped Ions
- Quantum Annealing
By Application
- Optimization
- Simulation and Data Problems
- Sampling
- Machine Learning
- Others
By End-User
- Banking, Financial Services and Insurance
- Aerospace & Defense
- Manufacturing
- Healthcare
- IT & Telecom
- Energy & Utilities
- Others
By Region
- North America
- U.S.
- Canada
- Mexico
- Europe
- Germany
- UK
- France
- Italy
- Russia
- Rest of Europe
- South America
- Brazil
- Argentina
- Rest of South America
- Asia-Pacific
- China
- India
- Japan
- Australia
- Rest of Asia-Pacific
- Middle East and Africa
Key Developments
- On November 28, 2022, Tata Consultancy Services launched a virtual quantum computing lab on Amazon Web Services (AWS) to develop and test enterprise business solutions and also accelerate the adoption of quantum computing. It helps to consumers design solutions in areas like portfolio risk evaluation, secure communication ecosystems, predicting customer behavior and production planning.
- On August 15, 2023, StackPath, a leading Quantum Computing platform launched StackPath Edge Compute Virtual Machine and Container instances featuring higher virtual CPU (vCPU) core counts and included RAM.
- On March 21, 2023, NVIDIA, announced a new system to accelerate Quantum-Classical Computing. It has the potential to build extraordinarily powerful applications that combine quantum computing with state-of-the-art classical computing, enabling calibration, control, quantum error correction and hybrid algorithms.
Why Purchase the Report?
- To visualize the global quantum computing market segmentation based on offering, deployment type, technology, application, end-user and region, as well as understand key commercial assets and players.
- Identify commercial opportunities by analyzing trends and co-development.
- Excel data sheet with numerous data points of quantum computing market-level with all segments.
- PDF report consists of a comprehensive analysis after exhaustive qualitative interviews and an in-depth study.
- Product mapping available as excel consisting of key products of all the major players.
The global quantum computing market report would provide approximately 77 tables, 85 figures and 208 Pages.
Target Audience 2023
- Manufacturers/ Buyers
- Industry Investors/Investment Bankers
- Research Professionals
- Emerging Companies
Table of Contents
1. Methodology and Scope
- 1.1. Research Methodology
- 1.2. Research Objective and Scope of the Report
2. Definition and Overview
3. Executive Summary
- 3.1. Snippet by Offering
- 3.2. Snippet by Deployment Type
- 3.3. Snippet by Technology
- 3.4. Snippet by Application
- 3.5. Snippet by End-User
- 3.6. Snippet by Region
4. Dynamics
- 4.1. Impacting Factors
- 4.1.1. Drivers
- 4.1.1.1. Rising Investment in Quantum Technology by Government
- 4.1.1.2. Growing Adoption of Quantum Technology in Various Industries
- 4.1.2. Restraints
- 4.1.2.1. Stability and Error Correction Issues
- 4.1.3. Opportunity
- 4.1.4. Impact Analysis
- 4.1.1. Drivers
5. Industry Analysis
- 5.1. Porter's Five Force Analysis
- 5.2. Supply Chain Analysis
- 5.3. Pricing Analysis
- 5.4. Regulatory Analysis
- 5.5. Russia-Ukraine War Impact Analysis
- 5.6. DMI Opinion
6. COVID-19 Analysis
- 6.1. Analysis of COVID-19
- 6.1.1. Scenario Before COVID
- 6.1.2. Scenario During COVID
- 6.1.3. Scenario Post COVID
- 6.2. Pricing Dynamics Amid COVID-19
- 6.3. Demand-Supply Spectrum
- 6.4. Government Initiatives Related to the Market During Pandemic
- 6.5. Manufacturers Strategic Initiatives
- 6.6. Conclusion
7. By Offering
- 7.1. Introduction
- 7.1.1. Market Size Analysis and Y-o-Y Growth Analysis (%), By Offering
- 7.1.2. Market Attractiveness Index, By Offering
- 7.2. Hardware*
- 7.2.1. Introduction
- 7.2.2. Market Size Analysis and Y-o-Y Growth Analysis (%)
- 7.3. Software
- 7.4. Service
- 7.5. Others
8. By Deployment Type
- 8.1. Introduction
- 8.1.1. Market Size Analysis and Y-o-Y Growth Analysis (%), By Deployment Type
- 8.1.2. Market Attractiveness Index, By Deployment Type
- 8.2. On-premises*
- 8.2.1. Introduction
- 8.2.2. Market Size Analysis and Y-o-Y Growth Analysis (%)
- 8.3. Cloud-based
9. By Technology
- 9.1. Introduction
- 9.1.1. Market Size Analysis and Y-o-Y Growth Analysis (%), By Technology
- 9.1.2. Market Attractiveness Index, By Technology
- 9.2. Quantum Dots*
- 9.2.1. Introduction
- 9.2.2. Market Size Analysis and Y-o-Y Growth Analysis (%)
- 9.3. Trapped Ions
- 9.4. Quantum Annealing
10. By Application
- 10.1. Introduction
- 10.1.1. Market Size Analysis and Y-o-Y Growth Analysis (%), By Application
- 10.1.2. Market Attractiveness Index, By Application
- 10.2. Optimization*
- 10.2.1. Introduction
- 10.2.2. Market Size Analysis and Y-o-Y Growth Analysis (%)
- 10.3. Simulation and Data Problems
- 10.4. Sampling
- 10.5. Machine Learning
- 10.6. Others
11. By End-User
- 11.1. Introduction
- 11.1.1. Market Size Analysis and Y-o-Y Growth Analysis (%), By End-User
- 11.1.2. Market Attractiveness Index, By End-User
- 11.2. Banking, Financial Services and Insurance*
- 11.2.1. Introduction
- 11.2.2. Market Size Analysis and Y-o-Y Growth Analysis (%)
- 11.3. Aerospace & Defense
- 11.4. Manufacturing
- 11.5. Healthcare
- 11.6. IT & Telecom
- 11.7. Energy & Utilities
- 11.8. Others
12. By Region
- 12.1. Introduction
- 12.1.1. Market Size Analysis and Y-o-Y Growth Analysis (%), By Region
- 12.1.2. Market Attractiveness Index, By Region
- 12.2. North America
- 12.2.1. Introduction
- 12.2.2. Key Region-Specific Dynamics
- 12.2.3. Market Size Analysis and Y-o-Y Growth Analysis (%), By Offering
- 12.2.4. Market Size Analysis and Y-o-Y Growth Analysis (%), By Deployment Type
- 12.2.5. Market Size Analysis and Y-o-Y Growth Analysis (%), By Technology
- 12.2.6. Market Size Analysis and Y-o-Y Growth Analysis (%), By Application
- 12.2.7. Market Size Analysis and Y-o-Y Growth Analysis (%), By End-User
- 12.2.8. Market Size Analysis and Y-o-Y Growth Analysis (%), By Country
- 12.2.8.1. U.S.
- 12.2.8.2. Canada
- 12.2.8.3. Mexico
- 12.3. Europe
- 12.3.1. Introduction
- 12.3.2. Key Region-Specific Dynamics
- 12.3.3. Market Size Analysis and Y-o-Y Growth Analysis (%), By Offering
- 12.3.4. Market Size Analysis and Y-o-Y Growth Analysis (%), By Deployment Type
- 12.3.5. Market Size Analysis and Y-o-Y Growth Analysis (%), By Technology
- 12.3.6. Market Size Analysis and Y-o-Y Growth Analysis (%), By Application
- 12.3.7. Market Size Analysis and Y-o-Y Growth Analysis (%), By End-User
- 12.3.8. Market Size Analysis and Y-o-Y Growth Analysis (%), By Country
- 12.3.8.1. Germany
- 12.3.8.2. UK
- 12.3.8.3. France
- 12.3.8.4. Italy
- 12.3.8.5. Russia
- 12.3.8.6. Rest of Europe
- 12.4. South America
- 12.4.1. Introduction
- 12.4.2. Key Region-Specific Dynamics
- 12.4.3. Market Size Analysis and Y-o-Y Growth Analysis (%), By Offering
- 12.4.4. Market Size Analysis and Y-o-Y Growth Analysis (%), By Deployment Type
- 12.4.5. Market Size Analysis and Y-o-Y Growth Analysis (%), By Technology
- 12.4.6. Market Size Analysis and Y-o-Y Growth Analysis (%), By Application
- 12.4.7. Market Size Analysis and Y-o-Y Growth Analysis (%), By End-User
- 12.4.8. Market Size Analysis and Y-o-Y Growth Analysis (%), By Country
- 12.4.8.1. Brazil
- 12.4.8.2. Argentina
- 12.4.8.3. Rest of South America
- 12.5. Asia-Pacific
- 12.5.1. Introduction
- 12.5.2. Key Region-Specific Dynamics
- 12.5.3. Market Size Analysis and Y-o-Y Growth Analysis (%), By Offering
- 12.5.4. Market Size Analysis and Y-o-Y Growth Analysis (%), By Deployment Type
- 12.5.5. Market Size Analysis and Y-o-Y Growth Analysis (%), By Technology
- 12.5.6. Market Size Analysis and Y-o-Y Growth Analysis (%), By Application
- 12.5.7. Market Size Analysis and Y-o-Y Growth Analysis (%), By End-User
- 12.5.8. Market Size Analysis and Y-o-Y Growth Analysis (%), By Country
- 12.5.8.1. China
- 12.5.8.2. India
- 12.5.8.3. Japan
- 12.5.8.4. Australia
- 12.5.8.5. Rest of Asia-Pacific
- 12.6. Middle East and Africa
- 12.6.1. Introduction
- 12.6.2. Key Region-Specific Dynamics
- 12.6.3. Market Size Analysis and Y-o-Y Growth Analysis (%), By Offering
- 12.6.4. Market Size Analysis and Y-o-Y Growth Analysis (%), By Deployment Type
- 12.6.5. Market Size Analysis and Y-o-Y Growth Analysis (%), By Technology
- 12.6.6. Market Size Analysis and Y-o-Y Growth Analysis (%), By Application
- 12.6.7. Market Size Analysis and Y-o-Y Growth Analysis (%), By End-User
13. Competitive Landscape
- 13.1. Competitive Scenario
- 13.2. Market Positioning/Share Analysis
- 13.3. Mergers and Acquisitions Analysis
14. Company Profiles
- 14.1. IBM Corporation*
- 14.1.1. Company Overview
- 14.1.2. Product Portfolio and Description
- 14.1.3. Financial Overview
- 14.1.4. Key Developments
- 14.2. Telstra Corporation Limited
- 14.3. IonQ Inc.
- 14.4. Silicon Quantum Computing
- 14.5. Huawei Technologies Co. Ltd.
- 14.6. Alphabet Inc.
- 14.7. Rigetti & Co Inc.
- 14.8. Microsoft Corporation
- 14.9. D-Wave Systems Inc.
- 14.10. Zapata Computing Inc
LIST NOT EXHAUSTIVE
15. Appendix
- 15.1. About Us and Services
- 15.2. Contact Us
