|
|
市場調査レポート
商品コード
1396627
バイオ肥料の世界市場- 2023年~2030年Global Biofertilizer Market - 2023-2030 |
||||||
|
|
|||||||
|
● お客様のご希望に応じて、既存データの加工や未掲載情報(例:国別セグメント)の追加などの対応が可能です。 詳細はお問い合わせください。 |
|||||||


| バイオ肥料の世界市場- 2023年~2030年 |
|
出版日: 2023年12月15日
発行: DataM Intelligence
ページ情報: 英文 194 Pages
納期: 約2営業日
|
- 全表示
- 概要
- 目次
概要
世界のバイオ肥料市場は、2022年に25億6,000万米ドルに達し、2023-2030年の予測期間中にCAGR 12.6%で成長し、2030年には66億5,000万米ドルに達すると予測されています。
世界のバイオ肥料市場は、長年にわたって著しい成長と変貌を遂げており、農家は様々な作物でバイオ肥料を大いに採用しています。バイオ肥料にはバクテリア、菌類、藻類などの生きた微生物が含まれており、植物による栄養分の利用可能性と栄養分の取り込みを高めるからです。また、植物の成長に寄与する土壌中の自然なプロセスを促進します。したがって、そのような要因は、世界のバイオ肥料市場の成長を促進するのに役立ちます。
例えば、2023年8月、バイオコントロール技術、バイオ刺激剤、バイオ肥料を専門とするBionema Group Ltd.は、英国でバイオ肥料製品の新シリーズを発売しました。これらの製品は、農業、園芸、林業、スポーツ用芝生、アメニティ用として設計されています。したがって、このような製品はバイオ肥料の採用率を高めるのに役立ちます。
菌根菌ベースのバイオ肥料は、世界市場で最大のシェアを占めています。また、アジア太平洋地域は農地が多く、オーストリアは4億2,700万ヘクタールの農地があるため、バイオ肥料の最大の消費国です。
力学
無化学肥料需要の増加
例えば、2022年のインドにおけるバイオ肥料と有機肥料の現状報告書によると、2020-21年にインドで生産された担体ベースの固形バイオ肥料は約1,34,323トンでした。タミル・ナードゥ州はキャリアベースの固形バイオ肥料の最大の生産者で、2020-21年の総生産量の48%を占めました。
さらに、有益な微生物の活動を促進することで土壌の健全性を向上させるバイオ肥料の採用が増加しています。バイオ肥料は土壌構造を維持し、保水力を高め、化学合成物質の必要性を減らすのに役立ちます。したがって、このような要因は市場成長の増加に役立ちます。
有機農業の増加
有機農業の需要は増加しており、例えば、National Programme of Organic Productionの報告書によると、2021-22年における有機認証プロセス下の総面積は9119865.91 hactersであり、インドの有機認証製品の生産量は約3430735.65 MT(2021-22年)です。したがって、このような高い生産率は市場の成長を後押しするのに役立ちます。
さらに、有機農業の需要が増加しているため、バイオ肥料の需要が増加しています。これらのバイオ肥料は、有益な微生物の活動を促進し、土壌構造を改善し、栄養の利用可能性を高めることによって土壌の健康に貢献するためです。
高い生産コスト
特殊で効果的なバイオ肥料の生産には、特別な設備とメンテナンスが必要であり、これによって製品に追加の製造コストがかかる可能性があります。また、バイオ肥料は化学合成肥料に比べて保存期間が短いため、特別な保管条件が必要であり、これが生産コストに影響する可能性があります。したがって、高い生産コストは市場の成長を妨げる可能性があります。
目次
第1章 調査手法と調査範囲
第2章 定義と概要
第3章 エグゼクティブサマリー
第4章 市場力学
- 影響要因
- 促進要因
- 無化学肥料需要の増加
- 有機農業の増加
- 抑制要因
- 高い生産コスト
- 機会
- 影響分析
- 促進要因
第5章 産業分析
- ポーターのファイブフォース分析
- サプライチェーン分析
- 価格分析
- 規制分析
第6章 COVID-19の分析
第7章 微生物別
- アゾトバクター
- アゾスピリラム
- シアノバクテリア
- 菌根菌
- リン酸可溶菌
- 根粒菌
- その他
第8章 タイプ別
- カリ固定化
- 窒素固定
- リン酸可溶化
- その他
第9章 形態別
- 液体
- 顆粒
- 粉末
- その他
第10章 流通チャネル別
- eコマース
- ハイパーマーケット/スーパーマーケット
- 専門店
- その他
第11章 作物タイプ別
- 果物・野菜
- 油糧種子・豆類
- 穀物
- その他
第12章 用途別
- 土壌処理
- 種子処理
- その他
第13章 地域別
- 北米
- 米国
- カナダ
- メキシコ
- 欧州
- ドイツ
- 英国
- フランス
- イタリア
- ロシア
- その他欧州
- 南米
- ブラジル
- アルゼンチン
- その他南米
- アジア太平洋
- 中国
- インド
- 日本
- オーストラリア
- その他アジア太平洋地域
- 中東・アフリカ
第14章 競合情勢
- 競合シナリオ
- 市況/シェア分析
- M&A分析
第15章 企業プロファイル
- Katyani Organics
- 会社概要
- 製品ポートフォリオと説明
- 財務概要
- 主な発展
- Peptech Biosciences Ltd.
- Novozymes
- UPL
- Chr. Hansen Holding A/S
- Lallemand Inc.
- IPL Biologicals
- Gujarat State Fertilizers & Chemicals Limited
- BioWorks, Inc.
- T.Stanes and Company Limited
第16章 付録
Overview
Global Biofertilizer Market reached US$ 2.56 billion in 2022 and is expected to reach US$ 6.65 billion by 2030, growing with a CAGR of 12.6% during the forecast period 2023-2030.
The global biofertilizer market has witnessed significant growth and transformations over the years, farmers are highly adopting biofertilizers in various crops as they contain living microorganisms, such as bacteria, fungi, and algae, which enhance nutrient availability and nutrient uptake by plants. Also, they promote the natural processes in the soil that contribute to plant growth. Hence, such factors help in driving the global biofertilizers market growth.
Furthermore, many manufacturing companies are launching different products to expand their portfolios, for instance, in August 2023, Bionema Group Ltd., specializing in biocontrol technology, biostimulants, and biofertilizers, launched a new series of biofertilizer products in the United Kingdom. These products are designed for application in agriculture, horticulture, forestry, sports turf, and amenities. Hence, such products can help in increasing the adoption rate of biofertilizers.
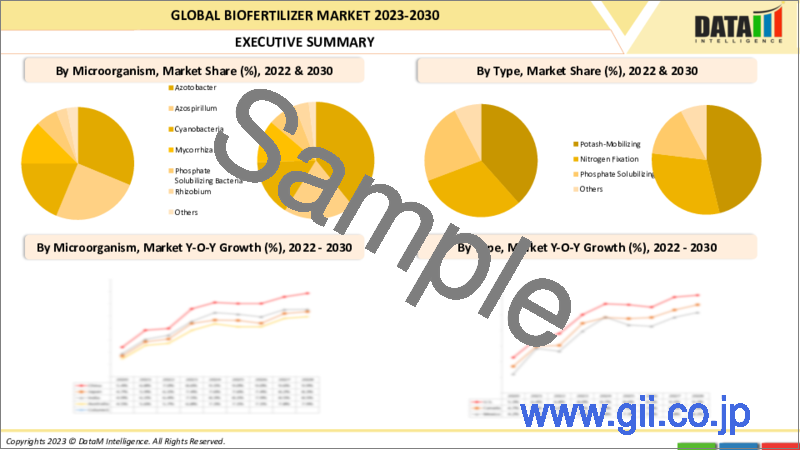
The mycorrhiza-based biofertilizers hold the maximum share in the global market, as well as the Asia Pacific region has the largest share in the global biofertilizers market, as the region has high agricultural land, Austrian remains the largest consumer of biofertilizers as this 427 million hectares of agricultural land.
Dynamics
Increase in Demand for Chemical-Free Fertilizers
The demand for chemical-free fertilizers is increasing, for instance, according to the State of BioFertilizers and Organic Fertilizers in India report of 2022, In 2020-21, India produced about 1,34,323 tonnes of carrier-based solid biofertilizers. Tamil Nadu was the biggest producer of carrier-based solid biofertilizers with 48 % of total production in 2020-21.
Furthermore, the adoption of biofertilizers is increasing, as these contribute to improving soil health by promoting beneficial microbial activity. They help in maintaining soil structure, increasing water retention, and reducing the need for synthetic chemicals. Hence, such factors can help in increasing the market growth.
Increase Organic Farming
The demand for organic farming is increasing, for instance, according to the National Programme of Organic Production report, the total area under the organic certification process is 9119865.91 hacters in 2021-22, and India produced around 3430735.65 MT (2021-22) of certified organic products. Hence, such high production rates can help in boosting the market growth.
Furthermore, as the demand for organic farming is rising, which increases the demand for biofertilizers as these biofertilizers contribute to soil health by promoting beneficial microbial activity, improving soil structure, and enhancing nutrient availability. which helps in increasing crop productivity, hence, it can help in increasing the market growth.
High Production Cost
The production of specialized and effective biofertilizers requires special equipment and maintenance which can add additional manufacturing costs to the product also these biofertilizers require special storage conditions as their shelf life is low compared to synthetic chemical fertilizers, which can affect the production cost. Hence, the high production cost can hamper the market growth.
Segment Analysis
The global biofertilizer market is segmented based on the microorganism, type, form, distribution channel, crop type, application, and region.
Increase in Demand for Nutritive Fertilizers
The mycorrhiza segment holds the maximum share in the global biofertilizers market, farmers are highly adopting these mycorrhiza biofertilizers as they enhance their ability to improve phosphorus uptake by plants, also plants natural defense mechanisms, providing a degree of protection against certain soil-borne pathogens. Hence, such factors can help in increasing the market growth.
Furthermore, as the demand for these products is increasing, manufacturers are highly investing in these products, for instance, in August 2022, The Energy and Resources Institute's (TERI) SMART Agrisolutions, Chambal Fertilizers and Chemicals Limited (CFCL) partnered and launched a Uttam Superrhiza, which is a advanced mycorrhizal biofertilizer product. Hence, such products can help in increasing the market growth.
Geographical Penetration
Presence of Agricultural Land and Government Initiatives
The Asia-Pacific region has shown a maximum share in the global biofertilizers market, as the demand for crop productivity and government support is increasing, farmers in this region are highly adopting these biofertilizers as they enhance nutrient availability and nutrient uptake by plants. Hence, such factors can help in increasing the market growth.
Furthermore, the region has the presence of vast agricultural lands, for instance, according to the Department of Agricultural, Fisheries, and Forestry report of 2023, Australia has 427 million hectares, which is around 55% agricultural land in use. Hence, such a high presence of agricultural land can help in increasing the adoption rate of biofertilizers.
Additionally, the government in this region has provided some schemes and programs in order to encourage the use of biofertilizers, for instance, the government of India has provided the National Mission on Oilseeds and Oil Palm (NMOOP), which provides financial assistance of 50% subsidy to the tune of Rs. 300/- per hectare for different components including bio-fertilizers, supply of Rhizobium culture/Phosphate Solubilizing Bacteria (PSB)/ Zinc Solubilizing Bacteria(ZSB)/ Azotobacter/ Mycorrhiza and vermicompost.
Competitive Landscape
The major global players in the market include: Katyani Organics, Peptech Biosciences Ltd., Novozymes, UPL, Chr. Hansen Holding A/S, Lallemand Inc., IPL Biologicals, Gujarat State Fertilizers & Chemicals Limited, BioWorks, Inc., and T.Stanes and Company Limited.
COVID-19 Impact Analysis
The sudden outburst of coronavirus has affected numerous industries including the COVID-19 pandemic has had a significant impact on the global biofertilizers market. The COVID-19 pandemic has disrupted supply chains globally, leading to shortages of raw materials and delays in transportation; this has had an impact on the production and distribution of biofertilizers, resulting in reduced availability and increased prices.
By Microorganisms
- Azotobacter
- Azospirillum
- Cyanobacteria
- Mycorrhiza
- Phosphate Solubilizing Bacteria
- Rhizobium
- Others
By Type
- Potash-Mobilizing
- Nitrogen Fixation
- Phosphate Solubilizing
- Others
By Form
- Liquid
- Granules
- Powder
- Others
By Distribution Channel
- E-Commerce
- Hypermarkets/Supermarkets
- Specialty Stores
- Others
By Crop Type
- Fruits and Vegetables
- Oilseeds & Pulses
- Cereals & Grains
- Others
By Application
- Soil Treatment
- Seed Treatment
- Others
By Region
- North America
- U.S.
- Canada
- Mexico
- Europe
- Germany
- UK
- France
- Italy
- Russia
- Rest of Europe
- South America
- Brazil
- Argentina
- Rest of South America
- Asia-Pacific
- China
- India
- Japan
- Australia
- Rest of Asia-Pacific
- Middle East and Africa
Key Developments
- In September 2022, Corteva, Inc. acquired Symborg, an expert in microbiological technologies based in Murcia, Spain. This acquisition is to accelerate the development of a best-in-class biological portfolio.
Why Purchase the Report?
- To visualize the global biofertilizer microorganisms, type, form, distribution channel, crop type, application, and region, as well as understand key commercial assets and players.
- Identify commercial opportunities by analyzing trends and co-development.
- Excel data sheet with numerous data points of biofertilizer market-level with all segments.
- PDF report consists of a comprehensive analysis after exhaustive qualitative interviews and an in-depth study.
- Product mapping available as Excel consisting of key products of all the major players.
The global biofertilizer market report would provide approximately 85 tables, 95 figures and 194 Pages.
Target Audience 2023
- Manufacturers/ Buyers
- Industry Investors/Investment Bankers
- Research Professionals
- Emerging Companies
Table of Contents
1. Methodology and Scope
- 1.1. Research Methodology
- 1.2. Research Objective and Scope of the Report
2. Definition and Overview
3. Executive Summary
- 3.1. Snippet by Microorganism
- 3.2. Snippet by Type
- 3.3. Snippet by Form
- 3.4. Snippet by Distribution Channel
- 3.5. Snippet by Crop Type
- 3.6. Snippet by Application
- 3.7. Snippet by Region
4. Dynamics
- 4.1. Impacting Factors
- 4.1.1. Drivers
- 4.1.1.1. Increase in Demand for Chemical-Free Fertilizers
- 4.1.1.2. Increase Organic Farming
- 4.1.2. Restraints
- 4.1.2.1. High Production Cost
- 4.1.3. Opportunity
- 4.1.4. Impact Analysis
- 4.1.1. Drivers
5. Industry Analysis
- 5.1. Porter's Five Force Analysis
- 5.2. Supply Chain Analysis
- 5.3. Pricing Analysis
- 5.4. Regulatory Analysis
6. COVID-19 Analysis
- 6.1. Analysis of COVID-19
- 6.1.1. Scenario Before COVID
- 6.1.2. Scenario During COVID
- 6.1.3. Scenario Post COVID
- 6.2. Pricing Dynamics Amid COVID-19
- 6.3. Demand-Supply Spectrum
- 6.4. Government Initiatives Related to the Market During Pandemic
- 6.5. Manufacturers Strategic Initiatives
- 6.6. Conclusion
7. By Microorganism
- 7.1. Introduction
- 7.1.1. Market Size Analysis and Y-o-Y Growth Analysis (%), By Microorganism
- 7.1.2. Market Attractiveness Index, By Microorganism
- 7.2. Azotobacter*
- 7.2.1. Introduction
- 7.2.2. Market Size Analysis and Y-o-Y Growth Analysis (%)
- 7.3. Azospirillum
- 7.4. Cyanobacteria
- 7.5. Mycorrhiza
- 7.6. Phosphate Solubilizing Bacteria
- 7.7. Rhizobium
- 7.8. Others
8. By Type
- 8.1. Introduction
- 8.1.1. Market Size Analysis and Y-o-Y Growth Analysis (%), By Type
- 8.1.2. Market Attractiveness Index, By Type
- 8.2. Potash-Mobilizing*
- 8.2.1. Introduction
- 8.2.2. Market Size Analysis and Y-o-Y Growth Analysis (%)
- 8.2.3. Nitrogen Fixation
- 8.2.4. Phosphate Solubilizing
- 8.2.5. Others
9. By Form
- 9.1. Introduction
- 9.1.1. Market Size Analysis and Y-o-Y Growth Analysis (%), By Form
- 9.1.2. Market Attractiveness Index, By Form
- 9.2. Liquid*
- 9.2.1. Introduction
- 9.2.2. Market Size Analysis and Y-o-Y Growth Analysis (%)
- 9.3. Granules
- 9.4. Powder
- 9.5. Others
10. By Distribution Channel
- 10.1. Introduction
- 10.1.1. Market Size Analysis and Y-o-Y Growth Analysis (%), By Distribution Channel
- 10.1.2. Market Attractiveness Index, By Distribution Channel
- 10.2. E-Commerce*
- 10.2.1. Introduction
- 10.2.2. Market Size Analysis and Y-o-Y Growth Analysis (%),
- 10.3. Hypermarkets/Supermarkets
- 10.4. Specialty Stores
- 10.5. Others
11. By Crop Type
- 11.1. Introduction
- 11.1.1. Market Size Analysis and Y-o-Y Growth Analysis (%), By Crop Type
- 11.1.2. Market Attractiveness Index, By Crop Type
- 11.2. Fruits and Vegetables*
- 11.2.1. Introduction
- 11.2.2. Market Size Analysis and Y-o-Y Growth Analysis (%)
- 11.3. Oilseeds & Pulses
- 11.4. Cereals & Grains
- 11.5. Others
12. By Application
- 12.1. Introduction
- 12.1.1. Market Size Analysis and Y-o-Y Growth Analysis (%), By Application
- 12.1.2. Market Attractiveness Index, By Application
- 12.2. Soil Treatment *
- 12.2.1. Introduction
- 12.2.2. Market Size Analysis and Y-o-Y Growth Analysis (%)
- 12.3. Seed Treatment
- 12.4. Others
13. By Region
- 13.1. Introduction
- 13.1.1. Market Size Analysis and Y-o-Y Growth Analysis (%), By Region
- 13.1.2. Market Attractiveness Index, By Region
- 13.2. North America
- 13.2.1. Introduction
- 13.2.2. Key Region-Specific Dynamics
- 13.2.3. Market Size Analysis and Y-o-Y Growth Analysis (%), By Microorganism
- 13.2.4. Market Size Analysis and Y-o-Y Growth Analysis (%), By Type
- 13.2.5. Market Size Analysis and Y-o-Y Growth Analysis (%), By Form
- 13.2.6. Market Size Analysis and Y-o-Y Growth Analysis (%), By Distribution Channel
- 13.2.7. Market Size Analysis and Y-o-Y Growth Analysis (%), By Crop Type
- 13.2.8. Market Size Analysis and Y-o-Y Growth Analysis (%), By Application
- 13.2.9. Market Size Analysis and Y-o-Y Growth Analysis (%), By Country
- 13.2.9.1. U.S.
- 13.2.9.2. Canada
- 13.2.9.3. Mexico
- 13.3. Europe
- 13.3.1. Introduction
- 13.3.2. Key Region-Specific Dynamics
- 13.3.3. Market Size Analysis and Y-o-Y Growth Analysis (%), By Microorganism
- 13.3.4. Market Size Analysis and Y-o-Y Growth Analysis (%), By Type
- 13.3.5. Market Size Analysis and Y-o-Y Growth Analysis (%), By Form
- 13.3.6. Market Size Analysis and Y-o-Y Growth Analysis (%), By Distribution Channel
- 13.3.7. Market Size Analysis and Y-o-Y Growth Analysis (%), By Crop Type
- 13.3.8. Market Size Analysis and Y-o-Y Growth Analysis (%), By Application
- 13.3.9. Market Size Analysis and Y-o-Y Growth Analysis (%), By Country
- 13.3.9.1. Germany
- 13.3.9.2. UK
- 13.3.9.3. France
- 13.3.9.4. Italy
- 13.3.9.5. Russia
- 13.3.9.6. Rest of Europe
- 13.4. South America
- 13.4.1. Introduction
- 13.4.2. Key Region-Specific Dynamics
- 13.4.3. Market Size Analysis and Y-o-Y Growth Analysis (%), By Microorganism
- 13.4.4. Market Size Analysis and Y-o-Y Growth Analysis (%), By Type
- 13.4.5. Market Size Analysis and Y-o-Y Growth Analysis (%), By Form
- 13.4.6. Market Size Analysis and Y-o-Y Growth Analysis (%), By Distribution Channel
- 13.4.7. Market Size Analysis and Y-o-Y Growth Analysis (%), By Crop Type
- 13.4.8. Market Size Analysis and Y-o-Y Growth Analysis (%), By Application
- 13.4.9. Market Size Analysis and Y-o-Y Growth Analysis (%), By Country
- 13.4.9.1. Brazil
- 13.4.9.2. Argentina
- 13.4.9.3. Rest of South America
- 13.5. Asia-Pacific
- 13.5.1. Introduction
- 13.5.2. Key Region-Specific Dynamics
- 13.5.3. Market Size Analysis and Y-o-Y Growth Analysis (%), By Microorganism
- 13.5.4. Market Size Analysis and Y-o-Y Growth Analysis (%), By Type
- 13.5.5. Market Size Analysis and Y-o-Y Growth Analysis (%), By Form
- 13.5.6. Market Size Analysis and Y-o-Y Growth Analysis (%), By Distribution Channel
- 13.5.7. Market Size Analysis and Y-o-Y Growth Analysis (%), By Crop Type
- 13.5.8. Market Size Analysis and Y-o-Y Growth Analysis (%), By Application
- 13.5.9. Market Size Analysis and Y-o-Y Growth Analysis (%), By Country
- 13.5.9.1. China
- 13.5.9.2. India
- 13.5.9.3. Japan
- 13.5.9.4. Australia
- 13.5.9.5. Rest of Asia-Pacific
- 13.6. Middle East and Africa
- 13.6.1. Introduction
- 13.6.2. Key Region-Specific Dynamics
- 13.6.3. Market Size Analysis and Y-o-Y Growth Analysis (%), By Microorganism
- 13.6.4. Market Size Analysis and Y-o-Y Growth Analysis (%), By Type
- 13.6.5. Market Size Analysis and Y-o-Y Growth Analysis (%), By Form
- 13.6.6. Market Size Analysis and Y-o-Y Growth Analysis (%), By Distribution Channel
- 13.6.7. Market Size Analysis and Y-o-Y Growth Analysis (%), By Crop Type
- 13.6.8. Market Size Analysis and Y-o-Y Growth Analysis (%), By Application
14. Competitive Landscape
- 14.1. Competitive Scenario
- 14.2. Market Positioning/Share Analysis
- 14.3. Mergers and Acquisitions Analysis
15. Company Profiles
- 15.1. Katyani Organics*
- 15.1.1. Company Overview
- 15.1.2. Product Portfolio and Description
- 15.1.3. Financial Overview
- 15.1.4. Key Developments
- 15.2. Peptech Biosciences Ltd.
- 15.3. Novozymes
- 15.4. UPL
- 15.5. Chr. Hansen Holding A/S
- 15.6. Lallemand Inc.
- 15.7. IPL Biologicals
- 15.8. Gujarat State Fertilizers & Chemicals Limited
- 15.9. BioWorks, Inc.
- 15.10. T.Stanes and Company Limited
LIST NOT EXHAUSTIVE
16. Appendix
- 16.1. About Us and Services
- 16.2. Contact Us