|
|
市場調査レポート
商品コード
1359954
植物性飼料添加物の世界市場-2023年~2030年Global Phytogenic Feed Additives Market - 2023-2030 |
||||||
|
|
|||||||
カスタマイズ可能
適宜更新あり
|
|||||||


| 植物性飼料添加物の世界市場-2023年~2030年 |
|
出版日: 2023年10月11日
発行: DataM Intelligence
ページ情報: 英文 225 Pages
納期: 即日から翌営業日
|

- 全表示
- 概要
- 目次
概要
世界の植物性飼料添加物市場は、2022年に8億6,920万米ドルに達し、2023年から2030年にかけてCAGR 7.8%で成長し、2030年には15億8,510万米ドルに達すると予測されています。
動物の健康と飼料の品質に関する意識の高まり、飼料用フィトジェニクスのカプセル化などの新技術の出現、より自然な製品に対する消費者の需要、光生成製品に使用される様々なハーブの入手可能性の増加と商品化によるフィトジェニクスの手頃な価格の増加は、予測期間中に植物性飼料添加物の需要を促進すると予想される主な要因の一部です。
動物栄養、特にペットや水生種における植物性飼料添加物の需要の増加は、植物性飼料添加物の機会を生み出しています。例えば、2022年7月、世界の農業大手カーギルは、植物由来の植物性添加物の世界有数のスペシャリストであるデラコンを買収する契約を発表しました。
急速な経済成長と可処分所得の増加により、卵、牛乳、肉などの高品質な酪農・養鶏製品への需要が高まっており、これが植物性飼料添加物の世界市場を牽引する可能性が高いです。OECD/FAO 2021年調査によると、牛肉タンパク質の世界消費量は、主に所得と人口の増加により、基準期間平均の2018~2020年と比較して、2030年までに14%増加する見込みです。
ダイナミクス:
家禽向け抗生物質成長の代替としての植物性飼料添加物の需要増大
植物二次代謝産物、フィトケミカル、プロバイオティクス、またはボタニカルは、ハーブ、スパイス、エッセンシャルオイルなどの幅広い物質を含む植物由来の化合物であり、成長促進や治療特性を有することが判明しています。フィトジェニックを代替品として使用することで、家禽の抗生物質耐性感染の可能性を減らすことができます。
抗生物質耐性に関する懸念から、成長を促進する特性を持つ他の抗生物質の研究が進められています。飼料原料として、この抗生物質は細菌耐性を引き起こすとは予測されておらず、家禽に悪影響を及ぼす可能性もありません。加えて、飼料添加物の使用は、成長および卵生産の効率を高め、病気を予防し、飼料利用率を向上させるためであり、養鶏産業の効率を向上させる手法です。
さらにFAOによれば、食肉需要の高まりにより、世界の鶏肉生産量は1961年から2020年の間に900万トンから1億3,300万トンに増加し、卵生産量は1,500万トンから9,300万トンに増加しました。2020年には、鶏肉は世界の食肉生産量の約40%を占めています。発展途上国では、農村部の家庭の80%近くが家禽を飼育しています。光合成飼料添加物市場の成長は、予測期間中、家禽産業によって牽引される見通しです。
抗生物質飼料添加物に対する厳しい規制
農家や経済全体は、家禽や家畜の生産における抗生物質の使用を有益なものと考えています。しかし、抗生物質耐性を持つ病原性・非病原性生物が環境中に拡散し、食物連鎖を介して人に感染する可能性は、公衆衛生に大きな影響を及ぼす可能性があります。そのような意味で、2022年1月28日、欧州連合(EU)は、養殖動物に抗生物質を定期的に与えることを禁止する新しい法律を発効させます。
さらに米国では、動物の成長を促進するための抗生物質の使用が禁止されています。また、動物飼料、家禽、養殖場での抗生物質コリスチンの使用はインド政府によって禁止されています。例えばインドでは、西ベンガル州漁業局が2022年8月、エビの養殖で日常的に使用されている20種類の抗生物質やその他の活性化合物の使用を禁止しました。こうした禁止措置の結果、抗生物質に代わる新たな創造的な植物性飼料添加物が必要となります。
高価な原料別価格
植物性飼料添加物の生産に利用される主な原材料は、ハーブやスパイスなどの各種香辛料や精油からの抽出物であり、これらはすべてフェノールやフラボノイドなどの生理活性物質の供給源となります。しかし、エッセンシャルオイルのコストが高いため、植物性飼料添加物市場の拡大には限界があります。例えばAromaaz Internationalは、アニスのスパイスオイルを100mL当たり8.50ドルで販売しています。
さらに、植物性飼料添加物製品のプロセスは、それらの様々な添加物を組み合わせて製品にブレンドすることに参加するため高価であり、最終製品の価値を高めています。
目次
第1章 調査手法と調査範囲
第2章 定義と概要
第3章 エグゼクティブサマリー
第4章 市場力学
- 影響要因
- 促進要因
- 家禽向け抗生物質成長の代替としての植物性飼料添加物の需要増大
- 抗生物質飼料添加物に対する厳しい規制
- 抑制要因
- 高価な原材料価格
- 機会
- 影響分析
- 促進要因
第5章 産業分析
- ポーターのファイブフォース分析
- サプライチェーン分析
- 価格分析
- 規制分析
- ロシア・ウクライナ戦争の影響分析
- DMIの見解
第6章 COVID-19分析
第7章 タイプ別
- エッセンシャルオイル
- フラボノイド
- サポニン
- オレオレジン
- タンニン
- その他
第8章 家畜別
- 家禽
- 豚
- 反芻動物
- 水生動物
- その他
第9章 原料別
- ハーブ・スパイス
- 果物・野菜
- 花卉
第10章 形態別
- 乾燥
- 液体
第11章 流通チャネル別
- eコマース
- 液体
- 専門店
- ハイパーマーケット・スーパーマーケット
- その他
第12章 包装別
- 軟質
- 硬質
- その他
第13章 機能別
- 能力向上剤
- 抗菌性
- 嗜好性向上剤
- 消化促進剤
- その他
第14章 地域別
- 北米
- 米国
- カナダ
- メキシコ
- 欧州
- ドイツ
- 英国
- フランス
- イタリア
- ロシア
- その他欧州
- 南米
- ブラジル
- アルゼンチン
- その他南米
- アジア太平洋
- 中国
- インド
- 日本
- オーストラリア
- その他アジア太平洋
- 中東・アフリカ
第15章 競合情勢
- 競合シナリオ
- 市況/シェア分析
- M&A分析
第16章 企業プロファイル
- Cargill, Incorporated
- 企業概要
- 製品ポートフォリオと説明
- 財務概要
- 最近の動向
- ADM
- Koninklijke DSM N.V.
- Delacon Biotech Nik Ges.m.b.H
- Adisseo
- Trouw Nutrition
- Kemin Industries, Inc.
- Natural Remedies
- Orffa International Holding B.V.
- Danisco Animal Nutrition & Health(IFF)LIST NOT EXHAUSTIVE
第17章 付録
Overview:
Global Phytogenic Feed Additives Market reached US$ 869.2 million in 2022 and is expected to reach US$ 1585.1 million by 2030, growing with a CAGR of 7.8% during the forecast period 2023-2030.
Rising awareness about animal health and feed quality, the emergence of new technologies such as feed phytogenics encapsulation, consumer demand for more natural products, and increased affordability of phytogenics due to increased availability and commoditization of various herbs used in photogenic products are some of the key factors expected to drive demand for phytogenics feed additives during the forecast period.
Increasing demand for phytogenic feed additives for animal nutrition, particularly in pets and aquatic species, is creating opportunities for phytogenic feed additives. For instance, in July 2022, global agricultural major Cargill announced a contractual deal to buy Delacon, the world's foremost specialist in plant-based phytogenic additives.
Rapid economic growth and rising disposable income have raised a demand for high-quality dairy and poultry products such as eggs, milk, meat, and more, which is likely to drive the global market for phytogenic feed additives. According to the OECD/FAO 2021 study, worldwide consumption of beef proteins is expected to increase by 14% by 2030 compared to the base period average of 2018-2020, owing mostly to income and population growth.
Dynamics:
Rising Demand for Phytogenic Feed Additives as Alternatives to Antibiotic Growth in Poultry
Plant secondary metabolites, phytochemicals, probiotics, or botanicals are plant-derived compounds that contain a wide range of substances such as herbs, spices, and essential oils that have been found to have growth-promoting and therapeutic characteristics. The use of phytogenics as an alternative reduces the likelihood of antibiotic-resistant infections in poultry.
Concerns about antibiotic resistance prompt it to investigate other antibiotics with growth-promoting properties. As a feed ingredient, this antibiotic is not predicted to cause bacterial resistance and has no possible negative effects on poultry. In addition, the use of feed additives to increase the efficiency of growth and egg production, prevent illness, and improve feed utilization is a technique to improve the poultry industry's efficiency.
Furthermore, due to rising meat demand, global poultry meat production increased from 9 to 133 million tonnes between 1961 and 2020, while egg production increased from 15 to 93 million tonnes, according to FAO. In 2020, poultry meat accounted for about 40% of world meat output. In developing countries, nearly 80% of rural families keep poultry. Photogenic feed additives market growth would be driven by the poultry industry during the projected period.
Stringent Regulations on Antibiotic Feed Additives
Farmers and the economy as a whole view the use of antibiotics in poultry and animal production as beneficial since it has typically increased poultry performance economically and efficiently. However, the potential spread of antibiotic-resistant strains of pathogenic and non-pathogenic organisms into the environment, followed by transmission to people via the food chain, might have major consequences for public health. In such a way that, on January 28, 2022, the European Union's new legislation prohibiting the routine feeding of antibiotics to farmed animals goes into effect.
Furthermore, the use of antibiotics to increase animal growth is prohibited in the United States. Also, the use of the antibiotic Colistin in animal feed, poultry, and aqua farms is prohibited by the Indian government. In India, for instance, the West Bengal Fisheries Department banned 20 antibiotics and other active compounds routinely used in shrimp aquaculture in August 2022. As a result of these prohibitions, new creative phytogenic feed additives will be required as an alternative to antibiotics.
Expensive Price of Raw Materials
The key raw materials utilized in the production of phytogenic feed additives are extracts from various spices and essential oils such as herbs and spices, which all serve as sources of bioactive substances like phenols and flavonoids. However, the high cost of essential oil limits the expansion of the phytogenic feed additives market. Aromaaz International, for instance, sells aniseed spice oil for $8.50 per 100 mL.
Furthermore, the process of phytogenic feed additive products is expensive owing to the participation of blending those various additives into combination products, which increases the value of the final products.
Segment Analysis:
The global phytogenic feed additives market is segmented based on type, livestock, source, form, distribution channel, packaging, function and region.
Herbs & Spices Demand in Phytogenic Feed Additives Market
The herbs and spices category accounts for a significant share of the globally phytogenic feed additives market. Herbs and spices are used to make essential oils. Herbs and spices have lately garnered a lot of attention in feed manufacturing due to their medicinal effects, culinary appeal, and the limitation on particular antibiotics as growth promoters. They are also becoming increasingly important since long-term ingestion does not harm animals. Herbs and spices assist animals in maintaining a healthy digestive tract when utilized as phytogenic feed additives in animal nutrition.
Furthermore, research and development activities for the spare derive the best performance of herbal poultry nutrition from a wide range of herbs and spices like thyme, oregano, black cumin, coriander, garlic, ginger, and black cumin. As a consequence, employing these spices and herbs will result in a new novel option for phytogenic feed additives.
Geographical Penetration:
Increasing Demand For Natural and Organic Products in Europe
Europe has the fastest-growing market for photogenic feed additives. The region's market is expanding due to a variety of causes, including an increase in demand for natural and organic products. Organic food and farming have grown year after year in the EU over the previous three decades and continue to do so. The organic market in the EU is quite dynamic, with growth rates varied by country. Policies can have a favorable influence on both production and consumption growth.
Further, The total area of organic farms in the EU increased to 14.9 million hectares by 2020. According to IFOAM Organics Europe, the number of organic farmers in the EU rose by 1.6% year on year to 349,499 in 2019. According to FAO, the European market for organic food products will grow by 12% by 2021, reaching US$ 58.6 billion.
Germany has the largest share of the European photogenic market due to the large number of companies operating in the country. Furthermore, the EU prohibits the routine use of antibiotics in farm animals; as a result, phytogenic feed additives will fuel market growth throughout the projection period.
Competitive Landscape
The major global players include: Cargill, Incorporated., ADM, Koninklijke DSM N.V., Delacon Biotech Nik Ges.m.b.H., Adisseo, Trouw Nutrition, Kemin Industries, Inc., Natural Remedies, Orffa International Holding B.V. and Danisco Animal Nutrition & Health (IFF)
COVID-19 Impact Analysis:
The supply chain of animal feed additive raw materials has been harmed as a result of animal movement limitations caused by pandemic-caused lockdowns. Regular production processes, supply, and consumption patterns were drastically disturbed.
On the other hand, the post-pandemic market will see a surge in organic product demand. The innovative nature of organic food and farming, expanding regulatory backing, and European residents' increasing desire for high-quality, sustainable food production all played a part in 2020 and 2021. This is reflected in the rising per capita consumption of organic goods, which now stands at 102 EUR on average.
According to the Organic Trade Association, the COVID-19 pandemic has continued to be a significant driver of organic sales, notably in the United States and the European Union. France and Germany are the two largest organic marketplaces in Europe, accounting for 60% of the European market. Organic food sales in Europe grew by 4 billion in 2021, reaching $58.5 billion.
Russia-Ukraine War Impact Analysis
The ongoing conflict can create economic instability in the region. Uncertainty and disruptions in trade and commerce can impact consumer confidence and purchasing power. As a result, individuals may prioritize essential needs over non-essential purchases like phytogenic feed additives products, leading to a potential decline in demand.
Furthermore, Russian phytogenic feed additive (PFA) development has been stalled for several decades since the dissolution of the Soviet Union; however, due to rising antibiotic resistance, the country is now prioritizing phytogenic research and investment; however, the conflict war creates a delay in the production of phytogenic feed additive in Russia.
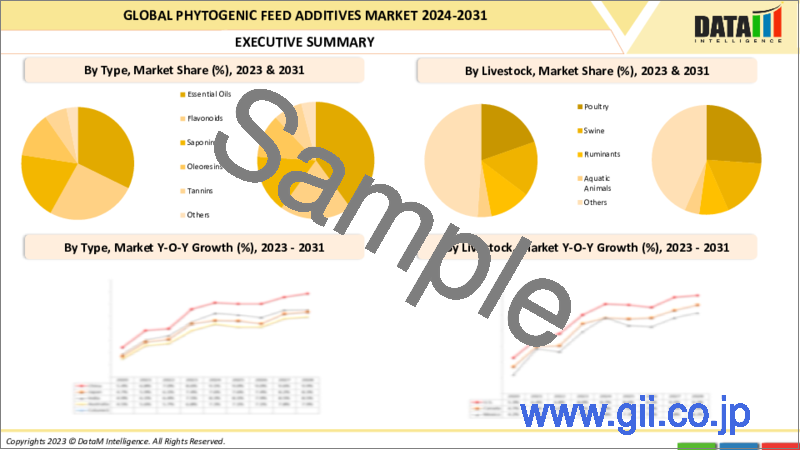
By Type
- Essential Oils
- Flavonoids
- Saponins
- Oleoresins
- Tannins
- Others
By Livestock
- Poultry
- Swine
- Ruminants
- Aquatic Animals
- Others
By Source
- Herbs & Spices
- Fruits & Vegetables
- Flowers
By Form
- Dry
- Liquid
By Distribution Channel
- E-Commerce
- Specialty Stores
- Hypermarket/Supermarket
- Others
By Packaging
- Flexible
- Rigid
- Other
By Function
- Performance Enhancers
- Antimicrobial Properties
- Palatability Enhancers
- Digestion Enhancers
- Others
By Region
- North America
- U.S.
- Canada
- Mexico
- Europe
- Germany
- UK
- France
- Italy
- Russia
- Rest of Europe
- South America
- Brazil
- Argentina
- Rest of South America
- Asia-Pacific
- China
- India
- Japan
- Australia
- Rest of Asia-Pacific
- Middle East and Africa
Key Developments
- On June 23, 2022, Cargill signed a binding agreement to acquire Delacon, a globally leading expert in plant-based phytogenic additives. The acquisition combines Cargill's global network and deep expertise in animal nutrition technologies with Delacon's pioneering knowledge and market experience in phytogenic feed additives.
- On January 17, 2020, Kemin Industries a global ingredient manufacturer launched VANNIX C4, a novel phytogenic feed additive that joins the comprehensive lineup of poultry gut health solutions from Kemin Animal Nutrition and Health North America.
- On November 1, 2022, RAVIOZA BIOTECH launched PHYTOGOLD, a next-generation Phytogenic, and FORTIBAC in Indian Market.
Why Purchase the Report?
- To visualize the global phytogenic feed additives market segmentation based on type, livestock, source, form, distribution channel, packaging, function and region, as well as understand key commercial assets and players.
- Identify commercial opportunities by analyzing trends and co-development.
- Excel data sheet with numerous data points of phytogenic feed additives market-level with all segments.
- PDF report consists of a comprehensive analysis after exhaustive qualitative interviews and an in-depth study.
- Product mapping available as Excel consisting of key products of all the major players.
The global phytogenic feed additives market report would provide approximately 93 tables, 104 figures and 225 Pages.
Target Audience 2023
- Manufacturers/ Buyers
- Industry Investors/Investment Bankers
- Research Professionals
- Emerging Companies
Table of Contents
1. Methodology and Scope
- 1.1. Research Methodology
- 1.2. Research Objective and Scope of the Report
2. Definition and Overview
3. Executive Summary
- 3.1. Snippet by Type
- 3.2. Snippet by Livestock
- 3.3. Snippet by Source
- 3.4. Snippet by Form
- 3.5. Snippet by Distribution Channel
- 3.6. Snippet by Packaging
- 3.7. Snippet by Function
- 3.8. Snippet by Region
4. Dynamics
- 4.1. Impacting Factors
- 4.1.1. Drivers
- 4.1.1.1. Rising Demand for Phytogenic Feed Additives as Alternatives to Antibiotic Growth in Poultry
- 4.1.1.2. Stringent Regulations on Antibiotic Feed Additives
- 4.1.2. Restraints
- 4.1.2.1. Expensive Price of Raw Materials
- 4.1.3. Opportunity
- 4.1.4. Impact Analysis
- 4.1.1. Drivers
5. Industry Analysis
- 5.1. Porter's Five Force Analysis
- 5.2. Supply Chain Analysis
- 5.3. Pricing Analysis
- 5.4. Regulatory Analysis
- 5.5. Russia-Ukraine War Impact Analysis
- 5.6. DMI Opinion
6. COVID-19 Analysis
- 6.1. Analysis of COVID-19
- 6.1.1. Scenario Before COVID
- 6.1.2. Scenario During COVID
- 6.1.3. Scenario Post COVID
- 6.2. Pricing Dynamics Amid COVID-19
- 6.3. Demand-Supply Spectrum
- 6.4. Government Initiatives Related to the Market During Pandemic
- 6.5. Manufacturers Strategic Initiatives
- 6.6. Conclusion
7. By Type
- 7.1. Introduction
- 7.1.1. Market Size Analysis and Y-o-Y Growth Analysis (%), By Type
- 7.1.2. Market Attractiveness Index, By Type
- 7.2. Essential Oils*
- 7.2.1. Introduction
- 7.2.2. Market Size Analysis and Y-o-Y Growth Analysis (%)
- 7.3. Flavonoids
- 7.4. Saponins
- 7.5. Oleoresins
- 7.6. Tannins
- 7.7. Others
8. By Livestock
- 8.1. Introduction
- 8.1.1. Market Size Analysis and Y-o-Y Growth Analysis (%), By Livestock
- 8.1.2. Market Attractiveness Index, By Livestock
- 8.2. Poultry*
- 8.2.1. Introduction
- 8.2.2. Market Size Analysis and Y-o-Y Growth Analysis (%)
- 8.3. Swine
- 8.4. Ruminants
- 8.5. Aquatic Animals
- 8.6. Others
9. By Source
- 9.1. Introduction
- 9.1.1. Market Size Analysis and Y-o-Y Growth Analysis (%), By Source
- 9.1.2. Market Attractiveness Index, By Source
- 9.2. Herbs & Spices*
- 9.2.1. Introduction
- 9.2.2. Market Size Analysis and Y-o-Y Growth Analysis (%)
- 9.3. Fruits & Vegetables
- 9.4. Flowers
10. By Form
- 10.1. Introduction
- 10.1.1. Market Size Analysis and Y-o-Y Growth Analysis (%), By Form
- 10.1.2. Market Attractiveness Index, By Form
- 10.2. Dry*
- 10.2.1. Introduction
- 10.2.2. Market Size Analysis and Y-o-Y Growth Analysis (%)
- 10.3. Liquid
11. By Distribution Channel
- 11.1. Introduction
- 11.1.1. Market Size Analysis and Y-o-Y Growth Analysis (%), By Distribution Channel
- 11.1.2. Market Attractiveness Index, By Distribution Channel
- 11.2. E-Commerce*
- 11.2.1. Introduction
- 11.2.2. Market Size Analysis and Y-o-Y Growth Analysis (%)
- 11.3. Liquid
- 11.4. Specialty Stores
- 11.5. Hypermarket/Supermarket
- 11.6. Others
12. By Packaging
- 12.1. Introduction
- 12.1.1. Market Size Analysis and Y-o-Y Growth Analysis (%), By Packaging
- 12.1.2. Market Attractiveness Index, By Packaging
- 12.2. Flexible*
- 12.2.1. Introduction
- 12.2.2. Market Size Analysis and Y-o-Y Growth Analysis (%)
- 12.3. Rigid
- 12.4. Others
13. By Function
- 13.1. Introduction
- 13.1.1. Market Size Analysis and Y-o-Y Growth Analysis (%), By Function
- 13.1.2. Market Attractiveness Index, By Function
- 13.2. Performance Enhancers*
- 13.2.1. Introduction
- 13.2.2. Market Size Analysis and Y-o-Y Growth Analysis (%)
- 13.3. Antimicrobial Properties
- 13.4. Palatability Enhancers
- 13.5. Digestion Enhancers
- 13.6. Others
14. By Region
- 14.1. Introduction
- 14.1.1. Market Size Analysis and Y-o-Y Growth Analysis (%), By Region
- 14.1.2. Market Attractiveness Index, By Region
- 14.2. North America
- 14.2.1. Introduction
- 14.2.2. Key Region-Specific Dynamics
- 14.2.3. Market Size Analysis and Y-o-Y Growth Analysis (%), By Type
- 14.2.4. Market Size Analysis and Y-o-Y Growth Analysis (%), By Livestock
- 14.2.5. Market Size Analysis and Y-o-Y Growth Analysis (%), By Source
- 14.2.6. Market Size Analysis and Y-o-Y Growth Analysis (%), By Form
- 14.2.7. Market Size Analysis and Y-o-Y Growth Analysis (%), By Distribution Channel
- 14.2.8. Market Size Analysis and Y-o-Y Growth Analysis (%), By Packaging
- 14.2.9. Market Size Analysis and Y-o-Y Growth Analysis (%), By Function
- 14.2.10. Market Size Analysis and Y-o-Y Growth Analysis (%), By Country
- 14.2.10.1. U.S.
- 14.2.10.2. Canada
- 14.2.10.3. Mexico
- 14.3. Europe
- 14.3.1. Introduction
- 14.3.2. Key Region-Specific Dynamics
- 14.3.3. Market Size Analysis and Y-o-Y Growth Analysis (%), By Type
- 14.3.4. Market Size Analysis and Y-o-Y Growth Analysis (%), By Livestock
- 14.3.5. Market Size Analysis and Y-o-Y Growth Analysis (%), By Source
- 14.3.6. Market Size Analysis and Y-o-Y Growth Analysis (%), By Form
- 14.3.7. Market Size Analysis and Y-o-Y Growth Analysis (%), By Distribution Channel
- 14.3.8. Market Size Analysis and Y-o-Y Growth Analysis (%), By Packaging
- 14.3.9. Market Size Analysis and Y-o-Y Growth Analysis (%), By Function
- 14.3.10. Market Size Analysis and Y-o-Y Growth Analysis (%), By Country
- 14.3.10.1. Germany
- 14.3.10.2. UK
- 14.3.10.3. France
- 14.3.10.4. Italy
- 14.3.10.5. Russia
- 14.3.10.6. Rest of Europe
- 14.4. South America
- 14.4.1. Introduction
- 14.4.2. Key Region-Specific Dynamics
- 14.4.3. Market Size Analysis and Y-o-Y Growth Analysis (%), By Type
- 14.4.4. Market Size Analysis and Y-o-Y Growth Analysis (%), By Livestock
- 14.4.5. Market Size Analysis and Y-o-Y Growth Analysis (%), By Source
- 14.4.6. Market Size Analysis and Y-o-Y Growth Analysis (%), By Form
- 14.4.7. Market Size Analysis and Y-o-Y Growth Analysis (%), By Distribution Channel
- 14.4.8. Market Size Analysis and Y-o-Y Growth Analysis (%), By Packaging
- 14.4.9. Market Size Analysis and Y-o-Y Growth Analysis (%), By Function
- 14.4.10. Market Size Analysis and Y-o-Y Growth Analysis (%), By Country
- 14.4.10.1. Brazil
- 14.4.10.2. Argentina
- 14.4.10.3. Rest of South America
- 14.5. Asia-Pacific
- 14.5.1. Introduction
- 14.5.2. Key Region-Specific Dynamics
- 14.5.3. Market Size Analysis and Y-o-Y Growth Analysis (%), By Type
- 14.5.4. Market Size Analysis and Y-o-Y Growth Analysis (%), By Livestock
- 14.5.5. Market Size Analysis and Y-o-Y Growth Analysis (%), By Source
- 14.5.6. Market Size Analysis and Y-o-Y Growth Analysis (%), By Form
- 14.5.7. Market Size Analysis and Y-o-Y Growth Analysis (%), By Distribution Channel
- 14.5.8. Market Size Analysis and Y-o-Y Growth Analysis (%), By Packaging
- 14.5.9. Market Size Analysis and Y-o-Y Growth Analysis (%), By Function
- 14.5.10. Market Size Analysis and Y-o-Y Growth Analysis (%), By Country
- 14.5.10.1. China
- 14.5.10.2. India
- 14.5.10.3. Japan
- 14.5.10.4. Australia
- 14.5.10.5. Rest of Asia-Pacific
- 14.6. Middle East and Africa
- 14.6.1. Introduction
- 14.6.2. Key Region-Specific Dynamics
- 14.6.3. Market Size Analysis and Y-o-Y Growth Analysis (%), By Type
- 14.6.4. Market Size Analysis and Y-o-Y Growth Analysis (%), By Livestock
- 14.6.5. Market Size Analysis and Y-o-Y Growth Analysis (%), By Source
- 14.6.6. Market Size Analysis and Y-o-Y Growth Analysis (%), By Form
- 14.6.7. Market Size Analysis and Y-o-Y Growth Analysis (%), By Distribution Channel
- 14.6.8. Market Size Analysis and Y-o-Y Growth Analysis (%), By Packaging
- 14.6.9. Market Size Analysis and Y-o-Y Growth Analysis (%), By Function
15. Competitive Landscape
- 15.1. Competitive Scenario
- 15.2. Market Positioning/Share Analysis
- 15.3. Mergers and Acquisitions Analysis
16. Company Profiles
- 16.1. Cargill, Incorporated*
- 16.1.1. Company Overview
- 16.1.2. Product Portfolio and Description
- 16.1.3. Financial Overview
- 16.1.4. Recent Developments
- 16.2. ADM
- 16.3. Koninklijke DSM N.V.
- 16.4. Delacon Biotech Nik Ges.m.b.H
- 16.5. Adisseo
- 16.6. Trouw Nutrition
- 16.7. Kemin Industries, Inc.
- 16.8. Natural Remedies
- 16.9. Orffa International Holding B.V.
- 16.10. Danisco Animal Nutrition & Health (IFF) LIST NOT EXHAUSTIVE
17. Appendix
- 17.1. About Us and Services
- 17.2. Contact Us