|
|
市場調査レポート
商品コード
1336741
再生可能エネルギー駆動式海水淡水化システムの世界市場-2023-2030年Global Renewable Energy Powered Water Desalination Systems Market - 2023-2030 |
||||||
|
|
|||||||
カスタマイズ可能
適宜更新あり
|
|||||||


| 再生可能エネルギー駆動式海水淡水化システムの世界市場-2023-2030年 |
|
出版日: 2023年08月22日
発行: DataM Intelligence
ページ情報: 英文 202 Pages
納期: 即日から翌営業日
|

- 全表示
- 概要
- 目次
市場概要
再生可能エネルギー駆動式海水淡水化システムの世界市場は、2022年に23億米ドルに達し、2023-2030年の予測期間中にCAGR 9.9%で成長し、2030年には49億米ドルに達すると予測されています。
再生可能エネルギーを動力源とする海水淡水化システム市場は、システム容量、地域、エンドユーザー、技術タイプによって複数のサブマーケットに分けられます。逆浸透(RO)、多段フラッシュ(MSF)、多重効用蒸留(MED)、電気透析(ED)などが、これらのシステムで採用されている主な技術です。
持続可能な技術と再生可能エネルギーの推進は、欧州諸国が主導してきました。欧州連合(EU)は、再生可能エネルギーに関する高い目標を設定し、政策支援や財政的インセンティブを通じて、再生可能エネルギーを動力源とする海水淡水化システムの利用を推進してきました。
例えば、EUのHorizon 2020プログラムは、海水淡水化および再生可能エネルギー関連の研究・技術革新イニシアチブを数多く支援しています。そのため、欧州は世界シェアの1/3近くを占めています。
市場力学
太陽光発電式海水淡水化システムの普及加速化が、世界成長の原動力となる
太陽光発電式の海水淡水化システムの使用は、豊富な太陽資源を持つ地域が自前の再生可能エネルギーを海水淡水化に利用できるようにすることで、化石燃料や系統電力のような外部エネルギー源への依存を減らします。海水淡水化プロジェクトは、エネルギーに依存しないため、遠隔地や非電化地域でも耐久性が高く、長持ちします。
例えば、オーストラリアのポートオーガスタでは、市民に信頼できる飲料水を供給するため、太陽光発電による海水淡水化プラントを実用化しています。この取り組みでは、海水淡水化プラントの電力源として太陽エネルギーを利用することで、輸入水や従来のエネルギー源への依存を減らしています。
技術進歩と環境の持続可能性
再生可能エネルギーを動力源とする海水淡水化システムの利用は、クリーンなエネルギー源と持続可能な実践を目指す世界の動向に促されてきました。世界中の政府や組織では、環境の持続可能性が最優先されており、海水淡水化に再生可能エネルギー技術を使用することが奨励されています。
例えば、アラブ首長国連邦のマスダール・ソーラー海水淡水化プラントでは、海水を淡水化するために逆浸透膜技術と太陽光発電パネルを組み合わせています。このプラントは、太陽エネルギーを利用することで、二酸化炭素排出量を削減し、乾燥地帯の水供給の保全に役立っています。
高い初期資本コスト
再生可能エネルギーを利用した海水淡水化プロジェクトは、多額の初期資本支出を必要とするため、従来の海水淡水化技術や他の水供給方法と比べ、財政的に導入が難しい可能性があります。投資家やプロジェクト開発者が、投資回収期間が長引いたり、投資収益が不確実な事業への投資に消極的なため、市場発展が遅れる可能性があります。
COVID-19影響分析
パンデミックによる国際移動制限やロックダウンによりサプライチェーンが寸断され、再生可能エネルギー源を動力源とする海水淡水化システムに必要な部品や機器の供給に影響が出ました。サプライチェーンの中断は、プロジェクト実施の遅延とコスト上昇を引き起こすと見られます。社会的隔離政策、渡航制限、労働力の制約の結果、プロジェクトのスケジュールは延期されました。再生可能エネルギーを燃料とする海水淡水化プロジェクトは、現場での作業や協力が効果的でないため、進行や完了が困難になっています。
目次
第1章 調査手法と調査範囲
第2章 定義と概要
第3章 エグゼクティブサマリー
第4章 市場力学
- 影響要因
- 促進要因
- 太陽光発電式海水淡水化システムの導入加速が世界成長の原動力
- 技術の進歩と環境の持続可能性
- 抑制要因
- 初期資本コストの高さ
- 機会
- 影響分析
- 促進要因
第5章 産業分析
- ポーターのファイブフォース分析
- サプライチェーン分析
- 価格分析
- 規制分析
第6章 COVID-19分析
第7章 技術タイプ別
- 逆浸透(RO)システム
- 工業用水淡水化
- 多重効用蒸留(MED)システム
- 遠隔地/非電化コミュニティ
- その他
第8章 用途別
- 市水淡水化
- 産業部門(石油・ガス、発電、製造など)
- 農業
- 住宅分野
- 災害救援
- その他
第9章 エンドユーザー別
- 政府・自治体
- 産業部門(石油・ガス、発電、製造業など)
- 農業部門
- 住宅部門
- 軍事・防衛
- その他
第10章 地域別
- 北米
- 米国
- カナダ
- メキシコ
- 欧州
- ドイツ
- 英国
- フランス
- イタリア
- ロシア
- その他欧州
- 南米
- ブラジル
- アルゼンチン
- その他南米
- アジア太平洋
- 中国
- インド
- 日本
- オーストラリア
- その他アジア太平洋
- 中東・アフリカ
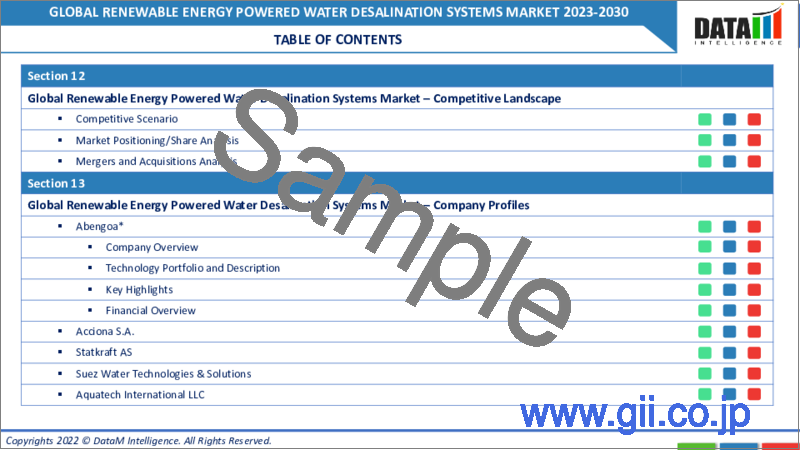
第11章 競合情勢
- 競合シナリオ
- 市況/シェア分析
- M&A分析
第12章 企業プロファイル
- Abengoa Water
- 会社概要
- 製品ポートフォリオと説明
- 財務概要
- 最近の動向
- Acciona S.A.
- Doosan Heavy Industries & Construction Co., Ltd.
- Suez Water Technologies & Solutions
- Aquatech International LLC
- Hyflux Ltd.
- Veolia Water Technologies
- General Electric Company
- Fisia Italimpianti S.p.A.
- Xylem Inc.
第13章 付録
Market Overview
Global renewable energy powered water desalination systems market reached US$ 2.3 billion in 2022 and is expected to reach US$ 4.9 bllion by 2030, growing with a CAGR of 9.9% during the forecast period 2023-2030.
The market for water desalination systems powered by renewable energy is divided into submarkets depending on system capacity, geography, end-user and technology type. Reverse osmosis (RO), multi-stage flash (MSF), multi-effect distillation (MED), electrodialysis (ED) and other techniques are the main technologies employed in these systems.
The promotion of sustainable technology and renewable energy has been led by European nations. The European Union (EU) has established lofty goals for renewable energy and has been promoting the use of desalination systems powered by renewable energy through policy support and financial incentives.
For instance, the EU's Horizon 2020 programme supported a number of desalination and renewable energy-related research and innovation initiatives. Therefore, Europe accounts for nearly 1/3rd of the global share.
Market Dynamics
Accelerating Adoption of Solar-Powered Desalination Systems Fuels Global Growth
The use of solar-powered desalination devices reduces reliance on outside energy sources like fossil fuels or grid electricity by enabling areas with plentiful solar resources to use their own renewable energy for the desalination of water. Desalination projects are more durable and long-lasting in distant or off-grid areas thanks to their energy independence, which encourages their adoption.
For instance, to give its citizens a dependable source of drinking water, the Australian town of Port Augusta is putting into practice a solar-powered desalination plant. The initiative lessens dependency on imported water and conventional energy sources by harnessing solar energy to power the desalination plant.
Technological Advancements and Environmental Sustainability
The use of desalination systems powered by renewable energy has been prompted by the global trend towards clean energy sources and sustainable practises. Environmental sustainability is given top priority by governments and organisations around the world and the use of renewable energy technology for water desalination is encouraged.
For instance, In order to desalinate seawater, the Masdar Solar Desalination Plant in the United Arab Emirates combines reverse osmosis technology with photovoltaic solar panels. The plant reduces carbon emissions and aids in the preservation of water supplies in arid areas by utilizing solar energy.
High Initial Capital Costs
Financially, renewable energy-powered desalination projects may be more difficult to implement than traditional desalination techniques or other water supply alternatives because of the large initial capital expenditures. Market expansion may be slowed by investors' and project developers' reluctance to invest in ventures with protracted payback times or uncertain returns on investment.
COVID-19 Impact Analysis
The pandemic's global limitations and lockdowns caused supply chains to break down, which affected the supply of parts and equipment required for desalination systems powered by renewable energy sources. Supply chain interruptions have been seen to cause project implementation delays and cost increases. Project schedules have been pushed back as a result of social segregation policies, travel restrictions and workforce constraints. Desalination projects fueled by renewable energy have had difficulties getting underway and completed due to ineffective on-site work and collaboration.
Segment Analysis
The global renewable energy powered water desalination systems market is segmented based on technology type, application, end-user and region.
Continuous Technological Advancements Drives the Global Segmental Growth
To enhance the functionality and energy efficiency of RO systems, manufacturers continually spend in R&D. The use of improved membranes with better salt rejection rates and reduced energy requirements has recently been developed, which lowers operational costs and boosts system reliability. Therefore, reverse osmosis systems technology type segment is expected to grow at a highest CAGR during the forecasted period.
Geographical Analysis
Harnessing Solar Power to Tackle Wastewater Challenges in the U.S. Oil and Gas Industry
The North American market for renewable energy-powered desalination systems in the oil and gas industry is experiencing significant growth, driven by the harnessing of solar power to tackle wastewater challenges. In U.S., Several hundred billion gallons of wastewater are created each year as a result of oil and gas extraction. Solar-powered desalination systems can help clean this water, making it suitable for a variety of domestic and industrial uses. Therefore, U.S. is contributing more than 3/4th of the regional shares during the forecasted period.
Competitive Landscape
The major global players include: Abengoa Water, Acciona S.A., Doosan Heavy Industries & Construction Co., Ltd., Suez Water Technologies & Solutions, Aquatech International LLC, Hyflux Ltd., Veolia Water Technologies, General Electric Company, Fisia Italimpianti S.p.A. and Xylem Inc.
Why Purchase the Report?
- To visualize the global renewable energy powered water desalination systems market segmentation based on technology type, application, end-user and region, as well as understand key commercial assets and players.
- Identify commercial opportunities by analyzing trends and co-development.
- Excel data sheet with numerous data points of renewable energy powered water desalination systems market-level with all segments.
- PDF report consists of a comprehensive analysis after exhaustive qualitative interviews and an in-depth study.
- Product mapping available as Excel consisting of key products of all the major players.
The global renewable energy powered water desalination systems market report would provide approximately 61 tables, 64 figures and 202 Pages.
Target Audience 2023
- Manufacturers/ Buyers
- Industry Investors/Investment Bankers
- Research Professionals
- Emerging Companies
Table of Contents
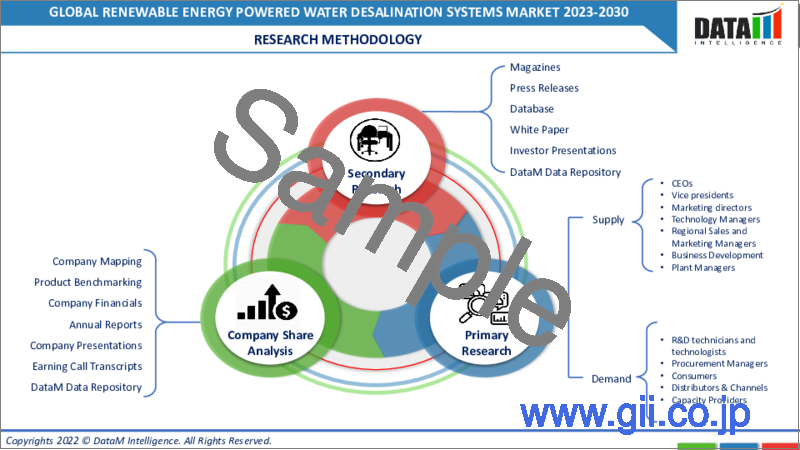
1. Methodology and Scope
- 1.1. Research Methodology
- 1.2. Research Objective and Scope of the Report
2. Definition and Overview
3. Executive Summary
- 3.1. Snippet by Technology Type
- 3.2. Snippet by Application
- 3.3. Snippet by End-User
- 3.4. Snippet by Region
4. Dynamics
- 4.1. Impacting Factors
- 4.1.1. Drivers
- 4.1.1.1. Accelerating Adoption of Solar-Powered Desalination Systems Fuels Global Growth
- 4.1.1.2. Technological Advancements and Environmental Sustainability
- 4.1.2. Restraints
- 4.1.2.1. High Initial Capital Costs
- 4.1.3. Opportunity
- 4.1.4. Impact Analysis
- 4.1.1. Drivers
5. Industry Analysis
- 5.1. Porter's Five Force Analysis
- 5.2. Supply Chain Analysis
- 5.3. Pricing Analysis
- 5.4. Regulatory Analysis
6. COVID-19 Analysis
- 6.1. Analysis of COVID-19
- 6.1.1. Scenario Before COVID
- 6.1.2. Scenario During COVID
- 6.1.3. Scenario Post COVID
- 6.2. Pricing Dynamics Amid COVID-19
- 6.3. Demand-Supply Spectrum
- 6.4. Government Initiatives Related to the Market During Pandemic
- 6.5. Manufacturers Strategic Initiatives
- 6.6. Conclusion
7. By Technology Type
- 7.1. Introduction
- 7.1.1. Market Size Analysis and Y-o-Y Growth Analysis (%), By Technology Type
- 7.1.2. Market Attractiveness Index, By Technology Type
- 7.2. Reverse Osmosis (RO) Systems*
- 7.2.1. Introduction
- 7.2.2. Market Size Analysis and Y-o-Y Growth Analysis (%)
- 7.3. Industrial Water Desalination
- 7.4. Multi-Effect Distillation (MED) Systems
- 7.5. Remote/Off-grid Communities
- 7.6. Others
8. By Application
- 8.1. Introduction
- 8.1.1. Market Size Analysis and Y-o-Y Growth Analysis (%), By Application
- 8.1.2. Market Attractiveness Index, By Application
- 8.2. Municipal Water Desalination*
- 8.2.1. Introduction
- 8.2.2. Market Size Analysis and Y-o-Y Growth Analysis (%)
- 8.3. Industrial Sector (Oil and Gas, Power Generation, Manufacturing, etc.)
- 8.4. Agriculture/Farming
- 8.5. Residential Sector
- 8.6. Disaster Relief
- 8.7. Others
9. By End-User
- 9.1. Introduction
- 9.1.1. Market Size Analysis and Y-o-Y Growth Analysis (%), By End-User
- 9.1.2. Market Attractiveness Index, By End-User
- 9.2. Government and Municipalities*
- 9.2.1. Introduction
- 9.2.2. Market Size Analysis and Y-o-Y Growth Analysis (%)
- 9.3. Industrial Sector (Oil and Gas, Power Generation, Manufacturing, etc.)
- 9.4. Agriculture and Farming Sector
- 9.5. Residential Sector
- 9.6. Military and Defense
- 9.7. Others
10. By Region
- 10.1. Introduction
- 10.1.1. Market Size Analysis and Y-o-Y Growth Analysis (%), By Region
- 10.1.2. Market Attractiveness Index, By Region
- 10.2. North America
- 10.2.1. Introduction
- 10.2.2. Key Region-Specific Dynamics
- 10.2.3. Market Size Analysis and Y-o-Y Growth Analysis (%), By Technology Type
- 10.2.4. Market Size Analysis and Y-o-Y Growth Analysis (%), By Application
- 10.2.5. Market Size Analysis and Y-o-Y Growth Analysis (%), By End-User
- 10.2.6. Market Size Analysis and Y-o-Y Growth Analysis (%), By Country
- 10.2.6.1. U.S.
- 10.2.6.2. Canada
- 10.2.6.3. Mexico
- 10.3. Europe
- 10.3.1. Introduction
- 10.3.2. Key Region-Specific Dynamics
- 10.3.3. Market Size Analysis and Y-o-Y Growth Analysis (%), By Technology Type
- 10.3.4. Market Size Analysis and Y-o-Y Growth Analysis (%), By Application
- 10.3.5. Market Size Analysis and Y-o-Y Growth Analysis (%), By End-User
- 10.3.6. Market Size Analysis and Y-o-Y Growth Analysis (%), By Country
- 10.3.6.1. Germany
- 10.3.6.2. UK
- 10.3.6.3. France
- 10.3.6.4. Italy
- 10.3.6.5. Russia
- 10.3.6.6. Rest of Europe
- 10.4. South America
- 10.4.1. Introduction
- 10.4.2. Key Region-Specific Dynamics
- 10.4.3. Market Size Analysis and Y-o-Y Growth Analysis (%), By Technology Type
- 10.4.4. Market Size Analysis and Y-o-Y Growth Analysis (%), By Application
- 10.4.5. Market Size Analysis and Y-o-Y Growth Analysis (%), By End-User
- 10.4.6. Market Size Analysis and Y-o-Y Growth Analysis (%), By Country
- 10.4.6.1. Brazil
- 10.4.6.2. Argentina
- 10.4.6.3. Rest of South America
- 10.5. Asia-Pacific
- 10.5.1. Introduction
- 10.5.2. Key Region-Specific Dynamics
- 10.5.3. Market Size Analysis and Y-o-Y Growth Analysis (%), By Technology Type
- 10.5.4. Market Size Analysis and Y-o-Y Growth Analysis (%), By Application
- 10.5.5. Market Size Analysis and Y-o-Y Growth Analysis (%), By End-User
- 10.5.6. Market Size Analysis and Y-o-Y Growth Analysis (%), By Country
- 10.5.6.1. China
- 10.5.6.2. India
- 10.5.6.3. Japan
- 10.5.6.4. Australia
- 10.5.6.5. Rest of Asia-Pacific
- 10.6. Middle East and Africa
- 10.6.1. Introduction
- 10.6.2. Key Region-Specific Dynamics
- 10.6.3. Market Size Analysis and Y-o-Y Growth Analysis (%), By Technology Type
- 10.6.4. Market Size Analysis and Y-o-Y Growth Analysis (%), By Application
- 10.6.5. Market Size Analysis and Y-o-Y Growth Analysis (%), By End-User
11. Competitive Landscape
- 11.1. Competitive Scenario
- 11.2. Market Positioning/Share Analysis
- 11.3. Mergers and Acquisitions Analysis
12. Company Profiles
- 12.1. Abengoa Water*
- 12.1.1. Company Overview
- 12.1.2. Product Portfolio and Description
- 12.1.3. Financial Overview
- 12.1.4. Recent Developments
- 12.2. Acciona S.A.
- 12.3. Doosan Heavy Industries & Construction Co., Ltd.
- 12.4. Suez Water Technologies & Solutions
- 12.5. Aquatech International LLC
- 12.6. Hyflux Ltd.
- 12.7. Veolia Water Technologies
- 12.8. General Electric Company
- 12.9. Fisia Italimpianti S.p.A.
- 12.10. Xylem Inc.
LIST NOT EXHAUSTIVE
13. Appendix
- 13.1. About Us and Services
- 13.2. Contact Us
