|
|
市場調査レポート
商品コード
1325343
腐食防止剤の世界市場-2023年~2030年Global Corrosion Inhibitors Market - 2023-2030 |
||||||
|
|
|||||||
|
● お客様のご希望に応じて、既存データの加工や未掲載情報(例:国別セグメント)の追加などの対応が可能です。 詳細はお問い合わせください。 |
|||||||


| 腐食防止剤の世界市場-2023年~2030年 |
|
出版日: 2023年08月04日
発行: DataM Intelligence
ページ情報: 英文 201 Pages
納期: 約2営業日
|
- 全表示
- 概要
- 目次
市場概要
腐食防止剤の世界市場は、2022年に81億米ドルに達し、2023-2030年の予測期間中にCAGR 4.8%で成長し、2030年には103億米ドルに達すると予測されています。世界の腐食防止剤市場は、産業が規制を遵守し、二酸化炭素排出量を削減し、持続可能な慣行を促進するのに役立つバイオベースの腐食防止剤の採用によって牽引されています。バイオベースの腐食防止剤は、再生可能資源から生成され、生分解性であり、従来のものよりも環境への影響が少ないため、増加しています。
有機腐食防止剤は、予測期間中、世界の腐食防止剤市場の30%近くを占めると予想されています。有機腐食防止剤は、無毒性で不燃性であり、揮発性有機化合物(VOC)を全く、あるいはほとんど排出しないため、より安全な嗜好品です。その安全性から、この分野は作業員の健康と安全が重要な分野での使用に適しています。
市場力学
腐食しやすい石油・ガス産業からの需要増加
NACE International(National Association of Corrosion Engineers)によると、米国の石油・ガスセクターの年間腐食コストは270億米ドルと推定されています。コスト削減は、耐腐食性材料を全体に使用し、腐食関連プロセスを使用することで可能です。腐食防止剤は、メンテナンスと修理のコストを最小限に抑え、機器の機能寿命を延ばし、生産ロスを減らすために産業界で使用されており、予測期間中の世界の腐食防止剤市場を牽引しています。
2022年6月30日現在、Gas Authority of India Ltd(GAIL)は33,815kmのインド最大の天然ガスパイプライン網を有しています。石油・ガスおよび電力生産プロジェクトの拡大に伴い、有機腐食防止剤の市場は大幅に上昇します。その結果、石油・ガスプロジェクトの増加が、予測期間中の有機腐食防止剤の世界市場を押し上げると予想されます。
保守・補修分野
産業やインフラが老朽化するにつれて、最大限の性能と寿命を保証するために定期的なメンテナンスと修理が必要になります。腐食は、石油・ガス、電力生産、化学処理、輸送、製造など、多くの産業にとって大きな問題です。腐食防止剤は、腐食を防止するための重要な手段であり、保守・補修事業において不可欠なものです。
腐食防止剤は、資産の故障を回避するために極めて重要です。腐食は機器や建物に大きな劣化をもたらし、故障や操業の中断、重大な安全問題を引き起こす可能性があります。腐食防止剤は、機器、パイプライン、建物の腐食を防止するための効率的な選択肢であり、故障の可能性を低減し、その結果、費用のかかる修理の必要性を低減します。
環境への有害な影響
重金属塩や無機塩は、長い間腐食防止剤として利用されてきました。クロム酸塩、2~5リン酸亜鉛、ポリリン酸塩、オルトリン酸塩は、最も一般的で費用対効果の高い塗料やコーティング剤です。これらの物質が人体にも環境にも有害であることが判明したため、現在ではその使用が制限されています。
1986年の緊急時計画および地域住民の知る権利法(Emergency Planning and Community Right to Know Act)、1993年のOSHA(米国労働安全衛生局)規制38、英国や一部の欧州諸国で採用されているCHARM(化学物質危険性評価およびリスク管理)モデルなど、さまざまな規制が続きました。その結果、過去10~15年の間に、より危険性の低い腐食防止剤に関する膨大な数の出版物が生まれました。
COVID-19影響分析
COVID-19の予期せぬ大流行の結果、世界各国がロックダウン規則を採用し、腐食防止剤の輸出入に影響を与えました。腐食防止剤は、水処理、プロセス・製品添加剤、石油・ガス生産など、さまざまな最終用途産業で使用されています。
疫病の流行と閉鎖のため、商品やサービスの購入が減少しており、腐食防止剤ビジネスに意図的に影響を与えています。渡航制限と封鎖はこのセクターに大きな影響を及ぼし、商品を海外に売り込むことを困難にしています。ようやく、すべての制限が解除された今、状況は終わったかもしれないです。世界経済は急速な回復を遂げるかもしれないです。
ロシア・ウクライナ戦争の影響分析
ロシア・ウクライナ戦争は地政学的リスクと不確実性を高め、市場の安定と投資家の信頼に影響を与えています。地政学的状況は、腐食防止剤の取引や調達方法に影響を与える可能性があります。紛争は同地域に不確実性と不安定性をもたらす可能性があり、腐食防止剤市場全体の需要に影響を与える可能性があります。
腐食防止剤に大きく依存している石油・ガス産業は、地政学的緊張やインフラ損傷の結果、操業に支障をきたす可能性があります。産業活動の減少は、影響を受けた地域における腐食防止剤の需要減少につながる可能性があります。
目次
第1章 調査手法と調査範囲
第2章 定義と概要
第3章 エグゼクティブサマリー
第4章 市場力学
- 影響要因
- 促進要因
- 腐食しやすい石油・ガス産業からの需要増加
- 保守・修理分野
- 抑制要因
- 環境への悪影響
- 機会
- 影響分析
- 促進要因
第5章 産業分析
- ポーターのファイブフォース分析
- サプライチェーン分析
- 価格分析
- 規制分析
第6章 COVID-19分析
第7章 製品別
- 有機
- 無機
第8章 タイプ別
- 水性
- 油性
第9章 エンドユーザー別
- 発電
- 石油・ガス
- パルプ・製紙
- 金属加工
- 化学処理
- 水処理
- その他
第10章 地域別
- 北米
- 米国
- カナダ
- メキシコ
- 欧州
- ドイツ
- 英国
- フランス
- イタリア
- スペイン
- その他欧州
- 南米
- ブラジル
- アルゼンチン
- その他南米
- アジア太平洋
- 中国
- インド
- 日本
- オーストラリア
- その他アジア太平洋地域
- 中東・アフリカ
第11章 競合情勢
- 競合シナリオ
- 市況/シェア分析
- M&A分析
第12章 企業プロファイル
- Nouryon
- 会社概要
- 製品ポートフォリオと説明
- 主なハイライト
- 財務概要
- Cortec Corporation
- Ashland Inc.
- Ecolab
- Henkel Iberica, S.A.
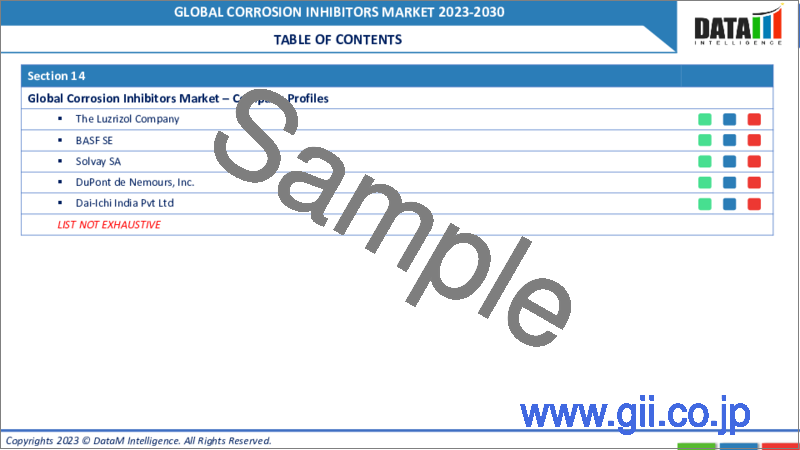
- The Lubrizol Company
- BASF SE
- Solvay SA
- DuPont de Nemours, Inc.
- Dai-Ichi India Pvt Ltd
第13章 付録
Market Overview
Global Corrosion Inhibitors Market reached US$ 8.1 billion in 2022 and is expected to reach US$ 10.3 billion by 2030 growing with a CAGR of 4.8% during the forecast period 2023-2030. The global corrosion inhibitors market is being driven by the adoption of bio-based corrosion inhibitors that helps industries comply with regulations, reduce their carbon footprint and promote sustainable practices. Bio-based corrosion inhibitors are rising since they are generated from renewable resources, are biodegradable and have lesser environmental implications than conventional counterparts.
Organic corrosion inhibitors are expected to account for nearly 30% of the global corrosion inhibitors market during the forecast period. Organic corrosion inhibitors are a safer preference since they are non-toxic, non-flammable and emit no or little volatile organic compound (VOC). Due to their safer nature, the segment is appropriate for use in sectors where worker health and safety are critical.
Market Dynamics
Rising Demand from Oil & Gas Industry as it is More Prone to Corrosion
According to NACE International (National Association of Corrosion Engineers), the yearly cost of corrosion to the oil and gas sector in U.S. is estimated to be US$ 27 billion. Costs can be reduced by using corrosion-resistant materials throughout and using corrosion-related processes. Corrosion inhibitors are used in industries to minimize maintenance and repair costs, extend the functional lifespan of equipment and reduce production loss, driving the global corrosion inhibitors market during the forecast period.
As of June 30, 2022, the Gas Authority of India Ltd (GAIL) has the largest natural gas pipeline network in India, with 33,815 km. The market for organic corrosion inhibitors will rise significantly as oil and gas and power production projects expand. As a result, the rising oil & gas projects is expected to boost the global organic corrosion inhibitors market during the forecast period.
Maintenance and Repair Sector
As industries and infrastructure age, they require routine maintenance and repair to guarantee maximum performance and lifespan. Corrosion is a major issue for many industries, including oil & gas, power production, chemical processing, transportation and manufacturing. Corrosion inhibitors are critical instruments in the fight against the prevention of corrosion, making them essential in the maintenance and repair business.
Corrosion inhibitors are crucial for avoiding asset failures. Corrosion may cause considerable degradation in equipment and buildings, resulting in malfunctions, interruptions in operations and serious safety issues. Corrosion inhibitors are an efficient option for preventing corrosion in equipment, pipelines and buildings, lowering the chance of failure and resulting need for costly repairs.
Harmful Impact on Environment
Heavy metal salts and inorganic salts have long been utilised as corrosion inhibitors. Chromates, between 2- and 5-zinc phosphates, polyphosphates and orthophosphates are the most prevalent and cost-effective coatings and paints. Since it has been discovered that these materials are hazardous to both humans and the environment, their widespread usage is now restricted.
Various regulations followed, such as the Emergency Planning and Community Right to Know Act of 1986, OSHA (U.S. Occupational Safety and Health Administration) regulations in 19938 and the CHARM (Chemical Hazard Assessment and Risk Management) model followed by UK and some European countries. It has resulted in a huge number of publications in the last 10-15 years about less hazardous corrosion inhibitors.
COVID-19 Impact Analysis
As a result of the unexpected outbreak of the COVID-19 pandemic, nations throughout the world adopted lockdown rules, affecting corrosion inhibitor import and export. Corrosion inhibitors are used in various applications such as water treatment, process and product additives, and oil & gas production in a variety of end-use industries.
Because of the epidemic and shutdown, there is a decrease in the buying of goods and services, which has intentionally affected the corrosion inhibitors business. Travel restrictions and lockdown have had a significant influence on the sector, making it difficult to market the goods abroad. Finally, the situation may be over now that all limitations have been lifted. The global economy might experience a fast rebound due to the rapid rate of recovery.
Russia-Ukraine War Impact Analysis
Russia-Ukraine war has raised geopolitical risk and uncertainty, affecting market stability and investor confidence. The geopolitical situation could impact how corrosion inhibitors are traded and sourced. The conflict has the potential to cause uncertainty and instability in the region, which might have an influence on overall corrosion inhibitor market demand.
Oil and gas industries, which rely heavily on corrosion inhibitors, may experience operational disruptions as a result of geopolitical tensions or infrastructural damage. Reduced industrial activity may lead to a decrease in demand for corrosion inhibitors in impacted areas.
Segment Analysis
The global corrosion inhibitors market is segmented based on product, type, end-user and region.
The Growing Corrosion in Oil & Gas Pipelines
The oil & gas end-user segment, which is the largest, is projected to account for more than 35% share of the global corrosion inhibitors market, owing to the rising usage of corrosion inhibitors in the oil & gas sector in 2022. Corrosion is common in oil and gas pipelines. According to the Association for Materials Protection and Performance (AMPP, formerly NACE), corrosion causes about US$ 2.5 trillion in losses and damages to the worldwide economy each year.
Pipelines are always exposed to corrosion risks due to their function as a method of transferring oil and gas from well heads to processing facilities, from the period of commissioning until decommissioning. As per U.S. Energy Information Administration, global liquid fuel consumption will rise by 1.6 million barrels per day (b/d) in 2023, from an average of 99.4 million b/d in 2022. According to their projection, consumption will increase by 1.7 million b/d in 2024.
Geographical Analysis
The Growing Infrastructure Projects in North America
North America is expected to develop at the fastest CAGR in the global corrosion inhibitors market during the forecast period, owing to the region's well-established industries such as oil and gas, chemical and power generation. The region's corrosion inhibitor demand is driven by these sectors' significant requirement for corrosion inhibitors to protect their machinery and infrastructure.
Furthermore, according to the International Energy Agency, U.S. is the world's second biggest renewable energy market, investing much in the maintenance and operation of turbines, gearboxes, pipelines and other equipment. In addition, there are several contemporary corrosion inhibitor production plants and research and development centres in North America. Therefore, the area is able to develop cutting-edge corrosion inhibitors of the highest quality that can suit the diverse needs of numerous industries.
Competitive Landscape
The major global players include Nouryon, Cortec Corporation, Ashland Inc., Ecolab, Henkel Iberica, S.A., The Lubrizol Company, BASF SE, Solvay SA, DuPont de Nemours, Inc. and Dai - Ichi India Pvt Ltd.
Why Purchase the Report?
- To visualize the global corrosion inhibitors market segmentation based on product, type, end-user and region, as well as understand key commercial assets and players.
- Identify commercial opportunities by analyzing trends and co-development.
- Excel data sheet with numerous data points of corrosion inhibitors market-level with all segments.
- PDF report consists of a comprehensive analysis after exhaustive qualitative interviews and an in-depth study.
- Product mapping available as excel consisting of key products of all the major players.
The global corrosion inhibitors market report would provide approximately 61 tables, 59 figures and 201 pages.
Target Audience 2023
- Manufacturers/ Buyers
- Industry Investors/Investment Bankers
- Research Professionals
- Emerging Companies
Table of Contents
1. Methodology and Scope
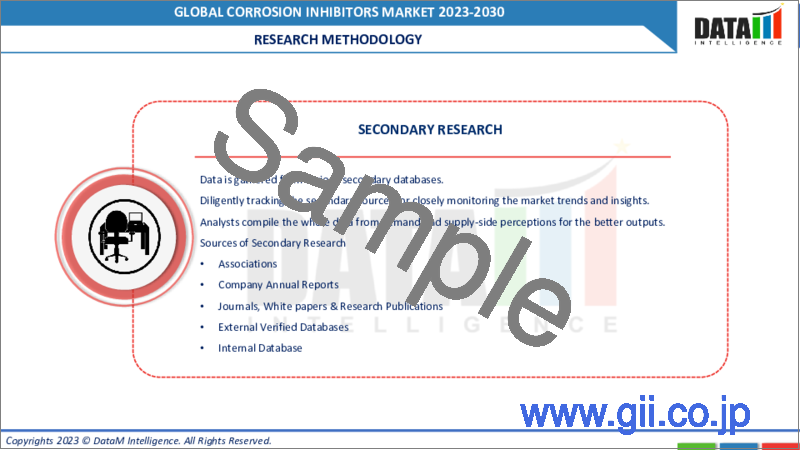
- 1.1. Research Methodology
- 1.2. Research Objective and Scope of the Report
2. Definition and Overview
3. Executive Summary
- 3.1. Market Snippet by Product
- 3.2. Market Snippet by Type
- 3.3. Market Snippet by End-User
- 3.4. Market Snippet by Region
4. Dynamics
- 4.1. Impacting Factors
- 4.1.1. Drivers
- 4.1.1.1. Rising Demand from Oil & Gas Industry as it is More Prone to Corrosion
- 4.1.1.2. Maintenance and Repair Sector
- 4.1.2. Restraints
- 4.1.2.1. Harmful Impact on Environment
- 4.1.3. Opportunity
- 4.1.4. Impact Analysis
- 4.1.1. Drivers
5. Industry Analysis
- 5.1. Porter's Five Force Analysis
- 5.2. Supply Chain Analysis
- 5.3. Pricing Analysis
- 5.4. Regulatory Analysis
6. COVID-19 Analysis
- 6.1. Analysis of COVID-19
- 6.1.1. Scenario Before COVID
- 6.1.2. Scenario During COVID
- 6.1.3. Scenario Post COVID
- 6.2. Pricing Dynamics Amid COVID-19
- 6.3. Demand-Supply Spectrum
- 6.4. Government Initiatives Related to the Market During Pandemic
- 6.5. Manufacturers Strategic Initiatives
- 6.6. Conclusion
7. By Product
- 7.1. Introduction
- 7.1.1. Market Size Analysis and Y-o-Y Growth Analysis (%), By Product
- 7.1.2. Market Attractiveness Index, By Product
- 7.2. Organic*
- 7.2.1. Introduction
- 7.2.2. Market Size Analysis and Y-o-Y Growth Analysis (%)
- 7.3. Inorganic
8. By Type
- 8.1. Introduction
- 8.1.1. Market Size Analysis and Y-o-Y Growth Analysis (%), By Type
- 8.1.2. Market Attractiveness Index, By Type
- 8.2. Water-based*
- 8.2.1. Introduction
- 8.2.2. Market Size Analysis and Y-o-Y Growth Analysis (%)
- 8.3. Oil-based
9. By End-User
- 9.1. Introduction
- 9.1.1. Market Size Analysis and Y-o-Y Growth Analysis (%), By End-User
- 9.1.2. Market Attractiveness Index, By End-User
- 9.2. Power Generation*
- 9.2.1. Introduction
- 9.2.2. Market Size Analysis and Y-o-Y Growth Analysis (%)
- 9.3. Oil & Gas
- 9.4. Pulp And Paper
- 9.5. Metal Processing
- 9.6. Chemical Processing
- 9.7. Water Treatment
- 9.8. Others
10. By Region
- 10.1. Introduction
- 10.2. Market Size Analysis and Y-o-Y Growth Analysis (%), By Region
- 10.3. Market Attractiveness Index, By Region
- 10.4. North America
- 10.4.1. Introduction
- 10.4.2. Key Region-Specific Dynamics
- 10.4.3. Market Size Analysis and Y-o-Y Growth Analysis (%), By Product
- 10.4.4. Market Size Analysis and Y-o-Y Growth Analysis (%), By Type
- 10.4.5. Market Size Analysis and Y-o-Y Growth Analysis (%), By End-User
- 10.4.6. Market Size Analysis and Y-o-Y Growth Analysis (%), By Country
- 10.4.6.1. U.S.
- 10.4.6.2. Canada
- 10.4.6.3. Mexico
- 10.5. Europe
- 10.5.1. Introduction
- 10.5.2. Key Region-Specific Dynamics
- 10.5.3. Market Size Analysis and Y-o-Y Growth Analysis (%), By Product
- 10.5.4. Market Size Analysis and Y-o-Y Growth Analysis (%), By Type
- 10.5.5. Market Size Analysis and Y-o-Y Growth Analysis (%), By End-User
- 10.5.6. Market Size Analysis and Y-o-Y Growth Analysis (%), By Country
- 10.5.6.1. Germany
- 10.5.6.2. UK
- 10.5.6.3. France
- 10.5.6.4. Italy
- 10.5.6.5. Spain
- 10.5.6.6. Rest of Europe
- 10.6. South America
- 10.6.1. Introduction
- 10.6.2. Key Region-Specific Dynamics
- 10.6.3. Market Size Analysis and Y-o-Y Growth Analysis (%), By Product
- 10.6.4. Market Size Analysis and Y-o-Y Growth Analysis (%), By Type
- 10.6.5. Market Size Analysis and Y-o-Y Growth Analysis (%), By End-User
- 10.6.6. Market Size Analysis and Y-o-Y Growth Analysis (%), By Country
- 10.6.6.1. Brazil
- 10.6.6.2. Argentina
- 10.6.6.3. Rest of South America
- 10.7. Asia-Pacific
- 10.7.1. Introduction
- 10.7.2. Key Region-Specific Dynamics
- 10.7.3. Market Size Analysis and Y-o-Y Growth Analysis (%), By Product
- 10.7.4. Market Size Analysis and Y-o-Y Growth Analysis (%), By Type
- 10.7.5. Market Size Analysis and Y-o-Y Growth Analysis (%), By End-User
- 10.7.6. Market Size Analysis and Y-o-Y Growth Analysis (%), By Country
- 10.7.6.1. China
- 10.7.6.2. India
- 10.7.6.3. Japan
- 10.7.6.4. Australia
- 10.7.6.5. Rest of Asia-Pacific
- 10.8. Middle East and Africa
- 10.8.1. Introduction
- 10.8.2. Key Region-Specific Dynamics
- 10.8.3. Market Size Analysis and Y-o-Y Growth Analysis (%), By Product
- 10.8.4. Market Size Analysis and Y-o-Y Growth Analysis (%), By Type
- 10.8.5. Market Size Analysis and Y-o-Y Growth Analysis (%), By End-User
11. Competitive Landscape
- 11.1. Competitive Scenario
- 11.2. Market Positioning/Share Analysis
- 11.3. Mergers and Acquisitions Analysis
12. Company Profiles
- 12.1. Nouryon*
- 12.1.1. Company Overview
- 12.1.2. Product Portfolio and Description
- 12.1.3. Key Highlights
- 12.1.4. Financial Overview
- 12.2. Cortec Corporation
- 12.3. Ashland Inc.
- 12.4. Ecolab
- 12.5. Henkel Iberica, S.A.
- 12.6. The Lubrizol Company
- 12.7. BASF SE
- 12.8. Solvay SA
- 12.9. DuPont de Nemours, Inc.
- 12.10. Dai - Ichi India Pvt Ltd
LIST NOT EXHAUSTIVE
13. Appendix
- 13.1. About Us and Services
- 13.2. Contact Us