|
|
市場調査レポート
商品コード
1316275
淡水化の世界市場:2023年~2030年Global Desalination Market - 2023-2030 |
||||||
カスタマイズ可能
適宜更新あり
|
|||||||


| 淡水化の世界市場:2023年~2030年 |
|
出版日: 2023年07月27日
発行: DataM Intelligence
ページ情報: 英文 219 Pages
納期: 即日から翌営業日
|

- 全表示
- 概要
- 目次
市場概要
世界の淡水化市場は、2022年に75億米ドルに達し、2023-2030年の予測期間中にCAGR 9.3%で成長し、2030年には153億米ドルに達すると予測されています。
世界の淡水化市場は、水不足の懸念が強まるにつれて継続的な成長が見込まれています。改善された膜、エネルギー回収システム、革新的な脱塩方法などの技術進歩により、プロセスの効率と費用対効果が高まると予想されます。さらに、淡水化に伴う環境への影響と運転コストを削減するため、代替エネルギー源やハイブリッド淡水化システムの調査も進められています。
逆浸透膜は、2022年に33.3%近くを占める世界淡水化市場で最も高い成長を示しています。多くの重要企業が淡水化のために逆浸透膜に投資しており、主にこのプロセスで海水を淡水化するために必要な技術と膜を開発しています。
市場力学
水不足の拡大
中東や北アフリカなどの水不足地域は、淡水化の最前線にあります。例えば、エジプトは現在、年間70億立方メートル以上の水不足を抱えています。世界で18億人が絶対的な水不足に陥ると予測される2025年までには、気候変動がこの問題に大きな役割を果たす可能性が高く、水不足に陥るかもしれないです。子どもたちはより脆弱で、干ばつや熱波などのショックに耐えることができないです。
そのため、増大する水需要を克服するため、政府は淡水化市場に投資することで必要な対策を講じています。例えば、エジプトの内閣は、サウジアラビアのアブドゥル・ラティフ・ジャミール・エナジー&エンバイロメンタル・サービスとハッサン・アラム・ホールディングが、2030年までに1日あたり約290万立方メートルの水を生成できる巨大な淡水化プラントを建設するオファーを提出したと発表しました。
政府の取り組みと政策
政府のイニシアティブと政策は、投資を促進し、研究開発を支援し、持続可能な実践を保証し、パートナーシップを促進することによって、淡水化市場を可能にする環境を作り出しています。水の安全保障を優先し、淡水化を実行可能なソリューションとして受け入れることで、政府は淡水化市場の成長を促進する上で極めて重要な役割を果たしています。
例えば、2022年3月16日、コンラッド・アブダビ・エティハド・タワーズ・ホテルで開催された「第3回MENA淡水化プロジェクト・フォーラム2022」の最高幹部によると、サウジアラビアは総額350億SR(93億3,000万米ドル)に上る60以上の水プロジェクトを発表し、同国が世界最大の淡水化市場としての地位を固めることを明らかにしました。
高い資本コストと運営コスト
投資家や金融機関は、長期的な投資収益と潜在的なリスクのため、資金提供をためらう可能性があります。特に水不足が深刻な地域では、手ごろな資金調達手段を利用できないことが、淡水化プロジェクトの発展を妨げる可能性があります。
さらに、淡水化には初期投資に加え、継続的なメンテナンス、サポート、定期的なソフトウェアのアップグレードが必要な場合が多いです。これらのコストは莫大なものになる可能性があり、特にIT専任のリソースがない組織や、技術関連費用に割り当てられる資金が限られている組織では、予算が圧迫される可能性があります。
COVID-19影響分析
パンデミックの初期段階では、多くの国が封鎖措置や渡航制限を実施し、世界なサプライチェーンの混乱につながっています。このため、淡水化プラントに必要不可欠な部品や材料の調達や輸送に影響が及び、建設プロジェクトや設備の設置に遅れが生じました。
さらに、パンデミックによってもたらされた経済的不確実性と財政的制約が、淡水化プラントを含む様々なインフラ・プロジェクトの遅延や延期につながっています。政府や民間投資家は、資金や資源の配分で課題に直面し、優先順位を当面のヘルスケアや救援対策に振り向けた。
目次
第1章 調査手法と調査範囲
第2章 定義と概要
第3章 エグゼクティブサマリー
第4章 市場力学
- 影響要因
- 促進要因
- 水不足の深刻化
- 政府の取り組みと政策
- 抑制要因
- 高い資本コストと運用コスト
- 機会
- 影響分析
- 促進要因
第5章 産業分析
- ポーターのファイブフォース分析
- サプライチェーン分析
- 価格分析
- 規制分析
第6章 COVID-19分析
第7章 技術別
- マルチステージフラッシュ(MSF)
- 逆浸透(RO)
- 多段蒸留(MED)
- 電気透析(ED)
- その他
第8章 水源別
- 海水
- 汽水
- 廃水
第9章 エネルギー源別
- 再生可能
- 再生不可
第10章 エンドユーザー別
- 自治体
- 産業用
- その他
第11章 地域別
- 北米
- 米国
- カナダ
- メキシコ
- 欧州
- ドイツ
- 英国
- フランス
- イタリア
- ロシア
- その他欧州
- 南米
- ブラジル
- アルゼンチン
- その他南米
- アジア太平洋
- 中国
- インド
- 日本
- オーストラリア
- その他アジア太平洋地域
- 中東・アフリカ
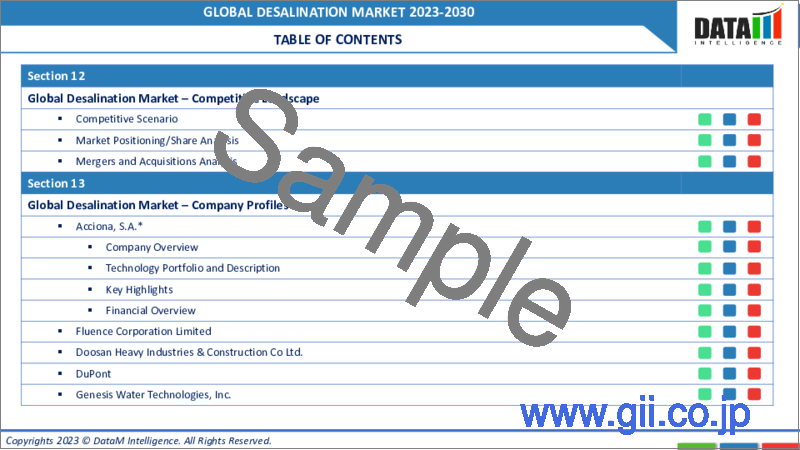
第12章 競合情勢
- 競合シナリオ
- 市況/シェア分析
- M&A分析
第13章 企業プロファイル
- Acciona, S.A.
- 会社概要
- 製品ポートフォリオと説明
- 財務概要
- Fluence Corporation Limited
- Doosan Heavy Industries & Construction Co Ltd.
- Genesis Water Technologies, Inc.
- DuPont
- IDE Technologies Ltd.
- Koch Membrane Systems Inc
- Lanxess AG
- SUEZ Water Technologies & Solutions SA
- Veolia Environnement S.A
第14章 付録
Market Overview
Global Desalination Market reached US$ 7.5 billion in 2022 and is expected to reach US$ 15.3 billion by 2030 growing with a CAGR of 9.3% during the forecast period 2023-2030.
The global desalination market is expected to witness continued growth as water scarcity concerns intensify. Technological advancements, including improved membranes, energy recovery systems, and innovative desalination methods, are anticipated to enhance the efficiency and cost-effectiveness of the process. Furthermore, research is underway to explore alternative energy sources and hybrid desalination systems to reduce the environmental impact and operational costs associated with desalination.
Reverse osmosis has shown the highest growth in the global desalination market covering nearly 33.3% in 2022. Many important companies are investing in reverse osmosis for desalination, mainly to develop the technology and membranes needed to desalinate water through this process.
Market Dynamics
Growing Water Scarcity
Water-stressed regions, such as the Middle East and North Africa, have been at the forefront of desalination adoption. For instance, Egypt currently has an annual water deficit of over seven billion cubic meters. By 2025, when it is predicted that 1.8 billion people will live in absolute water shortage worldwide, climate change will likely play a significant role in the issue and the country may run out of water. Children are more vulnerable and unable to withstand shocks such as droughts and heat waves.
Therefore to overcome the growing water demand government is taking the required measures by investing in the desalination market. For instance, Egypt's cabinet has announced that Saudi Arabia's Abdul Latif Jameel Energy & Environmental Services and Hassan Allam Holding had submitted an offer to build a huge desalination plant capable of generating around 2.9 million cubic meters of water per day by 2030.
Government Initiatives and Policies
Government initiatives and policies create an enabling environment for the desalination market by fostering investment, supporting R&D, ensuring sustainable practices, and facilitating partnerships. By prioritizing water security and embracing desalination as a viable solution, governments play a pivotal role in driving the growth of the desalination market.
For instance, on March 16, 2022, According to a top official at the 3rd MENA Desalination Projects Forum 2022, which got underway at the Conrad Abu Dhabi Etihad Towers Hotel, Saudi Arabia announced more than 60 water projects totaling SR35 billion (US$9.33 billion), which will solidify the Kingdom's position as the largest water desalination market in the world.
High Capital and Operational Costs
Investors and lenders may be hesitant to provide funding due to the long-term return on investment and potential risks involved. The lack of access to affordable financing options can hinder the development of desalination projects, particularly in regions where water scarcity is most severe.
Furthermore, in addition to the initial investment, Desalination often requires ongoing maintenance, support, and regular software upgrades. These costs can be significant and may strain the budgets of organizations, especially if they lack dedicated IT resources or have limited funds allocated for technology-related expenses.
COVID-19 Impact Analysis
During the initial stages of the pandemic, many countries implemented lockdown measures and travel restrictions, leading to disruptions in global supply chains. This affected the procurement and transportation of essential components and materials required for desalination plants, causing delays in construction projects and equipment installations.
Furthermore, the economic uncertainty and financial constraints brought about by the pandemic led to the delay or postponement of various infrastructure projects, including desalination plants. Governments and private investors faced challenges in allocating funds and resources, diverting priorities towards immediate healthcare and relief measures.
Segment Analysis
The global desalination market is segmented based on technology, source, energy source, end-user and region.
Growing Advancements In Reverse Osmosis Technology
The outdoor location is expected to show significant growth in the global desalination market. The dominance of reverse osmosis in the global desalination market is expected to continue, driven by ongoing technological advancements, increasing water demand, and the need for sustainable water supply solutions.
Many important companies are investing in reverse osmosis for desalination, mainly to develop the technology and membranes needed to desalinate water through this process. For instance, DuPont launched a new biofouling prevention solution for reverse osmosis installations on March 30, 2021, to decrease operational expenses while increasing plant uptime and dependability. DuPont intends to demonstrate innovative leadership and dedication to solving client water concerns with this new patent-pending solution.
Geographical Analysis
Middle East And Africa's Rapid Population Growth, Coupled With Limited Freshwater Resources
Middle East and Africa dominated the desalination market and are expected to dominate in the forecast period. Governments in the region have recognized the importance of desalination and have provided substantial support through policies, regulations, and investments. This support includes funding for infrastructure development, research and development initiatives, and partnerships with private entities.
Growing investments in various parts of the region are expected to create growth prospects for the market. The Red Sea coast, Suez, Ismailia, Port Said, Dakahlia, Kafr e-Sheikh, and North and South Sinai are among the governorates where desalination plants are expected to be situated., and the Red Sea will be the primary focus of the first phase.
Competitive Landscape
The major global players include: Acciona, S.A, Fluence Corporation Limited, Doosan Heavy Industries & Construction Co Ltd, Genesis Water Technologies, Inc, DuPont, IDE Technologies Ltd, Koch Membrane Systems Inc, Lanxess AG, SUEZ Water Technologies & Solutions SA and Veolia Environnement S.A.
Why Purchase the Report?
- To visualize the global desalination market segmentation based on technology, source, energy source, end-user and region, as well as understand key commercial assets and players.
- Identify commercial opportunities by analyzing trends and co-development.
- Excel data sheet with numerous data points of desalination market-level with all segments.
- PDF report consists of a comprehensive analysis after exhaustive qualitative interviews and an in-depth study.
- Product mapping available as excel consisting of key products of all the major players.
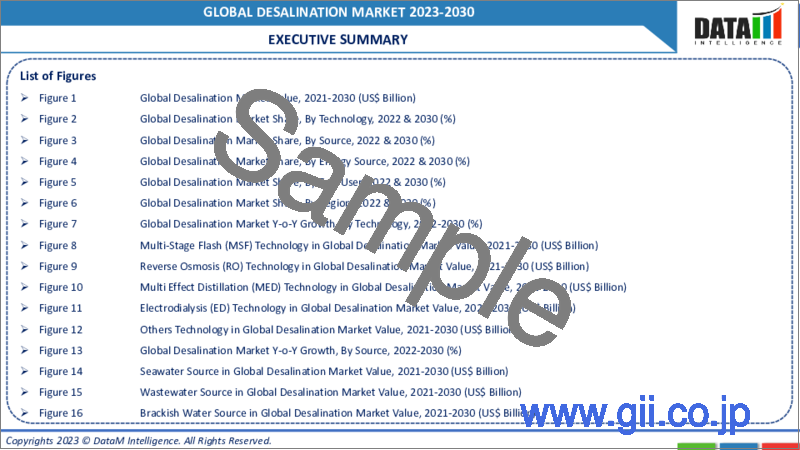
The global desalination market report would provide approximately 69 tables, 68 figures and 219 Pages.
Target Audience 2023
- Manufacturers/ Buyers
- Industry Investors/Investment Bankers
- Research Professionals
- Emerging Companies
Table of Contents
1. Methodology and Scope
- 1.1. Research Methodology
- 1.2. Research Objective and Scope of the Report
2. Definition and Overview
3. Executive Summary
- 3.1. Snippet by Technology
- 3.2. Snippet by Source
- 3.3. Snippet by Energy Source
- 3.4. Snippet by End-User
- 3.5. Snippet by Region
4. Dynamics
- 4.1. Impacting Factors
- 4.1.1. Drivers
- 4.1.1.1. Growing Water Scarcity
- 4.1.1.2. Government Initiatives and Policies
- 4.1.2. Restraints
- 4.1.2.1. High Capital and Operational Costs
- 4.1.3. Opportunity
- 4.1.4. Impact Analysis
- 4.1.1. Drivers
5. Industry Analysis
- 5.1. Porter's Five Force Analysis
- 5.2. Supply Chain Analysis
- 5.3. Pricing Analysis
- 5.4. Regulatory Analysis
6. COVID-19 Analysis
- 6.1. Analysis of COVID-19
- 6.1.1. Scenario Before COVID
- 6.1.2. Scenario During COVID
- 6.1.3. Scenario Post COVID
- 6.2. Pricing Dynamics Amid COVID-19
- 6.3. Demand-Supply Spectrum
- 6.4. Government Initiatives Related to the Market During Pandemic
- 6.5. Manufacturers Strategic Initiatives
- 6.6. Conclusion
7. By Technology
- 7.1. Introduction
- 7.1.1. Market Size Analysis and Y-o-Y Growth Analysis (%), By Technology
- 7.1.2. Market Attractiveness Index, By Technology
- 7.2. Multi Stage Flash (MSF) *
- 7.2.1. Introduction
- 7.2.2. Market Size Analysis and Y-o-Y Growth Analysis (%)
- 7.3. Reverse Osmosis (RO)
- 7.4. Multi Effect Distillation (MED)
- 7.5. Electrodialysis (ED)
- 7.6. Others
8. By Source
- 8.1. Introduction
- 8.1.1. Market Size Analysis and Y-o-Y Growth Analysis (%), By Source
- 8.1.2. Market Attractiveness Index, By Source
- 8.2. Seawater*
- 8.2.1. Introduction
- 8.2.2. Market Size Analysis and Y-o-Y Growth Analysis (%)
- 8.3. Brackish Water
- 8.4. Wastewater
9. By Energy Source
- 9.1. Introduction
- 9.1.1. Market Size Analysis and Y-o-Y Growth Analysis (%), By Energy Source
- 9.1.2. Market Attractiveness Index, By Energy Source
- 9.2. Renewable*
- 9.2.1. Introduction
- 9.2.2. Market Size Analysis and Y-o-Y Growth Analysis (%)
- 9.3. Non-renewable
10. By End-User
- 10.1. Introduction
- 10.1.1. Market Size Analysis and Y-o-Y Growth Analysis (%), By End-User
- 10.1.2. Market Attractiveness Index, By End-User
- 10.2. Municipal*
- 10.2.1. Introduction
- 10.2.2. Market Size Analysis and Y-o-Y Growth Analysis (%)
- 10.3. Industrial
- 10.4. Others
11. By Region
- 11.1. Introduction
- 11.1.1. Market Size Analysis and Y-o-Y Growth Analysis (%), By Region
- 11.1.2. Market Attractiveness Index, By Region
- 11.2. North America
- 11.2.1. Introduction
- 11.2.2. Key Region-Specific Dynamics
- 11.2.3. Market Size Analysis and Y-o-Y Growth Analysis (%), By Technology
- 11.2.4. Market Size Analysis and Y-o-Y Growth Analysis (%), By Source
- 11.2.5. Market Size Analysis and Y-o-Y Growth Analysis (%), By Energy Source
- 11.2.6. Market Size Analysis and Y-o-Y Growth Analysis (%), By End-User
- 11.2.7. Market Size Analysis and Y-o-Y Growth Analysis (%), By Country
- 11.2.7.1. U.S.
- 11.2.7.2. Canada
- 11.2.7.3. Mexico
- 11.3. Europe
- 11.3.1. Introduction
- 11.3.2. Key Region-Specific Dynamics
- 11.3.3. Market Size Analysis and Y-o-Y Growth Analysis (%), By Technology
- 11.3.4. Market Size Analysis and Y-o-Y Growth Analysis (%), By Source
- 11.3.5. Market Size Analysis and Y-o-Y Growth Analysis (%), By Energy Source
- 11.3.6. Market Size Analysis and Y-o-Y Growth Analysis (%), By End-User
- 11.3.7. Market Size Analysis and Y-o-Y Growth Analysis (%), By Country
- 11.3.7.1. Germany
- 11.3.7.2. UK
- 11.3.7.3. France
- 11.3.7.4. Italy
- 11.3.7.5. Russia
- 11.3.7.6. Rest of Europe
- 11.4. South America
- 11.4.1. Introduction
- 11.4.2. Key Region-Specific Dynamics
- 11.4.3. Market Size Analysis and Y-o-Y Growth Analysis (%), By Technology
- 11.4.4. Market Size Analysis and Y-o-Y Growth Analysis (%), By Source
- 11.4.5. Market Size Analysis and Y-o-Y Growth Analysis (%), By Energy Source
- 11.4.6. Market Size Analysis and Y-o-Y Growth Analysis (%), By End-User
- 11.4.7. Market Size Analysis and Y-o-Y Growth Analysis (%), By Country
- 11.4.7.1. Brazil
- 11.4.7.2. Argentina
- 11.4.7.3. Rest of South America
- 11.5. Asia-Pacific
- 11.5.1. Introduction
- 11.5.2. Key Region-Specific Dynamics
- 11.5.3. Market Size Analysis and Y-o-Y Growth Analysis (%), By Technology
- 11.5.4. Market Size Analysis and Y-o-Y Growth Analysis (%), By Source
- 11.5.5. Market Size Analysis and Y-o-Y Growth Analysis (%), By Energy Source
- 11.5.6. Market Size Analysis and Y-o-Y Growth Analysis (%), By End-User
- 11.5.7. Market Size Analysis and Y-o-Y Growth Analysis (%), By Country
- 11.5.7.1. China
- 11.5.7.2. India
- 11.5.7.3. Japan
- 11.5.7.4. Australia
- 11.5.7.5. Rest of Asia-Pacific
- 11.6. Middle East and Africa
- 11.6.1. Introduction
- 11.6.2. Key Region-Specific Dynamics
- 11.6.3. Market Size Analysis and Y-o-Y Growth Analysis (%), By Technology
- 11.6.4. Market Size Analysis and Y-o-Y Growth Analysis (%), By Source
- 11.6.5. Market Size Analysis and Y-o-Y Growth Analysis (%), By Energy Source
- 11.6.6. Market Size Analysis and Y-o-Y Growth Analysis (%), By End-User
12. Competitive Landscape
- 12.1. Competitive Scenario
- 12.2. Market Positioning/Share Analysis
- 12.3. Mergers and Acquisitions Analysis
13. Company Profiles
- 13.1. Acciona, S.A.*
- 13.1.1. Company Overview
- 13.1.2. Product Portfolio and Description
- 13.1.3. Financial Overview
- 13.2. Fluence Corporation Limited
- 13.3. Doosan Heavy Industries & Construction Co Ltd.
- 13.4. Genesis Water Technologies, Inc.
- 13.5. DuPont
- 13.6. IDE Technologies Ltd.
- 13.7. Koch Membrane Systems Inc
- 13.8. Lanxess AG
- 13.9. SUEZ Water Technologies & Solutions SA
- 13.10. Veolia Environnement S.A
LIST NOT EXHAUSTIVE
14. Appendix
- 14.1. About Us and Services
- 14.2. Contact Us
