|
|
市場調査レポート
商品コード
1316223
エネルギー効率に優れた肉盛溶接の世界市場-2023年~2030年Global Energy-Efficient Build-Up Welding Market - 2023-2030 |
||||||
|
|
|||||||
カスタマイズ可能
適宜更新あり
|
|||||||


| エネルギー効率に優れた肉盛溶接の世界市場-2023年~2030年 |
|
出版日: 2023年07月27日
発行: DataM Intelligence
ページ情報: 英文 201 Pages
納期: 即日から翌営業日
|

- 全表示
- 概要
- 目次
市場概要
エネルギー効率に優れた肉盛溶接の世界市場は、2022年に106億米ドルに達し、2023~2030年の予測期間にCAGR 5.8%で成長し、2030年には167億米ドルに達すると予測されています。エネルギー効率に優れた肉盛溶接の世界市場は、省エネルギー、環境維持に対する意識の高まり、効率的な製造プロセスへの需要により、近年著しい成長を遂げています。エネルギー効率に優れた肉盛溶接技術は、自動車、航空宇宙、製造、建設、発電、石油・ガスなど、さまざまな産業で脚光を浴びています。
中国の製造能力の高さは、省エネルギーと持続可能な実践への注力と相まって、エネルギー効率に優れた肉盛溶接市場の成長を後押ししています。中国のメーカーは、エネルギー効率の高い溶接ソリューションに対する需要の高まりに対応するため、研究開発、技術革新、提携に投資しています。こうした技術の採用は中国でも成長を続け、世界市場の拡大に貢献すると予想されます。そのため、中国は地域別シェアの半分近くを占めています。
市場力学
エネルギーコストの増加
エネルギーコストの増加は、企業がエネルギー効率に優れた肉盛溶接ソリューションを求めるきっかけとなっています。この分野における最近の開発は、プロセス効率の改善、コスト削減機能の組み込み、エネルギー消費の監視、効率基準の遵守に重点を置いています。
これらの技術を採用することで、企業はエネルギー・コスト上昇の影響を緩和し、環境フットプリントを削減し、収益を改善することができます。その結果、世界のエネルギー効率に優れた肉盛溶接市場は、省エネソリューションに対する需要の高まりを受けて成長を続けています。
作業効率の重視
作業効率は、環境の持続可能性と密接に結びついています。エネルギー効率に優れた肉盛溶接は、エネルギー消費量を削減し、二酸化炭素排出量を削減することで、持続可能な製造方法に貢献します。環境の持続可能性を優先する企業は、ブランド評価の向上、環境規制の遵守、環境に配慮した製品を求める市場への参入といったメリットを得ることができます。持続可能性が重視されるようになったことで、エネルギー効率に優れた肉盛溶接ソリューションの採用が進んでいます。
環境規制とエネルギー効率規制の遵守は、さまざまな業界で事業を展開する企業にとって極めて重要な要素です。エネルギー効率に優れた肉盛溶接は、企業が規制要件を満たし、持続可能な実践へのコミットメントを示すのに役立ちます。エネルギー効率に関連する規制や基準に準拠する必要性が、エネルギー効率に優れた肉盛溶接技術の採用を後押ししています。
高い初期投資
企業の資本には限りがあり、それをさまざまな業務上のニーズに割り当てる必要があります。複数の投資オプションに直面した場合、企業はエネルギー効率に優れた肉盛溶接設備よりも他の分野を優先する可能性があります。これには、中核となる生産機械への投資、拡張プロジェクト、その他差し迫った経営上の必要事項が含まれます。その結果、エネルギー効率の高い溶接ソリューションへの資金配分が優先されなくなり、市場成長の妨げになる可能性があります。
コスト感応度が特に高い新興市場では、初期投資の高さが課題となる可能性があります。このような市場には、価格に敏感で、財源の限られた企業が存在する可能性があります。エネルギー効率に優れた肉盛溶接機器の値ごろ感は、意思決定プロセスにおいて極めて重要な要素となります。初期投資が高すぎると認識されれば、これらの地域での採用と市場成長の妨げになる可能性があります。
COVID-19影響分析
パンデミックにより、産業界は優先順位を見直し、当面の課題に対処するためにリソースを配分せざるを得なくなっています。企業が事業継続の確保、安全衛生対策の実施、財務の安定管理に集中したため、エネルギー効率の高い溶接プロジェクトや投資は優先順位が下がった可能性があります。この優先順位の変化は、市場の成長に影響を与えました。
既存の溶接インフラをエネルギー効率の高いソリューションで改修・アップグレードするには、現場での設置や試運転が必要になることが多いです。パンデミック(世界的大流行)に関連した制限や、旅行や物理的な交流の制限は、こうしたプロジェクトの延期につながっています。企業は改修計画を延期または保留し、エネルギー効率に優れた肉盛溶接技術の採用に影響を与えました。
目次
第1章 調査手法と調査範囲
第2章 定義と概要
第3章 エグゼクティブサマリー
第4章 市場力学
- 影響要因
- 促進要因
- エネルギーコストの増加
- 業務効率の重視
- 抑制要因
- 初期投資の高さ
- 機会
- 影響分析
- 促進要因
第5章 業界分析
- ポーターのファイブフォース分析
- サプライチェーン分析
- 価格分析
- 規制分析
第6章 COVID-19分析
第7章 用途別
- 機械の補修・メンテナンス
- 表面強化・保護
- コンポーネント修復
- カスタマイズ加工
第8章 エンドユーザー別
- 自動車
- 航空宇宙
- 製造
- 建設
- 石油・ガス
- その他
第9章 溶接プロセス別
- ガスメタルアーク溶接(GMAW)
- フラックス入りアーク溶接(FCAW)
- 被覆アーク溶接(SMAW)
- サブマージアーク溶接(SAW)
- レーザー溶接
第10章 地域別
- 北米
- 米国
- カナダ
- メキシコ
- 欧州
- ドイツ
- 英国
- フランス
- イタリア
- ロシア
- その他欧州
- 南米
- ブラジル
- アルゼンチン
- その他南米
- アジア太平洋
- 中国
- インド
- 日本
- オーストラリア
- その他アジア太平洋地域
- 中東・アフリカ
第11章 競合情勢
- 競合シナリオ
- 市況/シェア分析
- M&A分析
第12章 企業プロファイル
- Lincoln Electric Holdings, Inc.
- 会社概要
- 製品ポートフォリオと説明
- 財務概要
- 最近の動向
- ESAB
- Fronius International GmbH
- Miller Electric Manufacturing Co.
- Panasonic Corporation
- Kemppi Oy
- OTC Daihen Inc.
- Voestalpine AG
- ITW Welding(Illinois Tool Works Inc.)
- Voestalpine Bohler Welding GmbH
第13章 付録
Market Overview
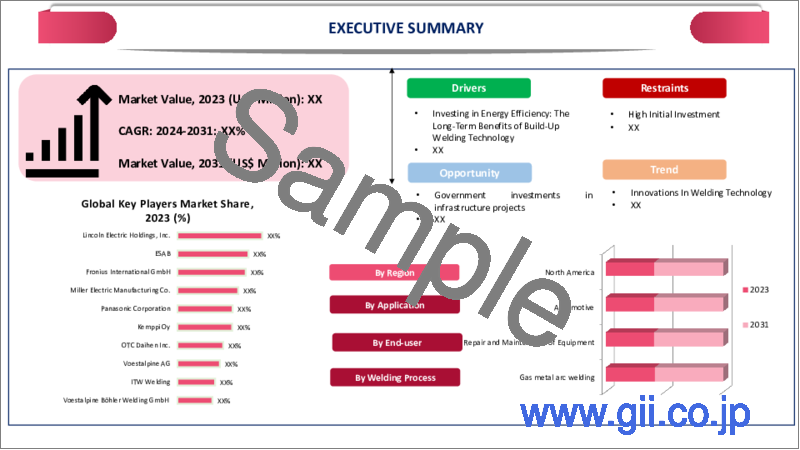
Global Energy-Efficient Build-Up Welding Market reached US$ 10.6 billion in 2022 and is expected to reach US$ 16.7 billion by 2030, growing with a CAGR of 5.8% during the forecast period 2023-2030. The global energy-efficient build-up welding market has witnessed significant growth in recent years due to increasing awareness about energy conservation, environmental sustainability, and the demand for efficient manufacturing processes. Energy-efficient build-up welding technologies are gaining prominence across various industries, including automotive, aerospace, manufacturing, construction, power generation, and oil and gas.
China's significant manufacturing capabilities, combined with the focus on energy conservation and sustainable practices, have propelled the growth of the energy-efficient build-up welding market. Manufacturers in China are investing in research and development, technology innovation, and collaborations to meet the growing demand for energy-efficient welding solutions. The adoption of these technologies is expected to continue growing in China and contribute to the global market expansion. Therefore, the China was accounting for nearly half of the regional shares.
Market Dynamics
Increasing Energy Costs
The increasing energy costs act as a catalyst for businesses to seek energy-efficient build-up welding solutions. Recent developments in the field have focused on improving process efficiency, incorporating cost-saving features, monitoring energy consumption, and adhering to efficiency standards.
By adopting these technologies, businesses can mitigate the impact of rising energy costs, reduce their environmental footprint, and improve their bottom line. As a result, the global energy-efficient build-up welding market continues to grow in response to the increasing demand for energy-saving solutions.
Focus on Operational Efficiency
Operational efficiency is closely tied to environmental sustainability. Energy-efficient build-up welding reduces energy consumption and lowers carbon emissions, contributing to sustainable manufacturing practices. Businesses that prioritize environmental sustainability benefit from improved brand reputation, compliance with environmental regulations, and access to markets that demand environmentally friendly products. The growing emphasis on sustainability drives the adoption of energy-efficient build-up welding solutions.
Compliance with environmental and energy efficiency regulations is a crucial factor for businesses operating in various industries. Energy-efficient build-up welding helps companies meet regulatory requirements and demonstrate their commitment to sustainable practices. The need to comply with regulations and standards related to energy efficiency drives the adoption of energy-efficient build-up welding technologies.
High Initial Investment
Companies have limited capital, and they must allocate it across various operational needs. When faced with multiple investment options, businesses may prioritize other areas over energy-efficient build-up welding equipment. This could include investments in core production machinery, expansion projects, or other immediate operational requirements. As a result, the allocation of funds to energy-efficient welding solutions may be deprioritized, hindering market growth.
High initial investment can pose challenges in emerging markets where cost sensitivity is particularly high. These markets may have businesses that are more price-sensitive and have limited financial resources. The affordability of energy-efficient build-up welding equipment becomes a crucial factor in the decision-making process. If the initial investment is perceived as too high, it can hinder adoption and market growth in these regions.
COVID-19 Impact Analysis
The pandemic forced industries to reassess their priorities and allocate resources to address immediate challenges. Energy-efficient build-up welding projects and investments may have been deprioritized as businesses focused on ensuring business continuity, implementing health and safety measures, and managing financial stability. This shift in priorities impacted the growth of the market.
Retrofitting and upgrading existing welding infrastructure with energy-efficient solutions often require on-site installation and commissioning. The pandemic-related restrictions and limitations on travel and physical interactions resulted in the postponement of such projects. Businesses delayed or put on hold retrofitting plans, affecting the adoption of energy-efficient build-up welding technologies.
Segment Analysis
The global energy-efficient build-up welding market is segmented based on application, end-user, welding process and region.
GMAW's High Efficiency and Productivity and Energy Efficiency Drives the Segmental Growth
GMAW is recognized for its energy efficiency compared to other welding processes. The use of a shielding gas, typically a mixture of argon and carbon dioxide, helps protect the weld pool and reduces the need for excessive heat input. This efficient use of energy contributes to cost savings and reduced environmental impact, making GMAW a preferred choice for energy-efficient build-up welding applications.
Therefore, the combination of high efficiency, productivity, energy savings, weld quality, and versatility has propelled GMAW to dominate the global energy-efficient build-up welding market. Its widespread adoption, technological advancements, and industry expertise make GMAW the preferred choice for many businesses looking to achieve energy efficiency in their welding operations.
Geographical Analysis
The introduction of Advanced Equipment and Focus on Research and Development Drives North America Energy-Efficient Build-Up Welding Market
North American manufacturers have been investing in research and development to drive innovation in energy-efficient build-up welding technologies. They collaborate with academic institutions, industry experts, and research organizations to develop new processes, materials, and techniques. This focus on R&D enables manufacturers to continually improve energy efficiency, reduce environmental impact, and meet the evolving needs of the market.
Furthermore, the growing focus on innovation, sustainability, collaboration, and the integration of advanced technologies have positioned North American manufacturers at the forefront of delivering energy-efficient welding solutions to meet the demands of diverse industries.
Competitive Landscape
The major global players include: Lincoln Electric Holdings, Inc., ESAB, Fronius International GmbH, Miller Electric Manufacturing Co., Panasonic Corporation, Kemppi Oy, OTC Daihen Inc., Voestalpine AG, ITW Welding (Illinois Tool Works Inc.) and Voestalpine Bohler Welding GmbH.
Why Purchase the Report?
- To visualize the global energy-efficient build-up welding market segmentation based on application, end-user, welding process and region, as well as understand key commercial assets and players.
- Identify commercial opportunities by analyzing trends and co-development.
- Excel data sheet with numerous data points of energy-efficient build-up welding market-level with all segments.
- PDF report consists of a comprehensive analysis after exhaustive qualitative interviews and an in-depth study.
- Product mapping available as Excel consisting of key products of all the major players.
The global energy-efficient build-up welding market report would provide approximately 61 tables, 63 figures and 201 Pages.
Target Audience 2023
- Manufacturers/ Buyers
- Industry Investors/Investment Bankers
- Research Professionals
- Emerging Companies
Table of Contents
1. Methodology and Scope
- 1.1. Research Methodology
- 1.2. Research Objective and Scope of the Report
2. Definition and Overview
3. Executive Summary
- 3.1. Snippet by Application
- 3.2. Snippet by End-User
- 3.3. Snippet by Welding Process
- 3.4. Snippet by Region
4. Dynamics
- 4.1. Impacting Factors
- 4.1.1. Drivers
- 4.1.1.1. Increasing Energy Costs
- 4.1.1.2. Focus on Operational Efficiency
- 4.1.2. Restraints
- 4.1.2.1. High Initial Investment
- 4.1.3. Opportunity
- 4.1.4. Impact Analysis
- 4.1.1. Drivers
5. Industry Analysis
- 5.1. Porter's Five Force Analysis
- 5.2. Supply Chain Analysis
- 5.3. Pricing Analysis
- 5.4. Regulatory Analysis
6. COVID-19 Analysis
- 6.1. Analysis of COVID-19
- 6.1.1. Scenario Before COVID
- 6.1.2. Scenario During COVID
- 6.1.3. Scenario Post COVID
- 6.2. Pricing Dynamics Amid COVID-19
- 6.3. Demand-Supply Spectrum
- 6.4. Government Initiatives Related to the Market During Pandemic
- 6.5. Manufacturers Strategic Initiatives
- 6.6. Conclusion
7. By Application
- 7.1. Introduction
- 7.1.1. Market Size Analysis and Y-o-Y Growth Analysis (%), By Application
- 7.1.2. Market Attractiveness Index, By Application
- 7.2. Repair and Maintenance of Equipment*
- 7.2.1. Introduction
- 7.2.2. Market Size Analysis and Y-o-Y Growth Analysis (%)
- 7.3. Surface Enhancement and Protection
- 7.4. Component Restoration
- 7.5. Customized Fabrication
8. By End-User
- 8.1. Introduction
- 8.1.1. Market Size Analysis and Y-o-Y Growth Analysis (%), By End-User
- 8.1.2. Market Attractiveness Index, By End-User
- 8.2. Automotive*
- 8.2.1. Introduction
- 8.2.2. Market Size Analysis and Y-o-Y Growth Analysis (%)
- 8.3. Aerospace
- 8.4. Manufacturing
- 8.5. Construction
- 8.6. Oil and Gas
- 8.7. Others
9. By Welding Process
- 9.1. Introduction
- 9.1.1. Market Size Analysis and Y-o-Y Growth Analysis (%), By Welding Process
- 9.1.2. Market Attractiveness Index, By Welding Process
- 9.2. Gas Metal Arc Welding (GMAW)*
- 9.2.1. Introduction
- 9.2.2. Market Size Analysis and Y-o-Y Growth Analysis (%)
- 9.3. Flux-Cored Arc Welding (FCAW)
- 9.4. Shielded Metal Arc Welding (SMAW)
- 9.5. Submerged Arc Welding (SAW)
- 9.6. Laser Welding
10. By Region
- 10.1. Introduction
- 10.1.1. Market Size Analysis and Y-o-Y Growth Analysis (%), By Region
- 10.1.2. Market Attractiveness Index, By Region
- 10.2. North America
- 10.2.1. Introduction
- 10.2.2. Key Region-Specific Dynamics
- 10.2.3. Market Size Analysis and Y-o-Y Growth Analysis (%), By Application
- 10.2.4. Market Size Analysis and Y-o-Y Growth Analysis (%), By End-User
- 10.2.5. Market Size Analysis and Y-o-Y Growth Analysis (%), By Welding Process
- 10.2.6. Market Size Analysis and Y-o-Y Growth Analysis (%), By Country
- 10.2.6.1. U.S.
- 10.2.6.2. Canada
- 10.2.6.3. Mexico
- 10.3. Europe
- 10.3.1. Introduction
- 10.3.2. Key Region-Specific Dynamics
- 10.3.3. Market Size Analysis and Y-o-Y Growth Analysis (%), By Application
- 10.3.4. Market Size Analysis and Y-o-Y Growth Analysis (%), By End-User
- 10.3.5. Market Size Analysis and Y-o-Y Growth Analysis (%), By Welding Process
- 10.3.6. Market Size Analysis and Y-o-Y Growth Analysis (%), By Country
- 10.3.6.1. Germany
- 10.3.6.2. UK
- 10.3.6.3. France
- 10.3.6.4. Italy
- 10.3.6.5. Russia
- 10.3.6.6. Rest of Europe
- 10.4. South America
- 10.4.1. Introduction
- 10.4.2. Key Region-Specific Dynamics
- 10.4.3. Market Size Analysis and Y-o-Y Growth Analysis (%), By Application
- 10.4.4. Market Size Analysis and Y-o-Y Growth Analysis (%), By End-User
- 10.4.5. Market Size Analysis and Y-o-Y Growth Analysis (%), By Welding Process
- 10.4.6. Market Size Analysis and Y-o-Y Growth Analysis (%), By Country
- 10.4.6.1. Brazil
- 10.4.6.2. Argentina
- 10.4.6.3. Rest of South America
- 10.5. Asia-Pacific
- 10.5.1. Introduction
- 10.5.2. Key Region-Specific Dynamics
- 10.5.3. Market Size Analysis and Y-o-Y Growth Analysis (%), By Application
- 10.5.4. Market Size Analysis and Y-o-Y Growth Analysis (%), By End-User
- 10.5.5. Market Size Analysis and Y-o-Y Growth Analysis (%), By Welding Process
- 10.5.6. Market Size Analysis and Y-o-Y Growth Analysis (%), By Country
- 10.5.6.1. China
- 10.5.6.2. India
- 10.5.6.3. Japan
- 10.5.6.4. Australia
- 10.5.6.5. Rest of Asia-Pacific
- 10.6. Middle East and Africa
- 10.6.1. Introduction
- 10.6.2. Key Region-Specific Dynamics
- 10.6.3. Market Size Analysis and Y-o-Y Growth Analysis (%), By Application
- 10.6.4. Market Size Analysis and Y-o-Y Growth Analysis (%), By End-User
- 10.6.5. Market Size Analysis and Y-o-Y Growth Analysis (%), By Welding Process
11. Competitive Landscape
- 11.1. Competitive Scenario
- 11.2. Market Positioning/Share Analysis
- 11.3. Mergers and Acquisitions Analysis
12. Company Profiles
- 12.1. Lincoln Electric Holdings, Inc.*
- 12.1.1. Company Overview
- 12.1.2. Product Portfolio and Description
- 12.1.3. Financial Overview
- 12.1.4. Recent Developments
- 12.2. ESAB
- 12.3. Fronius International GmbH
- 12.4. Miller Electric Manufacturing Co.
- 12.5. Panasonic Corporation
- 12.6. Kemppi Oy
- 12.7. OTC Daihen Inc.
- 12.8. Voestalpine AG
- 12.9. ITW Welding (Illinois Tool Works Inc.)
- 12.10. Voestalpine Bohler Welding GmbH
LIST NOT EXHAUSTIVE
13. Appendix
- 13.1. About Us and Services
- 13.2. Contact Us