|
|
市場調査レポート
商品コード
1290392
マヌカハニーの世界市場-2023-2030Global Manuka Honey Market - 2023-2030 |
||||||
|
|
|||||||
カスタマイズ可能
適宜更新あり
|
|||||||


| マヌカハニーの世界市場-2023-2030 |
|
出版日: 2023年06月12日
発行: DataM Intelligence
ページ情報: 英文 190 Pages
納期: 即日から翌営業日
|

- 全表示
- 概要
- 目次
市場概要
世界のマヌカハニー市場は、2022年に5億4,600万米ドルに達し、2030年には最大8億3,800万米ドルに達することで有利な成長を遂げると予測されています。同市場は、予測期間2023-2030年に5.5%のCAGRを示すと予想されています。
マクナハニーは、フェノール酸とフラボノイドを豊富に含む典型的な細胞強化剤として機能し、フルクトース、ミネラル、栄養素、ダスト、タンパク質などのサプリメントの作成にも利用されています。マヌカハニーを用いた治療法は、宿主と生体材料の融合を改善し、移植部位での瘢痕組織形成を軽減し、生体材料の移植に伴う患者の不快感を軽減する可能性があります。したがって、マヌカハニーの実現可能な使用は、マヌカハニー市場の成長を支援するはずです。
また、マヌカハニーは、食品、化粧品、パーソナルケアなど幅広い用途で使用することができます。マヌカハニーには、ビタミン、ミネラル、アミノ酸、栄養素が豊富に含まれており、肌に栄養を与え、再生させるのに役立ちます。ローション、クリーム、ファンデーション、マスカラなどの化粧品の製造に使用されており、これがマヌカハニー市場成長の大きな要因となっています。
市場力学
マヌカハニー市場は、健康上の利点別マヌカハニーの需要増加の結果、成長しています
マヌカハニーには、傷の治癒を早める、消化を促進する、喉の痛みを和らげる、胃潰瘍を防ぐ、ニキビを治療するなど、数多くの健康上の利点があります。マヌカハニーに関連する利点のため、より多くの人々がマヌカハニーを購入し、2023-2030年の予測期間中のマヌカハニー市場の成長を後押ししています。
例えば、世界のトップ輸出業者によると、天然ハチミツの売上高は2020年から2021年の間に23億8,000万米ドルから26億5,000万米ドルに上昇しました。したがって、マヌカハニーを含む天然ハチミツの需要と消費の高まりは、その生産を増加させ、それが市場の拡大に寄与し、予想される期間中のマヌカハニー市場の成長を促進します。
マヌカハニーの入手可能性が限られていることが、市場の成長を抑制しています
マヌカハニーの蜜は、ニュージーランドに唯一自生する植物、レプトスペルマム・スコパリウムから採取されます。マヌカハニー協会は、マヌカという植物自体が非常に珍しいと主張しています。マヌカは収穫が難しく、花も12日間しか咲かないため、メーカーはヘリコプターを利用してこのマヌカを集めなければなりません。そのため、マヌカは希少であり、さまざまなビジネスで大きな需要があるため、マヌカハニー市場の拡大を妨げているのです。
COVID-19の影響分析
COVID-19の分析では、COVID前シナリオ、COVIDシナリオ、COVID後シナリオに加え、価格力学(COVID前シナリオと比較したパンデミック中・後の価格変動を含む)、需要-供給スペクトラム(取引制限、監禁、その後の問題による需要と供給のシフト)、政府の取り組み(政府組織による市場、セクター、産業の活性化に関する取り組み)、メーカーの戦略的取り組み(メーカーはCOVID問題の軽減のために何を行ったか)についても解説します。
目次
第1章 調査手法と範囲
- 調査手法
- 調査目的および調査範囲
第2章 市場の定義と概要
第3章 エグゼクティブサマリー
- 市場内訳:タイプ別
- 市場内訳:性質別
- 市場内訳:製品タイプ別
- 市場内訳:アプリケーション別
- 市場内訳:流通チャネル別
- 市場内訳:地域別
第4章 市場力学
- 市場影響因子
- 促進要因
- 抑制要因
- 機会
- 影響分析
第5章 産業分析
- ポーターのファイブフォース分析
- サプライチェーン分析
- 価格分析
- 法規制の分析
第6章 COVID-19の分析
第7章 タイプ別
- 生マヌカハニー
- 加工マヌカハニー
第8章 製品タイプ別
- UMF 5+マヌカハニー
- UMF 10+マヌカハニー
- UMF15+マヌカハニー
- その他
第9章 自然由来
- オーガニック
- 従来型
第10章 用途別
- 飲食品
- 飼料
- 栄養補助食品
- その他
第11章 流通チャネル別
- スーパーマーケット、ハイパーマーケット
- コンビニエンスストア
- オンラインストア
- その他
第12章 地域別
- 北米
- 米国
- カナダ
- メキシコ
- 欧州
- ドイツ
- 英国
- フランス
- イタリア
- スペイン
- その他欧州
- 南米
- ブラジル
- アルゼンチン
- その他南米地域
- アジア太平洋地域
- 中国
- インド
- 日本
- オーストラリア
- その他アジア太平洋地域
- 中東・アフリカ地域
第13章 競合情勢
- 競合シナリオ
- 市況ポジショニング/シェア分析
- M&A(合併・買収)分析
第14章 企業プロファイル
- Comvita
- 会社概要
- 製品ポートフォリオと説明
- 財務概要
- 主な発展状況
- Watson & Son
- Manuka Health
- Pure Honey New Zealand
- Arataki Honey
- Streamland
- Ora Honey
- Capilano
- Nature's Way
- Triniton Australia PTY LTD
第15章 付録
Market Overview
The global manuka honey market reached US$ 546 million in 2022 and is projected to witness lucrative growth by reaching up to US$ 838 million by 2030. The market is expected to exhibit a CAGR of 5.5% during the forecast period 2023-2030.
Makuna honey serves as a typical cell reinforcement that is rich in phenolic acids and flavonoids and is also utilized in the creation of supplements like fructose, minerals, nutrients, dust and proteins. Manuka honey-based treatments have the potential to improve host-biomaterial fusion, lessen scar tissue formation at the site of implantation, and lessen patient discomfort associated with biomaterial implantation. Hence, the feasible use of manuka honey ought to assist in the manuka honey market growth.
Manuka honey can also be used in a wide range of applications, including food, cosmetics, and personal care. Manuka honey is also a rich source of vitamins, minerals, amino acids, and nutrients that aid in nourishing and regenerating the skin. It is used to manufacture cosmetic products including lotions, creams, foundations, mascara and other cosmetics, which has been a significant factor in manuka honey market growth.
Market Dynamics
The Manuka Honey Market is Growing as a Result of Rising Demand for Manuka Honey Due to its Health Benefits.
The numerous health advantages of manuka honey, including its ability to speed up wound healing, enhance digestion, soothe sore throats, prevent gastric ulcers, and treat acne. Because of the advantages linked with manuka honey, more people are buying it, which boosts the manuka honey market growth during the forecast period of 2023-2030.
For instance, natural honey sales climbed from 2.38 USD billion to 2.65 USD billion between 2020 and 2021, according to the top exporters in the globe. Therefore, the rising demand for and consumption of natural honey-which includes manuka honey-increases its production, which in turn contributes to the market's expansion and drives manuka honey market growth during the anticipated period.
The Limited Availability of Manuka Honey is Restraining the Market Growth.
The nectar for manuka honey comes from Leptospermum scoparium, the only native plant to New Zealand. The Manuka Factor Honey Association claims that the manuka plant itself is quite uncommon. Manufacturers must utilize helicopters to collect this manuka since it is tough to harvest and the bloom only lasts for 12 days. Manuka is therefore scarce and in great demand across a range of businesses, which is impeding the expansion of the manuka honey market.
COVID-19 Impact Analysis
The COVID-19 Analysis includes Pre-COVID Scenario, COVID Scenario and Post-COVID Scenario along with Pricing Dynamics (Including pricing change during and post-pandemic comparing it with pre-COVID scenarios), Demand-Supply Spectrum (Shift in demand and supply owing to trading restrictions, lockdown, and subsequent issues), Government Initiatives (Initiatives to revive market, sector or Industry by Government Bodies) and Manufacturers Strategic Initiatives (What manufacturers did to mitigate the COVID issues will be covered here).
Segment Analysis
The global manuka honey market is segmented based on type, nature, product type, application, distribution channel and region.
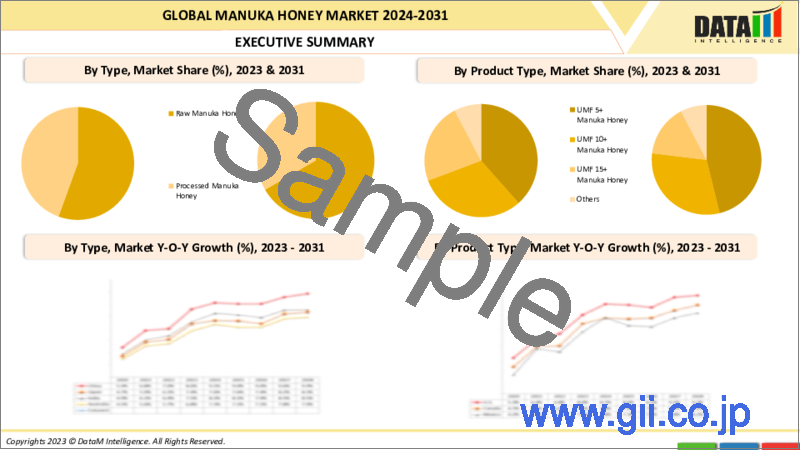
In the Global Market of Manuka Honey, the UMF 5 + Makuna Honey Product Type Holds the Largest Market Share.
The global manuka honey market has been segmented by product type into umf 5 + makuna honey, umf 10 + makuna honey, umf 15 + makuna honey and others . The UMF 5 + makuna honey segment held the largest manuka honey market share of 64.6% in 2022 in the manuka honey market analysis report.
This is due to the fact this kind is one of the most popular varieties of manuka honey on the market and is used every day in every country. It offers many benefits, including stronger healing abilities and an improvement in natural immunity so you can stay safe every day.
According to USDA, it is found that regular manuka honey consumption may lessen the signs and symptoms of IBS. Additionally, since this kind of honey increases antioxidant levels and lowers inflammation, a form of IBD or irritable bowel disease, those who suffer from IBS and ulcerative colitis may gain from using it.
Geographical Analysis
The North America Held the Largest Share of Manuka Honey Market.
The North American manuka honey market held the largest market share of 45.4% in 2022 in the manuka honey market analysis. The preference of American consumers for pure foods with a high nutritional value significantly contributes to the manuka honey market growth.
In addition, the majority of home applications employ manuka honey as an ingredient. As a result, the market in this region has been growing as a result of the increased use of manuka honey in several applications such as food and beverage, cosmetics and so on, which is a key factor in driving the manuka honey market growth in the region.
Competitive Landscape
The major global players in the market include: Comvita, Watson & Son, Manuka Health, Pure Honey New Zealand, Arataki Honey, Streamland, Ora Honey, Capilano, Nature's Way and Triniton Australia PTY LTD.
Global Recession/Ukraine-Russia War/COVID-19 and Artificial Intelligence Impact Analysis:
COVID-19 Impact:
The COVID-19 outbreak benefited the sale of manuka honey. This came about when customers became more conscious about their health. Because of the reduction in commercial, industrial and transportation activity as well as the general lockdown brought about by the Covid epidemic, the air quality also significantly improved, which in turn improved the quality of life for honeybees and goods created with manuka honey.
However, the COVID-19 pandemic has brought to light every shortcoming in the beekeeping industry, including the value of bee products as immune boosters and antiviral drugs and the negative effects that human activity has on the well-being and survival of bees. During this time, manuka honey also supports consumers' immune systems by boosting them.
Why Purchase the Report?
- To visualize the global manuka honey market segmentation based on type, nature, product type, application, distribution channel and region, as well as understand key commercial assets and players.
- Identify commercial opportunities in the market by analyzing trends and co-development.
- Excel data sheet with numerous data points of manuka honey market-level with all segments.
- The PDF report consists of a cogently put-together market analysis after exhaustive qualitative interviews and an in-depth market study.
- Product mapping is available as Excel consists of key products of all the major market players.
The Global Manuka Honey Market Report Would Provide Approximately 93 Tables, 109 Figures and 190 pages.
Target Audience 2023
- Manufacturers / Buyers
- Industry Investors/Investment Bankers
- Research Professionals
- Emerging Companies
Table of Contents
1. Methodology and Scope
- 1.1. Research Methodology
- 1.2. Research Objective and Scope of the Report
2. Market Definition and Overview
3. Executive Summary
- 3.1. Market Snippet, by Type
- 3.2. Market Snippet, by Nature
- 3.3. Market Snippet, by Product Type
- 3.4. Market Snippet, by Application
- 3.5. Market Snippet, by Distribution Channel
- 3.6. Market Snippet, by Region
4. Market Dynamics
- 4.1. Market Impacting Factors
- 4.1.1. Drivers
- 4.1.2. Restraints
- 4.1.3. Opportunity
- 4.1.4. Impact Analysis
5. Industry Analysis
- 5.1. Porter's Five Force Analysis
- 5.2. Supply Chain Analysis
- 5.3. Pricing Analysis
- 5.4. Regulatory Analysis
6. COVID-19 Analysis
- 6.1. Analysis of COVID-19 on the Market
- 6.1.1. Market Scenario Before COVID-19
- 6.1.2. Market Scenario During COVID-19
- 6.1.3. Market Scenario After COVID-19
- 6.2. Pricing Dynamics Amid COVID-19
- 6.3. Demand-Supply Spectrum
- 6.4. Government Initiatives Related to the Market During the Pandemic
- 6.5. Manufacturers' Strategic Initiatives
- 6.6. Conclusion
7. By Type
- 7.1. Introduction
- 7.1.1. Market Size Analysis and Y-o-Y Growth Analysis (%), By Type
- 7.1.2. Market Attractiveness Index, By Type
- 7.2. Raw Manuka Honey*
- 7.2.1.1. Introduction
- 7.2.1.2. Market Size Analysis and Y-o-Y Growth Analysis (%)
- 7.3. Processed Manuka Honey
8. By Product Type
- 8.1. Introduction
- 8.1.1. Market Size Analysis and Y-o-Y Growth Analysis (%), By Product Type
- 8.1.2. Market Attractiveness Index, By Product Type
- 8.2. UMF 5+ Manuka Honey*
- 8.2.1. Introduction
- 8.2.2. Market Size Analysis and Y-o-Y Growth Analysis (%)
- 8.3. UMF 10+ Manuka Honey
- 8.4. UMF 15+ Manuka Honey
- 8.5. Others
9. By Nature
- 9.1. Introduction
- 9.1.1. Market Size Analysis and Y-o-Y Growth Analysis (%), By Nature
- 9.1.2. Market Attractiveness Index, By Nature
- 9.2. Organic*
- 9.2.1. Introduction
- 9.2.2. Market Size Analysis and Y-o-Y Growth Analysis (%)
- 9.3. Conventional
10. By Application
- 10.1. Introduction
- 10.1.1. Market Size Analysis and Y-o-Y Growth Analysis (%), By Application
- 10.1.2. Market Attractiveness Index, By Application
- 10.2. Food and Beverages*
- 10.2.1. Introduction
- 10.2.2. Market Size Analysis and Y-o-Y Growth Analysis (%)
- 10.3. Feed
- 10.4. Nutritional Supplements
- 10.5. Others
11. By Distribution Channel
- 11.1. Introduction
- 11.1.1. Market Size Analysis and Y-o-Y Growth Analysis (%), By Distribution Channel
- 11.1.2. Market Attractiveness Index, By Distribution Channel
- 11.2. Supermarkets and Hypermarkets*
- 11.2.1. Introduction
- 11.2.2. Market Size Analysis and Y-o-Y Growth Analysis (%)
- 11.3. Convenience Stores
- 11.4. Online Stores
- 11.5. Others
12. By Region
- 12.1. Introduction
- 12.1.1. Market Size Analysis and Y-o-Y Growth Analysis (%), By Region
- 12.1.2. Market Attractiveness Index, By Region
- 12.2. North America
- 12.2.1. Introduction
- 12.2.2. Key Region-Specific Dynamics
- 12.2.3. Market Size Analysis and Y-o-Y Growth Analysis (%), By Type
- 12.2.4. Market Size Analysis and Y-o-Y Growth Analysis (%), By Nature
- 12.2.5. Market Size Analysis and Y-o-Y Growth Analysis (%), By Product Type
- 12.2.6. Market Size Analysis and Y-o-Y Growth Analysis (%), By Application
- 12.2.7. Market Size Analysis and Y-o-Y Growth Analysis (%), By Distribution Channel
- 12.2.8.
- 12.2.9. Market Size Analysis and Y-o-Y Growth Analysis (%), By Country
- 12.2.9.1. The U.S.
- 12.2.9.2. Canada
- 12.2.9.3. Mexico
- 12.3. Europe
- 12.3.1. Introduction
- 12.3.2. Key Region-Specific Dynamics
- 12.3.3. Market Size Analysis and Y-o-Y Growth Analysis (%), By Type
- 12.3.4. Market Size Analysis and Y-o-Y Growth Analysis (%), By Nature
- 12.3.5. Market Size Analysis and Y-o-Y Growth Analysis (%), By Product Type
- 12.3.6. Market Size Analysis and Y-o-Y Growth Analysis (%), By Application
- 12.3.7. Market Size Analysis and Y-o-Y Growth Analysis (%), By Distribution Channel
- 12.3.8. Market Size Analysis and Y-o-Y Growth Analysis (%), By Country
- 12.3.8.1. Germany
- 12.3.8.2. The U.K.
- 12.3.8.3. France
- 12.3.8.4. Italy
- 12.3.8.5. Spain
- 12.3.8.6. Rest of Europe
- 12.4. South America
- 12.4.1. Introduction
- 12.4.2. Key Region-Specific Dynamics
- 12.4.3. Market Size Analysis and Y-o-Y Growth Analysis (%), By Type
- 12.4.4. Market Size Analysis and Y-o-Y Growth Analysis (%), By Nature
- 12.4.5. Market Size Analysis and Y-o-Y Growth Analysis (%), By Product Type
- 12.4.6. Market Size Analysis and Y-o-Y Growth Analysis (%), By Application
- 12.4.7. Market Size Analysis and Y-o-Y Growth Analysis (%), By Distribution Channel
- 12.4.8. Market Size Analysis and Y-o-Y Growth Analysis (%), By Country
- 12.4.8.1. Brazil
- 12.4.8.2. Argentina
- 12.4.8.3. Rest of South America
- 12.5. Asia-Pacific
- 12.5.1. Introduction
- 12.5.2. Key Region-Specific Dynamics
- 12.5.3. Market Size Analysis and Y-o-Y Growth Analysis (%), By Type
- 12.5.4. Market Size Analysis and Y-o-Y Growth Analysis (%), By Nature
- 12.5.5. Market Size Analysis and Y-o-Y Growth Analysis (%), By Product Type
- 12.5.6. Market Size Analysis and Y-o-Y Growth Analysis (%), By Application
- 12.5.7. Market Size Analysis and Y-o-Y Growth Analysis (%), By Distribution Channel
- 12.5.8. Market Size Analysis and Y-o-Y Growth Analysis (%), By Country
- 12.5.8.1. China
- 12.5.8.2. India
- 12.5.8.3. Japan
- 12.5.8.4. Australia
- 12.5.8.5. Rest of Asia-Pacific
- 12.6. Middle East and Africa
- 12.6.1. Introduction
- 12.6.2. Key Region-Specific Dynamics
- 12.6.3. Market Size Analysis and Y-o-Y Growth Analysis (%), By Type
- 12.6.4. Market Size Analysis and Y-o-Y Growth Analysis (%), By Nature
- 12.6.5. Market Size Analysis and Y-o-Y Growth Analysis (%), By Product Type
- 12.6.6. Market Size Analysis and Y-o-Y Growth Analysis (%), By Application
- 12.6.7. Market Size Analysis and Y-o-Y Growth Analysis (%), By Distribution Channel
13. Competitive Landscape
- 13.1. Competitive Scenario
- 13.2. Market Positioning/Share Analysis
- 13.3. Mergers and Acquisitions Analysis
14. Company Profiles
- 14.1. Comvita
- 14.1.1. Company Overview
- 14.1.2. Product Portfolio and Description
- 14.1.3. Financial Overview
- 14.1.4. Key Developments
- 14.2. Watson & Son
- 14.3. Manuka Health
- 14.4. Pure Honey New Zealand
- 14.5. Arataki Honey
- 14.6. Streamland
- 14.7. Ora Honey
- 14.8. Capilano
- 14.9. Nature's Way
- 14.10. Triniton Australia PTY LTD
LIST NOT EXHAUSTIVE
15. Appendix
- 15.1. About Us and Services
- 15.2. Contact Us