|
|
市場調査レポート
商品コード
1268949
トーイングトラクターの世界市場-2023-2030Global Tow Tractors Market - 2023-2030 |
||||||
|
|
|||||||
|
● お客様のご希望に応じて、既存データの加工や未掲載情報(例:国別セグメント)の追加などの対応が可能です。 詳細はお問い合わせください。 |
|||||||


| トーイングトラクターの世界市場-2023-2030 |
|
出版日: 2023年05月02日
発行: DataM Intelligence
ページ情報: 英文 195 Pages
納期: 約2営業日
|
- 全表示
- 概要
- 目次
市場概要
世界のトーイングトラクター市場は、2022年に34億120万米ドルに達し、2030年には51億20万米ドルに達すると予測されます。同市場は予測期間中(2023年~2030年)に5.2%のCAGRを示すと予想されています。
トーイングトラクターは、独創的でインテリジェントなロボット技術により、より一般的になってきています。電気式トーイングトラクターは、燃料式トーイングトラクターと比較して有利な収益を得ることが期待されます。電気式トーイングトラクターの価値は、2022年に27億9,610万米ドルで、2030年には40億3,050万米ドルに達すると予想されます。
市場力学
都市化の進展と一人当たりの可処分所得の増加が市場拡大の原動力となっています。
経済分析局による予測によると、2022年11月の個人所得は801億米ドル(0.4%)増加しました。個人消費支出(PCE)は198億米ドル増加し、可処分個人所得(DPI)は686億米ドル価格指数に0.1%上乗せされたことで、自動車業界の売上が増加する見通しです。
トーイングトラクターの高コストが市場成長の妨げになっています。
自動運転車(AV)が二酸化炭素排出量と石油消費量を削減する可能性は、広く認知されつつあります。これは、効率性の向上、経路の改善、交通渋滞の減少、最先端技術の促進によるものです。しかし、このような車両は、各機能に高度な技術が使用されているため、コストが非常に高いです。
COVID-19の影響分析
COVID-19の影響は、世界中の様々な規制機関によって実施された社会的距離を置く措置により、牽引車市場の成長に差し迫った影響を残すと予想されます。さらに、サプライチェーンにおける様々な混乱が、牽引車市場の成長に影響を及ぼすと予想されました。例えば、大規模な牽引車メーカーは、大人数の移動や集会に制限を課されたため、操業停止を余儀なくされました。
人工知能の影響分析
労働者の必要性を減らすための人工知能搭載車に対する消費者の需要の増加が、トーイングトラクターの市場成長を後押ししています。例えば、2022年9月、Fusion ProcessingとBradshaw Electric Vehiclesは、英国政府のイノベーション機関であるInnovate UKから、完全自律型の電動無人トーイングトラクターを開発するための資金提供を受けた。
目次
第1章 調査手法とスコープ
- 調査手法
- 調査目的および調査範囲について
第2章 定義と概要
第3章 エグゼクティブサマリー
- 製品タイプ別スニペット
- 負荷容量別スニペット
- 電源別スニペット
- アプリケーション別スニペット
- 地域別スニペット
第4章 市場力学
- 影響要因
- 促進要因
- 抑制要因
- 機会
- 影響度分析
第5章 産業分析
- ポーターのファイブフォース分析
- サプライチェーン分析
- 価格分析
- 規制分析
第6章 COVID-19の分析
- COVID-19の解析について
- COVID-19シナリオ前
- 現在のCOVID-19シナリオ
- ポストCOVID-19または将来シナリオ
- COVID-19 の中での価格ダイナミクス
- 需給スペクトル
- パンデミック時の市場に関連する政府の取り組み
- メーカーの戦略的な取り組み
- 結論
第7章 製品タイプ別
- 歩行者用トーイングトラクター
- スタンドイントーイングトラクター
- ライダーシーテッドトーイングトラクター
第8章 負荷容量別
- ライトデューティトーイングトラクター
- ミディアムデューティトーイングトラクター
- ヘビーデューティトーイングトラクター
第9章 電源別
- 電気
- 燃料
第10章 アプリケーション別
- 鉄道駅
- 空港
- 倉庫
- その他
第11章 地域別
- 北米
- 米国
- カナダ
- メキシコ
- 欧州
- ドイツ
- 英国
- フランス
- イタリア
- スペイン
- その他欧州
- 南米
- ブラジル
- アルゼンチン
- その他南米地域
- アジア太平洋地域
- 中国
- インド
- 日本
- オーストラリア
- その他アジア太平洋地域
- 中東・アフリカ地域
第12章 競合情勢
- 競合シナリオ
- 市況分析・シェア分析
- M&A分析
第13章 企業プロファイル
- Jungheinrich AG
- 会社概要
- グレードのポートフォリオと説明
- 財務概要
- 主な展開
- Toyota Material Handling
- Bradshaw Electric Vehicles
- Polaris Industries, Inc.
- Hyster-Yale Group, Inc.
- Linde Material Handling
- Motrec International Inc.
- The Raymond Corporation
- JBT
- Godrej Material Handling
第14章 付録
Market Overview
The global tow tractors market reached US$ 3,401.2 million in 2022 and is projected to witness lucrative growth by reaching up to US$ 5,100.2 million by 2030. The market is expected to exhibit a CAGR of 5.2% during the forecast period (2023-2030).
Tow tractors are becoming more popular due to inventive and intelligent robotic technology. Partnering with French robotics expert Balyo, Hyster Europe, a provider of empty container handling solutions, intends to showcase intelligent robotics in two tractors. The electric tow tractors are expected to gain lucrative revenue compared to fuel tow tractors. The value of electric tow tractors was US$ 2,796.1 million in 2022 and is expected to reach US$ 4,030.5 million in 2030.
Market Dynamics
Rising urbanization and rising per capita disposable income are driving market expansion.
According to projections made by the Bureau of Economic Analysis, personal income increased by US$ 80.1 billion (0.4%) in November 2022. Personal consumption expenditures (PCE) increased by US$ 19.8 billion and disposable personal income (DPI) increased by US$ 68.6 billion (0.4 percent) (0.1 percent). 0.1 percent more was added to the PCE price index, which will increase the sales in the automobile industry.
The high cost of tow tractors is hampering the market growth.
The potential of automated vehicles (AVs) to reduce carbon dioxide emissions and petroleum consumption is becoming more widely acknowledged. This is due to increased efficiency, better routing, less traffic congestion, and the facilitation of cutting-edge technologies. However, the cost of such vehicles is very high due to the advanced technology used for each feature.
COVID-19 Impact Analysis
The COVID-19 impact is expected to leave a pressing impact on the tow tractors market growth, owing to the social distancing measures implemented by various regulatory bodies across the globe. Moreover, various disruptions in the supply chains were anticipated to affect the growth of the tow tractors market. For example, large tow truck manufacturers were forced to shut down due to the imposed restrictions on the movement and gathering of large groups of people.
Artificial Intelligence Impact Analysis
An increase in the consumer demand for artificial intelligent vehicles to reduce the need for labors boost the market growth of tow tractors. For instance, in September 2022, Fusion Processing and Bradshaw Electric Vehicles were granted funding by Innovate UK, the UK government's innovation agency, to develop fully autonomous, electric, unmanned tow tractors.
Segment Analysis
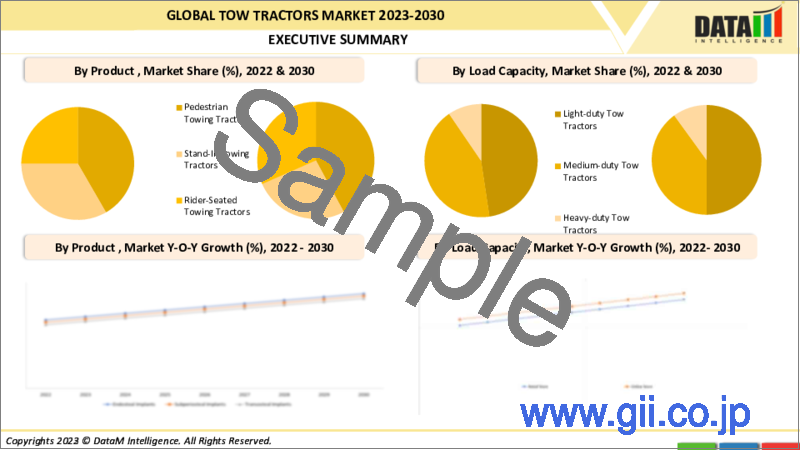
The global tow tractors market is segmented based on product type, load capacity, power source, application and region.
Increase in the product launches of rider-seated towing tractors
Tow tractors have been segmented by product type as pedestrian towing tractors, stand-in towing tractors, and rider-seated towing tractors.
The global tow tractor market value for rider-seated towing tractors segment is likely to reach approximately 2,184.76 US$ million in 2030, from its recorded value of approximately 1,442.92 US$ million in 2022, growing with a CAGR of 5.3% during the forecast period (2023 to 2030). The rider-seated towing tractor segment held a significant market share due to the increase in the adoption of these types of tractors in factories and big industries for transporting heavy loads from one place to another within the factory.
Geographical Analysis
Increase in the major key players' focus on the tow tractors in the region
By region, the global tow tractors market is segmented into North America, South America, Europe, Asia-Pacific, Middle East and Africa.
The North America tow tractors market was valued at US$ 1,285.6 million in 2022 and is projected to grow at a CAGR of 5.2% over the forecast period to reach US$ 1,928.7 million by 2030. North America held the largest market share due to the rise in awareness about the benefits of tow tractors such as efficient and accurate working along with the increase in the industrial area operations in the region. In addition, the high labor cost is another factor responsible for the region's increased demand for tow tractors. Furthermore, factors such as expansion of the railway sector and expansions of supermarkets in developed countries such as the United States and Canada drive tow tractors growth in the region.
Competitive Landscape
The major global players include: Jungheinrich AG, Toyota Material Handling, Bradshaw Electric Vehicles Polaris Industries, Inc., Hyster-Yale Group, Inc., Linde Material Handling, Motrec International Inc., The Raymond Corporation, JBT, and Godrej Material Handling.
Why Purchase the Report?
- To visualize the global tow tractors market segmentation based on product type, load capacity, power source, application and region, as well as understand key commercial assets and players.
- Identify commercial opportunities by analyzing trends and co-development.
- Excel data sheet with numerous data points of Tow Tractors market-level with all segments.
- PDF report consists of a comprehensive analysis after exhaustive qualitative interviews and an in-depth study.
- Product mapping available as Excel consisting of key products of all the major players.
The global tow tractors market report would provide approximately 69 tables, 64 figures and 195 pages.
Target Audience 2023
- Manufacturers/ Buyers
- Industry Investors/Investment Bankers
- Research Professionals
- Emerging Companies
Table of Contents
1. Methodology and Scope
- 1.1. Research Methodology
- 1.2. Research Objective and Scope of the Report
2. Definition and Overview
3. Executive Summary
- 3.1. Snippet by Product Type
- 3.2. Snippet by Load Capacity
- 3.3. Snippet by Power Source
- 3.4. Snippet by Application
- 3.5. Snippet by Region
4. Dynamics
- 4.1. Impacting Factors
- 4.1.1. Drivers
- 4.1.2. Restraints
- 4.1.3. Opportunity
- 4.1.4. Impact Analysis
5. Industry Analysis
- 5.1. Porter's Five Forces Analysis
- 5.2. Supply Chain Analysis
- 5.3. Pricing Analysis
- 5.4. Regulatory Analysis
6. COVID-19 Analysis
- 6.1. Analysis of COVID-19
- 6.1.1. Before COVID-19 Scenario
- 6.1.2. Present COVID-19 Scenario
- 6.1.3. Post COVID-19 or Future Scenario
- 6.2. Pricing Dynamics Amid COVID-19
- 6.3. Demand-Supply Spectrum
- 6.4. Government Initiatives Related to the Market During Pandemic
- 6.5. Manufacturers Strategic Initiatives
- 6.6. Conclusion
7. By Product Type
- 7.1. Introduction
- 7.1.1. Market Size Analysis and Y-o-Y Growth Analysis (%), By Product Type
- 7.1.2. Market Attractiveness Index, By Product Type
- 7.2. Pedestrian Towing Tractors*
- 7.2.1. Introduction
- 7.2.2. Market Size Analysis and Y-o-Y Growth Analysis (%)
- 7.3. Stand-In Towing Tractors
- 7.4. Rider-Seated Towing Tractors
8. By Load Capacity
- 8.1. Introduction
- 8.1.1. Market Size Analysis and Y-o-Y Growth Analysis (%), By Load Capacity
- 8.1.2. Market Attractiveness Index, By Load Capacity
- 8.2. Light-duty Tow Tractors*
- 8.2.1. Introduction
- 8.2.2. Market Size Analysis and Y-o-Y Growth Analysis (%)
- 8.3. Medium-duty Tow Tractors
- 8.4. Heavy-duty Tow Tractors
9. By Power Source
- 9.1. Introduction
- 9.1.1. Market Size Analysis and Y-o-Y Growth Analysis (%), By Power Source
- 9.1.2. Market Attractiveness Index, By Power Source
- 9.2. Electric*
- 9.2.1. Introduction
- 9.2.2. Market Size Analysis and Y-o-Y Growth Analysis (%)
- 9.3. Fuel
10. By Application
- 10.1. Introduction
- 10.1.1. Market Size Analysis and Y-o-Y Growth Analysis (%), By Application
- 10.1.2. Market Attractiveness Index, By Application
- 10.2. Railway Stations*
- 10.2.1. Introduction
- 10.2.2. Market Size Analysis and Y-o-Y Growth Analysis (%)
- 10.3. Airports
- 10.4. Warehouses
- 10.5. Others
11. By Region
- 11.1. Introduction
- 11.1.1. Market Size Analysis and Y-o-Y Growth Analysis (%), By Region
- 11.1.2. Market Attractiveness Index, By Region
- 11.2. North America
- 11.2.1. Introduction
- 11.2.2. Key Region-Specific Dynamics
- 11.2.3. Market Size Analysis and Y-o-Y Growth Analysis (%), By Product Type
- 11.2.4. Market Size Analysis and Y-o-Y Growth Analysis (%), By Load Capacity
- 11.2.5. Market Size Analysis and Y-o-Y Growth Analysis (%), By Power Source
- 11.2.6. Market Size Analysis and Y-o-Y Growth Analysis (%), By Application
- 11.2.7. Market Size Analysis and Y-o-Y Growth Analysis (%), By Country
- 11.2.7.1. The U.S.
- 11.2.7.2. Canada
- 11.2.7.3. Mexico
- 11.3. Europe
- 11.3.1. Introduction
- 11.3.2. Key Region-Specific Dynamics
- 11.3.3. Market Size Analysis and Y-o-Y Growth Analysis (%), By Product Type
- 11.3.4. Market Size Analysis and Y-o-Y Growth Analysis (%), By Load Capacity
- 11.3.5. Market Size Analysis and Y-o-Y Growth Analysis (%), By Power Source
- 11.3.6. Market Size Analysis and Y-o-Y Growth Analysis (%), By Application
- 11.3.7. Market Size Analysis and Y-o-Y Growth Analysis (%), By Country
- 11.3.7.1. Germany
- 11.3.7.2. The U.K.
- 11.3.7.3. France
- 11.3.7.4. Italy
- 11.3.7.5. Spain
- 11.3.7.6. Rest of Europe
- 11.4. South America
- 11.4.1. Introduction
- 11.4.2. Key Region-Specific Dynamics
- 11.4.3. Market Size Analysis and Y-o-Y Growth Analysis (%), By Product Type
- 11.4.4. Market Size Analysis and Y-o-Y Growth Analysis (%), By Load Capacity
- 11.4.5. Market Size Analysis and Y-o-Y Growth Analysis (%), By Power Source
- 11.4.6. Market Size Analysis and Y-o-Y Growth Analysis (%), By Application
- 11.4.7. Market Size Analysis and Y-o-Y Growth Analysis (%), By Country
- 11.4.7.1. Brazil
- 11.4.7.2. Argentina
- 11.4.7.3. Rest of South America
- 11.5. Asia-Pacific
- 11.5.1. Introduction
- 11.5.2. Key Region-Specific Dynamics
- 11.5.3. Market Size Analysis and Y-o-Y Growth Analysis (%), By Product Type
- 11.5.4. Market Size Analysis and Y-o-Y Growth Analysis (%), By Load Capacity
- 11.5.5. Market Size Analysis and Y-o-Y Growth Analysis (%), By Power Source
- 11.5.6. Market Size Analysis and Y-o-Y Growth Analysis (%), By Application
- 11.5.7. Market Size Analysis and Y-o-Y Growth Analysis (%), By Country
- 11.5.7.1. China
- 11.5.7.2. India
- 11.5.7.3. Japan
- 11.5.7.4. Australia
- 11.5.7.5. Rest of Asia-Pacific
- 11.6. Middle East and Africa
- 11.6.1. Introduction
- 11.6.2. Key Region-Specific Dynamics
- 11.6.3. Market Size Analysis and Y-o-Y Growth Analysis (%), By Product Type
- 11.6.4. Market Size Analysis and Y-o-Y Growth Analysis (%), By Load Capacity
- 11.6.5. Market Size Analysis and Y-o-Y Growth Analysis (%), By Power Source
- 11.6.6. Market Size Analysis and Y-o-Y Growth Analysis (%), By Application
12. Competitive Landscape
- 12.1. Competitive Scenario
- 12.2. Market Positioning/Share Analysis
- 12.3. Mergers and Acquisitions Analysis
13. Company Profiles
- 13.1. Jungheinrich AG*
- 13.1.1. Company Overview
- 13.1.2. Grade Portfolio and Description
- 13.1.3. Financial Overview
- 13.1.4. Key Developments
- 13.2. Toyota Material Handling
- 13.3. Bradshaw Electric Vehicles
- 13.4. Polaris Industries, Inc.
- 13.5. Hyster-Yale Group, Inc.
- 13.6. Linde Material Handling
- 13.7. Motrec International Inc.
- 13.8. The Raymond Corporation
- 13.9. JBT
- 13.10. Godrej Material Handling
LIST NOT EXHAUSTIVE
14. Appendix
- 14.1. About Us and Services
- 14.2. Contact Us