|
|
市場調査レポート
商品コード
1290419
クラウドの世界市場-2023-2030Global Cloud Market - 2023-2030 |
||||||
|
|
|||||||
|
● お客様のご希望に応じて、既存データの加工や未掲載情報(例:国別セグメント)の追加などの対応が可能です。 詳細はお問い合わせください。 |
|||||||


| クラウドの世界市場-2023-2030 |
|
出版日: 2023年06月12日
発行: DataM Intelligence
ページ情報: 英文 204 Pages
納期: 約2営業日
|
- 全表示
- 概要
- 目次
市場概要
世界のクラウド市場は、2022年に約3,730億米ドルに達し、2030年には最大2,020億米ドルに達することで有利な成長を遂げると予測されています。また、2023-2030年の予測期間には、CAGR23.9%で成長する見込みです。
インターネットを通じて、サーバー、ストレージ、アプリケーション、サービスなどのコンピューティングリソースにオンデマンドでアクセスできるようにする手法を、クラウドコンピューティングと呼びます。クラウドコンピューティングのユーザーは、これらのリソースにリモートでアクセスするために、独自の物理的なインフラを購入し維持する必要がありません。
サイバー犯罪の増加に伴うBFSI分野での利用拡大が、世界のクラウド市場を牽引しています。銀行・金融業界は2022年に最大の市場シェアを占め、CAGRはほぼ30%以上となっています。
市場力学
サイバー攻撃とデータ盗難のリスク
多くの大企業が依然としてオンプレミスのITインフラに依存しているため、オンラインサービスであることに伴う重大なセキュリティリスクのために、クラウドコンピューティングはしばしば市場の拡大を妨げることがあります。
フレクセラの「Annual State of the Cloud Survey」によると、2022年には、企業の29%がセキュリティに大きな懸念を抱き、25%がガバナンスと統制の課題を経験することになります。特に、セキュリティの低いPaaSシステムやデフォルトのアプリケーション構成、セキュアソケットレイヤー(SSL)プロトコルの欠陥は、主にクラウドサービスに影響を与える顕著な脆弱性です。
高まるPaaSへの関心
PaaSは、高度なプログラミングが可能でありながら、複雑さを感じさせないという利点があるため、現在では大きな注目を集めています。クラウド事業者から構築済みのインフラを借りることができるため、企業におけるアプリケーション開発全般が効率化され、今後PaaSへの依存度が高まることが予想されます。
COVID-19の影響分析
COVID-19のパンデミックは、市場にとって有益な影響を及ぼしました。いくつかの業界において、デジタルトランスフォーメーションを伴うプロジェクトの触媒となっています。俊敏性と回復力を高めるために、組織はITインフラとアプリケーションを近代化する必要があることを認識しました。IaaS、PaaS、SaaSなどのクラウドサービスによって、デジタル変革の基盤が築かれ、企業はイノベーションを起こし、業務を合理化してリモートでサービスを提供できるようになりました。
ロシア・ウクライナ戦争影響分析
世界クラウド市場は、ロシア・ウクライナ紛争による影響も受けます。長引く紛争は、クラウドインフラの支出に影響を与える可能性があります。企業やクラウドサービスプロバイダーは、紛争の影響を直接受けている地域や地政学的リスクが高いと考えられる地域への投資戦略を見直すかもしれません。
不確実性や不安定性の結果、インフラ整備や成長が鈍化すれば、それらの地域におけるクラウドサービスの可用性や拡張性に影響が及ぶ可能性があります。
人工知能の影響分析
世界のクラウド市場は、人工知能の恩恵を受けると予測されています。AIは、クラウド市場において、パーソナライズされたユーザーインターフェースとレコメンデーションエンジンを可能にしました。クラウドサービスプロバイダーは、ユーザーデータとAIアルゴリズムを活用することで、消費者にパーソナライズされたコンテンツ、製品推奨、オーダーメイドの体験を提供し、ユーザーエンゲージメントと幸福度を高めることができます。
目次
第1章 調査手法とスコープ
- 調査手法
- 調査目的および調査範囲
第2章 定義と概要
第3章 エグゼクティブサマリー
- 市場内訳:タイプ別
- 市場内訳:組織規模別
- 市場内訳:エンドユーザー別
- 市場内訳:収益源別
- 市場内訳:流通チャネル別
- 市場内訳:地域別
第1章 市場力学
- 影響要因
- 促進要因
- あらゆる企業レベルでクラウドサービスに対する需要が高まっています
- クラウドコンピューティングの採用が増加
- 抑制要因
- サイバー攻撃やデータ盗難のリスク
- 機会
- PaaSサービスに対する関心の高まり
- 影響分析
- 促進要因
第2章 業界分析
- ポーターのファイブフォース分析
- サプライチェーン分析
- 価格分析
- 法規制の分析
第3章 COVID-19の分析
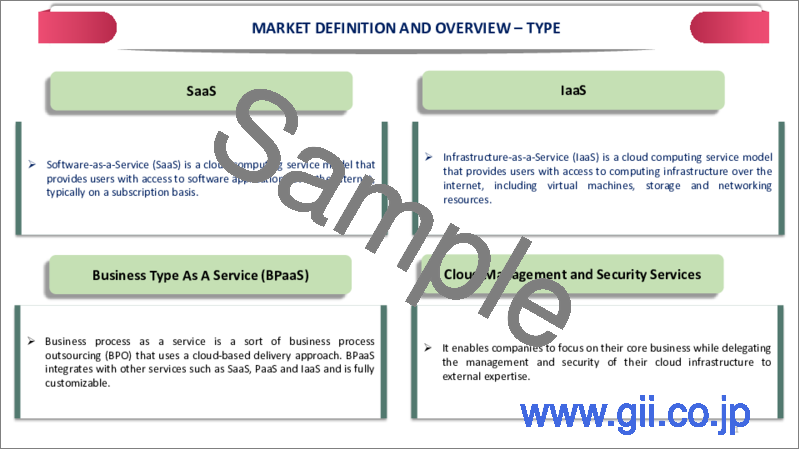
第4章 タイプ別
- SaaS
- IaaS
- BPaaS(Business Process As A Service)
- クラウド管理・セキュリティサービス
- DaaS(Desktop as a Service)
- PaaS
第5章 組織規模別
- 大企業
- 中小規模企業(SME)
第6章 エンドユーザー別
- 銀行・金融分野
- 通信・IT分野
- 官公庁・政府
- 消費財・小売
- ヘルスケア&ライフサイエンス
- 物流・運輸
- 教育・研究分野
- その他
第7章 収益源別
- サブスクリプション・ライセンス
- コンサルティング/プロフェッショナルサービス
- マネージドサービス
第8章 販売チャネル別
- 直販
- 販売代理店
第9章 地域別
- 北米
- 米国
- カナダ
- メキシコ
- 欧州
- ドイツ
- 英国
- フランス
- イタリア
- スペイン
- その他欧州
- 南米
- ブラジル
- アルゼンチン
- その他南米地域
- アジア太平洋地域
- 中国
- インド
- 日本
- オーストラリア
- その他アジア太平洋地域
- 中東・アフリカ地域
第10章 競合情勢
- 競合シナリオ
- 市況/シェア分析
- M&A(合併・買収)分析
第11章 企業プロファイル
- Microsoft
- 会社概要
- 製品ポートフォリオと説明
- 主なハイライト
- 財務概要
- Oracle
- IBM Corporation
- Cisco Systems Inc.
- SAP SE
- Salesforce.com, Inc.
- Quickbase, Inc.
- ThoughtSpot, Inc
- QlikTech International AB
第12章 付録
Market Overview
The Global Cloud Market is estimated to have reached around US$ 373 billion in 2022 and is projected to witness lucrative growth by reaching up to US$ 202 billion by 2030. The market is growing at a CAGR of 23.9% during the forecast period 2023-2030.
A methodology for providing on-demand access to computing resources such as servers, storage, applications and services through the Internet is called cloud computing. Users of cloud computing don't need to purchase and maintain their own physical infrastructure in order to access these resources remotely.
Growing usage in the BFSI sector as a result of an increase in cybercrime is what is driving the global cloud market. The banking and financial industry held the greatest market share in 2022 and had a CAGR of more than almost 30%.
Market Dynamics
Risk Of Cyber-Attacks And Data Theft
Due to the significant security risks associated with being an online service, cloud computing can often prevent the market from expanding because many large businesses still rely on on-premise IT infrastructure.
In 2022, 29% of firms will encounter security as a significant concern and 25% will experience governance and control challenges, according to Flexera's Annual State of the Cloud Survey. In particular, PaaS systems and default application configurations with low security and flaws in secure socket layers (SSL) protocols are prominent vulnerabilities that affect cloud services primarily.
The Growing Interest In Paas Service
PaaS offers high-level programming capability with noticeably less complications, which is one of the technology's now heavily marketed benefits. Due to the ability to borrow pre-built infrastructure from cloud providers, general application development in businesses will be more efficient and PaaS dependence is expected to increase in the future.
COVID-19 Impact Analysis
The COVID-19 pandemic had a beneficial effect on the market. It served as a catalyst for projects involving digital transformation in several industries. In order to increase agility and resilience organizations realised they needed to modernise their IT infrastructure and applications. The foundation for digital transformation initiatives was laid by cloud services, such as infrastructure as a service (IaaS), platform as a service (PaaS) and software as a service (SaaS), which allowed businesses to innovate, streamline operations and provide services remotely.
Russia-Ukraine War Impact Analysis
The Global Cloud Market is also impacted by the Russia-Ukraine conflict. The protracted conflict can have an impact on cloud infrastructure spending. Businesses and cloud service providers might reevaluate their investment strategies in areas directly affected by the conflict or thought to have higher geopolitical risks.
The availability and scalability of cloud services in those regions may be impacted if infrastructure development and growth are slowed down as a result of uncertainty and instability.
Artificial Intelligence Impact Analysis
The worldwide cloud market is predicted to benefit from artificial intelligence. AI has made personalized user interfaces and recommendation engines possible in the cloud market. Cloud service providers may give personalized content, product recommendations and tailored experiences to consumers by utilising user data and AI algorithms, boosting user engagement and happiness.
Segment Analysis
The Global Cloud Market is segmented based on type organization size, end-user, revenue-source, distribution channel and region.
The Telecommunications and IT to Drive The Market Growth
With a CAGR of over 25% in 2022, the telecommunications and IT segment will have the second-largest market share. PaaS technology is a new development from traditional information and communication technology (ICT), where hardware is not required to connect. PaaS technology is used in telecom.
In order to manage unanticipated data growth and deliver an improved customer experience, it enables unrestricted network capacity. The cloudification of the IT and telecom sectors and the need to maintain market competitiveness are the main causes driving PaaS utilisation in the telecom sector.
Geographical Analysis
The Growing Infrastructure Investments in Asia-Pacific
According to estimates, North America will hold the greatest regional market share in the global cloud industry in 2022, accounting for over 67% of all worldwide revenue. The North American cloud market is growing due to innovation, online usage, and smartphone adoption. Major providers and affordability also contribute. The U.S. accounts for over 60% of the market.
Competitive Landscape
The major global players include: Microsoft oracle, IBM Corporation, Cisco Systems Inc., Google, SAP SE, Salesforce.com, Inc., Quickbase, Inc., ThoughtSpot, Inc and QlikTech International AB.
Why Purchase the Report?
- To visualize the Global Cloud Market segmentation based on type organization size, end-user, revenue source, distribution channel and region, as well as understand key commercial assets and players.
- Identify commercial opportunities by analyzing trends and co-development.
- Excel data sheet with numerous data points of cloud market-level with all segments.
- PDF report consists of a comprehensive analysis after exhaustive qualitative interviews and an in-depth study.
- Product mapping available as Excel consisting of key products of all the major players.
The Global Cloud Market Report Would Provide Approximately 75 Tables, 83 Figures And 204 pages.
Target Audience 2023
- Manufacturers/ Buyers
- Industry Investors/Investment Bankers
- Research Professionals
- Emerging Companies
Table of Contents
1. Methodology and Scope
- 1.1. Research Methodology
- 1.2. Research Objective and Scope of the Report
2. Definition and Overview
3. Executive Summary
- 3.1. Market Snippet By Type
- 3.2. Market Snippet By Organization Size
- 3.3. Market Snippet By End-User
- 3.4. Market Snippet by Revenue Source
- 3.5. Market Snippet by Distribution Channel
- 3.6. Market Snippet By Region
1. Dynamics
- 1.1. Impacting Factors
- 1.1.1. Drivers
- 1.1.1.1. The increasing demand for cloud services across all enterprise levels
- 1.1.1.2. Growing adoption of cloud computing
- 1.1.2. Restraints
- 1.1.2.1. Risk of cyber-attacks and data theft
- 1.1.3. Opportunity
- 1.1.3.1. The growing interest in PaaS service
- 1.1.4. Impact Analysis
- 1.1.1. Drivers
2. Industry Analysis
- 2.1. Porter's Five Force Analysis
- 2.2. Supply Chain Analysis
- 2.3. Pricing Analysis
- 2.4. Regulatory Analysis
3. COVID-19 Analysis
- 3.1. Analysis of COVID-19
- 3.1.1. Before COVID-19 Scenario
- 3.1.2. During COVID-19 Scenario
- 3.1.3. Post COVID-19 or Future Scenario
- 3.2. Pricing Dynamics Amid COVID-19
- 3.3. Demand-Supply Spectrum
- 3.4. Government Initiatives Related to the Market During Pandemic
- 3.5. Manufacturers Strategic Initiatives
- 3.6. Conclusion
4. By Type
- 4.1. Introduction
- 4.1.1. Market Size Analysis and Y-o-Y Growth Analysis (%), By Type
- 4.1.2. Market Attractiveness Index, By Type
- 4.2. SaaS*
- 4.2.1. Introduction
- 4.2.2. Market Size Analysis and Y-o-Y Growth Analysis (%)
- 4.3. IaaS
- 4.4. Business Process As A Service (BPaaS)
- 4.5. Cloud Management and Security Services
- 4.6. Desktop as a Service (DaaS)
- 4.7. PaaS
5. By Organization Size
- 5.1. Introduction
- 5.1.1. Market Size Analysis and Y-o-Y Growth Analysis (%), By Organization Size
- 5.1.2. Market Attractiveness Index, By Organization Size
- 5.2. Large Enterprises*
- 5.2.1. Introduction
- 5.2.2. Market Size Analysis and Y-o-Y Growth Analysis (%)
- 5.3. Small and Medium-Sized Enterprises (SME)
6. By End-User
- 6.1. Introduction
- 6.1.1. Market Size Analysis and Y-o-Y Growth Analysis (%), By End-User
- 6.1.2. Market Attractiveness Index, By End-User
- 6.2. Banking & Financial Sector*
- 6.2.1. Introduction
- 6.2.2. Market Size Analysis and Y-o-Y Growth Analysis (%)
- 6.3. Telecommunications & IT
- 6.4. Public Sector & Government
- 6.5. Consumer Goods & Retail
- 6.6. Healthcare & Life Sciences
- 6.7. Logistics & Transportation
- 6.8. Education & Research
- 6.9. Others
7. By Revenue-Source
- 7.1. Introduction
- 7.1.1. Market Size Analysis and Y-o-Y Growth Analysis (%), By Revenue-Source
- 7.1.2. Market Attractiveness Index, By Revenue-Source
- 7.2. Subscriptions & Licenses*
- 7.2.1. Introduction
- 7.2.2. Market Size Analysis and Y-o-Y Growth Analysis (%)
- 7.3. Consulting / Professional Services
- 7.4. Managed Services
8. By Distribution Channel
- 8.1. Introduction
- 8.1.1. Market Size Analysis and Y-o-Y Growth Analysis (%), By Distribution Channel
- 8.1.2. Market Attractiveness Index, By Revenue-Source
- 8.2. Direct Sales*
- 8.2.1. Introduction
- 8.2.2. Market Size Analysis and Y-o-Y Growth Analysis (%)
- 8.3. Distributors
9. By Region
- 9.1. Introduction
- 9.2. Market Size Analysis and Y-o-Y Growth Analysis (%), By Region
- 9.3. Market Attractiveness Index, By Region
- 9.4. North America
- 9.4.1. Introduction
- 9.4.2. Key Region-Specific Dynamics
- 9.4.3. Market Size Analysis and Y-o-Y Growth Analysis (%), By Type
- 9.4.4. Market Size Analysis and Y-o-Y Growth Analysis (%), By Organization Size
- 9.4.5. Market Size Analysis and Y-o-Y Growth Analysis (%), By End-User
- 9.4.6. Market Size Analysis and Y-o-Y Growth Analysis (%), By Revenue-source
- 9.4.7. Market Size Analysis and Y-o-Y Growth Analysis (%), By Distribution Channel
- 9.4.8. Market Size Analysis and Y-o-Y Growth Analysis (%), By Country
- 9.4.8.1. The U.S.
- 9.4.8.2. Canada
- 9.4.8.3. Mexico
- 9.5. Europe
- 9.5.1. Introduction
- 9.5.2. Key Region-Specific Dynamics
- 9.5.3. Market Size Analysis and Y-o-Y Growth Analysis (%), By Type
- 9.5.4. Market Size Analysis and Y-o-Y Growth Analysis (%), By Organization Size
- 9.5.5. Market Size Analysis and Y-o-Y Growth Analysis (%), By End-User
- 9.5.6. Market Size Analysis and Y-o-Y Growth Analysis (%), By Revenue-source
- 9.5.7. Market Size Analysis and Y-o-Y Growth Analysis (%), By Distribution Channel
- 9.5.8. Market Size Analysis and Y-o-Y Growth Analysis (%), By Country
- 9.5.8.1. Germany
- 9.5.8.2. The UK
- 9.5.8.3. France
- 9.5.8.4. Italy
- 9.5.8.5. Spain
- 9.5.8.6. Rest of Europe
- 9.6. South America
- 9.6.1. Introduction
- 9.6.2. Key Region-Specific Dynamics
- 9.6.3. Market Size Analysis and Y-o-Y Growth Analysis (%), By Type
- 9.6.4. Market Size Analysis and Y-o-Y Growth Analysis (%), By Organization Size
- 9.6.5. Market Size Analysis and Y-o-Y Growth Analysis (%), By End-User
- 9.6.6. Market Size Analysis and Y-o-Y Growth Analysis (%), By Revenue-source
- 9.6.7. Market Size Analysis and Y-o-Y Growth Analysis (%), By Distribution Channel
- 9.6.8. Market Size Analysis and Y-o-Y Growth Analysis (%), By Country
- 9.6.8.1. Brazil
- 9.6.8.2. Argentina
- 9.6.8.3. Rest of South America
- 9.7. Asia-Pacific
- 9.7.1. Introduction
- 9.7.2. Key Region-Specific Dynamics
- 9.7.3. Market Size Analysis and Y-o-Y Growth Analysis (%), By Type
- 9.7.4. Market Size Analysis and Y-o-Y Growth Analysis (%), By Organization Size
- 9.7.5. Market Size Analysis and Y-o-Y Growth Analysis (%), By End-User
- 9.7.6. Market Size Analysis and Y-o-Y Growth Analysis (%), By Revenue-source
- 9.7.7. Market Size Analysis and Y-o-Y Growth Analysis (%), By Distribution Channel
- 9.7.8. Market Size Analysis and Y-o-Y Growth Analysis (%), By Country
- 9.7.8.1. China
- 9.7.8.2. India
- 9.7.8.3. Japan
- 9.7.8.4. Australia
- 9.7.8.5. Rest of Asia-Pacific
- 9.8. Middle East and Africa
- 9.8.1. Introduction
- 9.8.2. Key Region-Specific Dynamics
- 9.8.3. Market Size Analysis and Y-o-Y Growth Analysis (%), By Type
- 9.8.4. Market Size Analysis and Y-o-Y Growth Analysis (%), By Organization Size
- 9.8.5. Market Size Analysis and Y-o-Y Growth Analysis (%), By End-User
- 9.8.6. Market Size Analysis and Y-o-Y Growth Analysis (%), By Revenue-source
- 9.8.7. Market Size Analysis and Y-o-Y Growth Analysis (%), By Distribution Channel
10. Competitive Landscape
- 10.1. Competitive Scenario
- 10.2. Market Positioning/Share Analysis
- 10.3. Mergers and Acquisitions Analysis
11. Company Profiles
- 11.1. Microsoft
- 11.1.1. Company Overview
- 11.1.2. Product Portfolio and Description
- 11.1.3. Key Highlights
- 11.1.4. Financial Overview
- 11.2. Oracle
- 11.3. IBM Corporation
- 11.4. Cisco Systems Inc.
- 11.5. Google
- 11.6. SAP SE
- 11.7. Salesforce.com, Inc.
- 11.8. Quickbase, Inc.
- 11.9. ThoughtSpot, Inc
- 11.10. QlikTech International AB
LIST NOT EXHAUSTIVE
12. Appendix
- 12.1. About Us and Services
- 12.2. Contact Us