 |
市場調査レポート
商品コード
1156143
主要照明メーカー世界100社の財務分析 - データベースとエグゼクティブサマリーFinancial Analysis of 100 Major Lighting Manufacturers Worldwide - Database and Executive Summary |
||||||

| 主要照明メーカー世界100社の財務分析 - データベースとエグゼクティブサマリー |
|
出版日: 2022年11月17日
発行: CSIL Centre for Industrial Studies
ページ情報: 英文 50 Pages
納期: 即日から翌営業日
|
- 全表示
- 概要
- 目次
貿易摩擦と地政学的不安定により2019年に始まった着実な落ち込み、2020年のCOVID-19危機の後、2021年に照明部門は大幅に回復しています。
2021年の売上高は、平均売上高が5%縮小した小企業を除き、すべての規模クラスで増加を記録しました。大企業に分類されるグループのみが、2017年から2021年の動向がプラスであると同時に、2021年の結果が2桁であると報告されています。
総サンプル調査:照明セグメント別企業数、
企業規模、地域
当レポートでは、主要照明メーカー世界100社の財務を分析し、照明部門の業績、600社の貸借対照表の主要財務データ、販売成長率と指標、収益性、財務構造、雇用、生産性、セグメント・地域別の分析などの情報を提供しています。
当レポート掲載の企業
Acuity Brands(米国)、AEC(イタリア)、Alto(韓国)、Arkoslight(スペイン)、Artemide(イタリア)、Bega(ベルギー)、Bisong Lighting(中国)、Catellani & Smith(イタリア)、Celsa(コロンビア)、Delta Light(ベルギー)、Dextra Group(英国)、Eclatec(フランス)、Eglo(オーストリア)、Endo Lighting(日本)、EXC-LED Technology(中国)、Fagerhult(SE)、Flos(イタリア)、FSL(中国)、Gewiss(イタリア)、GMR Enlights(イタリア)、Haoyang(中国)、Hella(ドイツ)、Hubbell(米国)、Intra Lighting(スロベニア)、Inventronics(中国)、Iwasaki(日本)、Koito Manufacturing(日本)、Lamplast Finanziaria(イタリア)、LEDs C4(スペイン)、Leedarson(中国)、Lightnet(ポーランド)、Lighting and Urban Equipment(ベトナム)、Ligman(タイ)、Lival(フィンランド)、Lombardo(イタリア)、Louis Poulsen(デンマーク)、LSI(米国)、Luceco(英国)、Maltani(韓国)、MK Illumination(スロバキア)、MLS(中国)、Molto Luce(オーストリア)、Nemo(イタリア)、Nowodworski(ポーランド)、Ocean's King Lighting(中国)、O Luce(イタリア)、Opple(中国)、Pars Shahab(IR)、Performance In Lighting(イタリア)、PUK Italia(イタリア)、Ragni(フランス)、Rangdong(ベトナム)、Reggiani(イタリア)、Roy Alpha(コロンビア)、Schreder(ベルギー)、SG Armaturen(ノルウェー)、Signify(オランダ)、Simes(イタリア)、Sunway Opto-Electronic(中国)、Thorpe(英国)、Topmet(ポーランド)、Ushio(日本)、Viabizzuno(イタリア)、Vizulo(リトアニア)、Wever & Ducre(ベルギー)、Wooree(韓国)、Xal(オーストリア)、Zumtobel(オーストリア)
目次
エグゼクティブサマリー
第1章 サンプルの選択、調査手法、および定義
第2章 照明部門の実績
- 総サンプル分析:主要財務データ、収益性と構造の比率、雇用と生産性(2017年~2021年)、合計値と平均値
第3章 地域別分析
- 総照明部門:主要財務データと比率(2017年~2021年)、次の地域ごとの合計値と平均値
- 欧州
- 日本と韓国
- 中国
- アジア太平洋地域
- 米国
第4章 照明セグメント別分析
- 主要財務データと比率(2017年~2021年)、次の照明セグメント別合計値と平均値
- 照明器具
- 照明部品
- 自動車照明
第5章 企業規模別分析
- 総照明部門:主要な財務データと比率(2017年~2021年)、企業規模別の合計値と平均値
- 超大企業(2021年の売上高:10億米ドル超)
- 大企業(2021年の売上高:1億米ドル以上10億米ドル未満)
- 中規模企業(2021年の売上高:が1,000万米ドル以上1億米ドル未満)
- 中小企業(2021年の売上高:1,000万米ドル未満)
第6章a ベストインクラス企業:大企業
- 照明部門のベストインクラス企業(大企業):主要財務データと比率(2017年~2021年)、合計値と平均値
- 照明部門のベストインクラス企業(大企業):各主要財務データと比率、収益性と財務構造の指標、企業別労働指標(2021年)、営業収益別ランキング
第6章b ベストインクラス企業:中小企業
- 照明部門のベストインクラス企業(中小企業):主要財務データと比率(2017年~2021年)、合計値と平均値
- 照明部門のベストインクラス企業(中小企業):各主要財務データと比率、収益性と財務構造の指標、企業別労働指標(2021年)、営業収益別ランキング
第7章 建築およびアウトドア企業への注目
- 建築および屋外照明の主要企業:主要財務データと比率(2017年~2021年)、合計値と平均値
- 各主要財務データと比率、収益性と財務構造の指標、企業別の労働指標(2021年)、営業収益別ランキング
付録:600社のリスト:各財務データ、ウェブサイト、証券取引所リファレンス、保有データ
The report “Financial Analysis of 100 Major Lighting Manufacturers Worldwide”, now at its third edition, is the result of CSIL processing of a dataset made up of a large number of balance sheets (600 companies, for the period 2017-2021), including lighting fixtures, lighting components and lighting automotive manufacturers.
The purpose of this study is to assess the recent trends and structural characteristics of the lighting industry through the analysis of the balance sheets for the years 2017 to 2021 of a group of around 600 companies based worldwide and to identify, among them, the top 100 performing companies in the business. Top 100 players are reported separately as Big (over 50 million USD turnover) and Small players. In addition, a focus on the financial results of architectural and outdoor-oriented lighting companies is provided.
The total sample analysed, for which an homogeneous time series were available (approximately 500 companies), shows an average workforce of over 750 employees and an average turnover of over USD 158 million in 2021. In absolute terms, the industry exhibits a 2021 turnover of about USD 77 billion, an EBIT in excess of USD 5 billion, almost 365 employees.
The Report is made up by a short executive summary (around 50 pages) and an Excel database of company financial data and sector average.
The sample was selected according to the following criteria:
- availability of balance sheet data (consolidated and/or unconsolidated accounts);
- company turnover of over US$ 5 million in one of the years between 2017 and 2021;
- company's core activity corresponding to one of the following NACE codes 2740: Manufacture of electric lighting equipment.
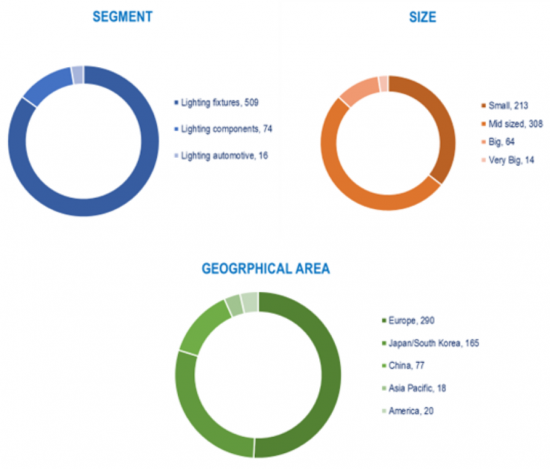
The sample of 600 companies analysed was broken down by geographical area, lighting segment, turnover range.
Sample by geographical area:
- 290 European companies
- 165 Japanese and South Korean companies
- 77 Chinese companies
- 18 Asian Pacific companies
- 20 American companies.
Sample by lighting segment:
- Lighting fixtures, 509 players
- Automotive Lighting, 16 players
- Lighting Components (semi-finished products, lighting sources), 74 manufacturers.
Sample by turnover range:
- 14 Very Big companies (Turnover 2021 over USD 1,000 million)
- 64 Big companies (Turnover 2021 over USD 100 million and under USD 1,000 million)
- 308 Mid-sized companies (Turnover 2021 over USD 10 million and under USD 100 million)
- 213 Small companies (Turnover 2021 below USD 10 million)
The analysis considers a selection of productivity/profitability indicators available from the balance sheets.
- Key financial data: Operating Revenue (Turnover), Added Value, P/L before Tax, Net Income, EBITDA, EBIT
- Turnover indicators: Total Assets, Shareholders Funds, Cash Flow
- Profitability ratios: Profit margin, ROE, ROA, EBITDA margin, EBIT margin
- Structure ratios: Current and Solvency ratio
- Employment data and per employee ratios: Number of Employees, Turnover per Employee, EBIT per employee, Average cost of employee, Costs of employees / Operating revenue.
Annexed Excel File containing:
- Financial tables on average lighting sector performance 2017-2021, based on the 600 companies' sample;
- Companies' "Best in Class" selected data (top 100 performing players in 2021, "Big" and "Small");
- Website, Stock Exchange reference, Holding data for 600 companies (when available);
- Operating revenue (Turnover) 2021, number of employees and EBITDA available for around 600 companies.
The report is structured as follows:
- Lighting sector performance. Analysis of Key financial data of 600 balance-sheet, for the period 2017-2021. Overview of the total sample in terms of turnover growth and turnover indicators, profitability, financial structure, employment, and productivity.
- Analysis by geographical area. This chapter breaks down the sample of 600 companies by five geographical area, highlighting key financial data and ratios for each area.
- Analysis by lighting segment. Each company is classified according to its core activity. The following Lighting segments are identified: Lighting Fixtures, Lighting Components, Automotive Lighting.
- Analysis by company size. The sample of 600 companies was broken down by five turnover ranges, ranging from less than USD 10 million, to over USD 1,000 million during the last available year.
- Analysis of the "best in class" companies. 100 companies were selected from the sample of 600 companies, grouped in "Best in Class" big players and "Best in Class" small players.
- Analysis of the Architectural and Outdoor companies. Performance analysis of a sample of 49 Architectural-oriented lighting companies and 35 Outdoor-oriented lighting companies.
Highlights:
Total Sample Survey: number of companies by lighting segment,
company size, geographic area
After a steady decline started in 2019, as a result of trade frictions and geopolitical instabilities, and confirmed in 2020 due the Covid-19 crisis, 2021 shows a massive recover for the lighting sector.
The profitability indicators describe a sector with positive but decreasing return.
EBITDA margin was around 7.5% in 2021.
The average turnover per employee is approximately USD 211,000, slightly increased over the last five years.
All the size class recorded increases in turnover in 2021 except for small companies, whose average turnover contracted by 5%. Only the group classified as Big Companies reported a positive 2017-2021 trend as well as a double-digit 2021 result.
The Architectural Lighting players are on average more profitable than the total sample, all the considered profitability indicators are almost twice the average ones. The Outdoor Lighting players are slightly more profitable than the average, as three out of five profitability indicators are above the sample average.
Selected Companies:
Acuity Brands (USA), AEC (IT), Alto (KR), Arkoslight (ES), Artemide (IT), Bega (BE), Bisong Lighting (CN), Catellani & Smith (IT), Celsa (CO), Delta Light (BE), Dextra Group (UK), Eclatec (FR), Eglo (AT), Endo Lighting (JP), EXC-LED Technology (CN), Fagerhult (SE), Flos (IT), FSL (CN), Gewiss (IT), GMR Enlights (IT), Haoyang (CN), Hella (DE), Hubbell (USA), Intra Lighting (SI), Inventronics (CN), Iwasaki (JP), Koito Manufacturing (JP), Lamplast Finanziaria (IT), LEDs C4 (ES), Leedarson (CN), Lightnet (PL), Lighting and Urban Equipment (VN), Ligman (TH), Lival (FI), Lombardo (IT), Louis Poulsen (DK), LSI (USA), Luceco (UK), Maltani (KR), MK Illumination (SK), MLS (CN), Molto Luce (AT), Nemo (IT), Nowodworski (PL), Ocean's King Lighting (CN), O Luce (IT), Opple (CN), Pars Shahab (IR), Performance In Lighting (IT), PUK Italia (IT), Ragni (FR), Rangdong (VN), Reggiani (IT), Roy Alpha (CO), Schreder (BE), SG Armaturen (NO), Signify (NL), Simes (IT), Sunway Opto-Electronic (CN), Thorpe (UK), Topmet (PL), Ushio (JP), Viabizzuno (IT), Vizulo (LT), Wever & Ducre (BE), Wooree(KR), Xal (AT), Zumtobel (AT).
TABLE OF CONTENTS
EXECUTIVE SUMMARY
1. SAMPLE SELECTION, METHODOLOGY AND DEFINITIONS
2. LIGHTING SECTOR PERFORMANCE
Total sample analysis: Key financial data, Profitability and Structure ratios, Employment and productivity, 2017-2021. Total and mean values
3. ANALYSIS BY GEOGRAPHICAL AREA
Total lighting sector. Key financial data and ratios, 2017-2021. Total and mean values by the following areas:
- Europe
- Japan and South Korea
- China
- Asia Pacific
- America
4. ANALYSIS BY LIGHTING SEGMENT
Key financial data and ratios, 2017-2021. Total and mean values by the following lighting segments:
- Lighting Fixtures
- Lighting Components
- Automotive Lighting
5. ANALYSIS BY COMPANY SIZE
Total lighting sector. Key financial data and ratios, 2017-2021. Total and mean values by company size:
- Very Big companies (turnover 2021 over 1000 USD million)
- Big companies (turnover 2021 over 100 million USD and under 1000 million USD)
- Mid-sized companies (turnover 2021 over 10 million USD and under 100 million USD)
- Small companies (turnover 2021 under 10 USD million)
6a. BEST IN CLASS COMPANIES: BIG PLAYERS
- Best in Class companies in the Lighting sector: Big players. Key financial data and ratios, 2017-2021. Total and mean values
- Best in Class companies in the Lighting sector: Big players. Selected key financial data and ratios, profitability and financial structure indicators, labour indicators by Company, 2021. Ranking by Operating revenue
6b. BEST IN CLASS COMPANIES: SMALL PLAYERS
- Best in Class companies in the Lighting sector: Small players. Key financial data and ratios, 2017-2021. Total and mean values
- Best in Class companies in the Lighting sector: Small players. Selected key financial data and ratios, profitability and financial structure indicators, labour indicators by Company, 2021. Ranking by Operating revenue
7. FOCUS ON ARCHITECTURAL AND OUTDOOR COMPANIES
- Top architectural and outdoor lighting players. Key financial data and ratios, 2017-2021. Total and mean values
- Selected key financial data and ratios, profitability and financial structure indicators, labour indicators by Company, 2021. Ranking by Operating revenue