
|
市場調査レポート
商品コード
1699465
デジタルインタラクティブサービス市場:ディスプレイタイプ別、アプリケーション別、地域別Digital Interactive Service Market, By Display Type, By Application, By Geography |
||||||
カスタマイズ可能
|
|||||||
| デジタルインタラクティブサービス市場:ディスプレイタイプ別、アプリケーション別、地域別 |
|
出版日: 2025年03月18日
発行: Coherent Market Insights
ページ情報: 英文 135 Pages
納期: 2~3営業日
|

全表示
- 概要
- 目次
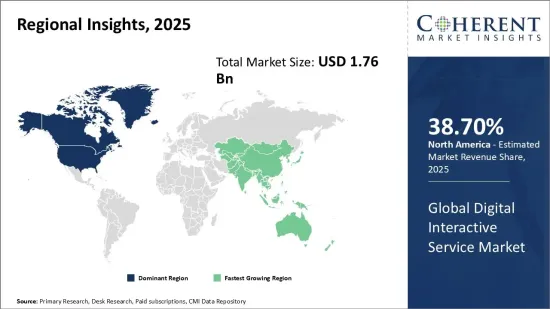
世界のデジタルインタラクティブサービス市場は、2025年に17億6,000万米ドルと推定され、2032年には26億8,000万米ドルに達すると予測され、2025年から2032年までの年間平均成長率(CAGR)は6.2%で成長すると予測されます。
| レポート範囲 | レポート詳細 | ||
|---|---|---|---|
| 基準年 | 2024 | 2025年の市場規模 | 17億6,000万米ドル |
| 実績データ | 2020年から2024年まで | 予測期間 | 2025年から2032年 |
| 予測期間:2025年~2032年 CAGR: | 6.20% | 2032年の価値予測 | 26億8,000万米ドル |
さまざまな業界におけるデジタル化と自動化の動向により、デジタルプラットフォームを通じて提供されるインタラクティブサービスの採用が増加しています。インタラクティブサービスにより、ユーザーはインタラクティブコミュニケーションに参加し、カスタマイズされたパーソナライズされた体験を得ることができます。AI、IoT、クラウド、アナリティクスなどの技術の進歩により、サービスプロバイダーは高度にカスタマイズされた魅力的なデジタル体験をユーザーに提供できるようになりました。インターネットとスマートフォンの普及率の伸びと、デジタルで自動化されたサービスに対する消費者の嗜好の変化は、世界のデジタルインタラクティブサービス市場を前進させる主な要因の一部です。しかし、デジタルデータの収集と利用に伴うセキュリティとプライバシーの懸念は、市場の成長をある程度抑制する可能性があります。
市場力学:
世界のデジタルインタラクティブサービス市場の成長を促進する主な要因には、業界全体におけるデジタル化と自動化の動向の拡大、インターネットとスマートフォンの普及率の上昇、デジタルサービスに対する消費者の嗜好の変化などがあります。しかし、デジタルデータの収集と使用に関連するデータプライバシーとセキュリティの懸念は、市場にとって大きな課題となっています。しかし、AI、ブロックチェーン、拡張現実(AR)、仮想現実(VR)などの先端技術の開発は、今後数年間でサービスプロバイダーに新たな機会をもたらすと予想されます。デジタルインタラクティブサービスの採用は、教育、ヘルスケア、eコマース、BFSI、製造、メディア、エンターテインメントなどの分野で増加しています。ビデオやオーディオベースのインタラクティブツールの人気が高まっていることも、市場成長を後押しする要因のひとつです。しかし、これらのサービスに関連する高い導入コストとメンテナンスコストが、特に新興国市場の妨げとなっています。
本調査の主な特徴
本レポートでは、世界のデジタルインタラクティブサービス市場を詳細に分析し、2024年を基準年とした予測期間(2025年~2032年)の市場規模および複合年間成長率(CAGR%)を掲載しています。
また、さまざまなセグメントにわたる潜在的な収益機会を明らかにし、この市場の魅力的な投資提案マトリクスについて解説しています。
また、市場促進要因、抑制要因、機会、新製品の発売や承認、市場動向、地域別の展望、主要企業が採用する競争戦略などに関する重要な考察も提供しています。
企業ハイライト、製品ポートフォリオ、主要なハイライト、業績、戦略などのパラメータに基づいて、世界のデジタルインタラクティブサービス市場の主要企業をプロファイルしています。
主要企業には、Samsung Electronics、LG Electronics、Microsoft Corporation、Google LLC、Sharp Corporation、BenQ Corporation、Elo Touch Solutions、NEC Display Solutions、ViewSonic Corporation、SMART Technologies、Promethean World、InFocus Corporation、Panasonic Corporation、Cisco Systems, Inc.、Acer Inc.などが含まれます。
このレポートからの洞察により、マーケティング担当者や企業の経営陣は、将来の製品発売、タイプアップ、市場拡大、マーケティング戦術に関する情報に基づいた意思決定を行うことができます。
この調査レポートは、投資家、サプライヤー、製品メーカー、流通業者、新規参入者、財務アナリストなど、この業界の様々な利害関係者を対象としています。
利害関係者は、世界のデジタルインタラクティブサービス市場の分析に使用される様々な戦略マトリックスを通じて、意思決定を容易にすることができます。
目次
第1章 調査の目的と前提条件
- 調査目的
- 前提条件
- 略語
第2章 市場の展望
- レポートの説明
- 市場の定義と範囲
- エグゼクティブサマリー
第3章 市場力学、規制、動向分析
- 市場力学
- 影響分析
- 主なハイライト
- 規制シナリオ
- 製品の発売/承認
- PEST分析
- PORTERの分析
- 市場機会
- 規制シナリオ
- 主な発展
- 業界動向
第4章 世界のデジタルインタラクティブサービス市場、ディスプレイタイプ別、2020年~2032年
- インタラクティブキオスク
- インタラクティブビデオウォール
- インタラクティブテーブル
- インタラクティブモニター
- インタラクティブホワイトボード
第5章 世界のデジタルインタラクティブサービス市場、アプリケーション別、2020年~2032年
- 小売り
- ホスピタリティ
- ヘルスケア
- 交通機関
- 銀行、金融サービス、保険(BFSI)
- 企業
- エンターテインメント
- 教育
第6章 世界のデジタルインタラクティブサービス市場、地域別、2020年-2032年
- 北米
- ラテンアメリカ
- 欧州
- アジア太平洋
- 中東
- アフリカ
第7章 競合情勢
- Samsung Electronics
- LG Electronics
- Microsoft Corporation
- Google LLC
- Sharp Corporation
- BenQ Corporation
- Elo Touch Solutions
- NEC Display Solutions
- ViewSonic Corporation
- SMART Technologies
- Promethean World
- InFocus Corporation
- Panasonic Corporation
- Cisco Systems, Inc.
- Acer Inc.
第8章 アナリストの推奨事項
- 運命の輪
- アナリストの見解
- 一貫した機会マップ
第9章 参考文献と調査手法
- 参考文献
- 調査手法
- 出版社について
Global Digital Interactive Service Market is estimated to be valued at US$ 1.76 Bn in 2025 and is expected to reach US$ 2.68 Bn by 2032, growing at a compound annual growth rate (CAGR) of 6.2% from 2025 to 2032.
| Report Coverage | Report Details | ||
|---|---|---|---|
| Base Year: | 2024 | Market Size in 2025: | USD 1.76 Bn |
| Historical Data for: | 2020 To 2024 | Forecast Period: | 2025 To 2032 |
| Forecast Period 2025 to 2032 CAGR: | 6.20% | 2032 Value Projection: | USD 2.68 Bn |
Digitalization and automation trends across various industry verticals have increased the adoption of interactive services which are offered through digital platforms. Interactive services allow users to engage in two-way communication and receive customized and personalized experience. Advancements in technologies, such as AI, IoT, cloud, and analytics, have enabled service providers to offer highly customized and engaging digital experiences to users. The growth of internet and smartphone penetration coupled with changing consumer preferences for digital and automated services are some of the key factors driving the global digital interactive service market forward. However, security and privacy concerns associated with digital data collection and usage may restrain the market growth to a certain extent.
Market Dynamics:
The key drivers propelling the growth of the global digital interactive service market include growing digitization and automation trends across industries, rising internet and smartphone penetration, and changing consumer preferences towards digital services. However, data privacy and security concerns associated with digital data collection and usage pose as major challenges for the market. But development of advanced technologies such as AI, Blockchain, augmented reality, and virtual reality are expected to create new opportunities for service providers in the coming years. Adoption of digital interactive services is increasing across sectors like education, healthcare, e-commerce, BFSI, manufacturing, media, and entertainment, among others. Rising popularity of video and audio based interactive tools is another factor boosting the market growth. However, high implementation and maintenance costs associated with these services hamper the market particularly in under developed regions.
Key Features of the Study:
This report provides in-depth analysis of the global digital interactive service market, and provides market size (US$ Billion) and compound annual growth rate (CAGR%) for the forecast period (2025-2032), considering 2024 as the base year
It elucidates potential revenue opportunities across different segments and explains attractive investment proposition matrices for this market
This study also provides key insights about market drivers, restraints, opportunities, new product launches or approvals, market trends, regional outlook, and competitive strategies adopted by key players
It profiles key players in the global digital interactive service market based on the following parameters - company highlights, products portfolio, key highlights, financial performance, and strategies
Key companies covered as a part of this study include Samsung Electronics, LG Electronics, Microsoft Corporation, Google LLC, Sharp Corporation, BenQ Corporation, Elo Touch Solutions, NEC Display Solutions, ViewSonic Corporation, SMART Technologies, Promethean World, InFocus Corporation, Panasonic Corporation, Cisco Systems, Inc., and Acer Inc.
Insights from this report would allow marketers and the management authorities of the companies to make informed decisions regarding their future product launches, type up-gradation, market expansion, and marketing tactics
The global digital interactive service market report caters to various stakeholders in this industry including investors, suppliers, product manufacturers, distributors, new entrants, and financial analysts
Stakeholders would have ease in decision-making through various strategy matrices used in analyzing the global digital interactive service market
Market Segmentation
- Display Type Insights (Revenue, USD Bn, 2020 - 2032)
- Interactive Kiosk
- Interactive Video Wall
- Interactive Table
- Interactive Monitor
- Interactive Whiteboard
- Application Insights (Revenue, USD Bn, 2020 - 2032)
- Retail
- Hospitality
- Healthcare
- Transportation
- Banking, Financial Services, and Insurance (BFSI)
- Corporate
- Entertainment
- Education
- Regional Insights (Revenue, USD Bn, 2020 - 2032)
- North America
- U.S.
- Canada
- Latin America
- Brazil
- Argentina
- Mexico
- Rest of Latin America
- Europe
- Germany
- U.K.
- Spain
- France
- Italy
- Russia
- Rest of Europe
- Asia Pacific
- China
- India
- Japan
- Australia
- South Korea
- ASEAN
- Rest of Asia Pacific
- Middle East
- GCC Countries
- Israel
- Rest of Middle East
- Africa
- South Africa
- North Africa
- Central Africa
- Key Players Insights
- Samsung Electronics
- LG Electronics
- Microsoft Corporation
- Google LLC
- Sharp Corporation
- BenQ Corporation
- Elo Touch Solutions
- NEC Display Solutions
- ViewSonic Corporation
- SMART Technologies
- Promethean World
- InFocus Corporation
- Panasonic Corporation
- Cisco Systems, Inc.
- Acer Inc.
Table of Contents
1. Research Objectives and Assumptions
- Research Objectives
- Assumptions
- Abbreviations
2. Market Purview
- Report Description
- Market Definition and Scope
- Executive Summary
- Global Digital Interactive Service Market, By Display Type
- Global Digital Interactive Service Market, By Application
- Global Digital Interactive Service Market, By Region
3. Market Dynamics, Regulations, and Trends Analysis
- Market Dynamics
- Impact Analysis
- Key Highlights
- Regulatory Scenario
- Product Launches/Approvals
- PEST Analysis
- PORTER's Analysis
- Market Opportunities
- Regulatory Scenario
- Key Developments
- Industry Trends
4. Global Digital Interactive Service Market, By Display Type, 2020-2032, (USD Bn)
- Introduction
- Market Share Analysis, 2025 and 2032 (%)
- Y-o-Y Growth Analysis, 2021 - 2032
- Segment Trends
- Interactive Kiosk
- Introduction
- Market Size and Forecast, and Y-o-Y Growth, 2020-2032, (USD Bn)
- Interactive Video Wall
- Introduction
- Market Size and Forecast, and Y-o-Y Growth, 2020-2032, (USD Bn)
- Interactive Table
- Introduction
- Market Size and Forecast, and Y-o-Y Growth, 2020-2032, (USD Bn)
- Interactive Monitor
- Introduction
- Market Size and Forecast, and Y-o-Y Growth, 2020-2032, (USD Bn)
- Interactive Whiteboard
- Introduction
- Market Size and Forecast, and Y-o-Y Growth, 2020-2032, (USD Bn)
5. Global Digital Interactive Service Market, By Application, 2020-2032, (USD Bn)
- Introduction
- Market Share Analysis, 2025 and 2032 (%)
- Y-o-Y Growth Analysis, 2021 - 2032
- Segment Trends
- Retail
- Introduction
- Market Size and Forecast, and Y-o-Y Growth, 2020-2032, (USD Bn)
- Hospitality
- Introduction
- Market Size and Forecast, and Y-o-Y Growth, 2020-2032, (USD Bn)
- Healthcare
- Introduction
- Market Size and Forecast, and Y-o-Y Growth, 2020-2032, (USD Bn)
- Transportation
- Introduction
- Market Size and Forecast, and Y-o-Y Growth, 2020-2032, (USD Bn)
- Banking, Financial Services, and Insurance (BFSI)
- Introduction
- Market Size and Forecast, and Y-o-Y Growth, 2020-2032, (USD Bn)
- Corporate
- Introduction
- Market Size and Forecast, and Y-o-Y Growth, 2020-2032, (USD Bn)
- Entertainment
- Introduction
- Market Size and Forecast, and Y-o-Y Growth, 2020-2032, (USD Bn)
- Education
- Introduction
- Market Size and Forecast, and Y-o-Y Growth, 2020-2032, (USD Bn)
6. Global Digital Interactive Service Market, By Region, 2020 - 2032, Value (USD Bn)
- Introduction
- Market Share (%) Analysis, 2025,2028 & 2032, Value (USD Bn)
- Market Y-o-Y Growth Analysis (%), 2021 - 2032, Value (USD Bn)
- Regional Trends
- North America
- Introduction
- Market Size and Forecast, By Display Type, 2020 - 2032, Value (USD Bn)
- Market Size and Forecast, By Application, 2020 - 2032, Value (USD Bn)
- Market Size and Forecast, By Country, 2020 - 2032, Value (USD Bn)
- U.S.
- Canada
- Latin America
- Introduction
- Market Size and Forecast, By Display Type, 2020 - 2032, Value (USD Bn)
- Market Size and Forecast, By Application, 2020 - 2032, Value (USD Bn)
- Market Size and Forecast, By Country, 2020 - 2032, Value (USD Bn)
- Brazil
- Argentina
- Mexico
- Rest of Latin America
- Europe
- Introduction
- Market Size and Forecast, By Display Type, 2020 - 2032, Value (USD Bn)
- Market Size and Forecast, By Application, 2020 - 2032, Value (USD Bn)
- Market Size and Forecast, By Country, 2020 - 2032, Value (USD Bn)
- Germany
- U.K.
- Spain
- France
- Italy
- Russia
- Rest of Europe
- Asia Pacific
- Introduction
- Market Size and Forecast, By Display Type, 2020 - 2032, Value (USD Bn)
- Market Size and Forecast, By Application, 2020 - 2032, Value (USD Bn)
- Market Size and Forecast, By Country, 2020 - 2032, Value (USD Bn)
- China
- India
- Japan
- Australia
- South Korea
- ASEAN
- Rest of Asia Pacific
- Middle East
- Introduction
- Market Size and Forecast, By Display Type, 2020 - 2032, Value (USD Bn)
- Market Size and Forecast, By Application, 2020 - 2032, Value (USD Bn)
- Market Size and Forecast, By Country, 2020 - 2032, Value (USD Bn)
- GCC Countries
- Israel
- Rest of Middle East
- Africa
- Introduction
- Market Size and Forecast, By Display Type, 2020 - 2032, Value (USD Bn)
- Market Size and Forecast, By Application, 2020 - 2032, Value (USD Bn)
- Market Size and Forecast, By Country/Region, 2020 - 2032, Value (USD Bn)
- South Africa
- North Africa
- Central Africa
7. Competitive Landscape
- Samsung Electronics
- Company Highlights
- Product Portfolio
- Key Developments
- Financial Performance
- Strategies
- LG Electronics
- Company Highlights
- Product Portfolio
- Key Developments
- Financial Performance
- Strategies
- Microsoft Corporation
- Company Highlights
- Product Portfolio
- Key Developments
- Financial Performance
- Strategies
- Google LLC
- Company Highlights
- Product Portfolio
- Key Developments
- Financial Performance
- Strategies
- Sharp Corporation
- Company Highlights
- Product Portfolio
- Key Developments
- Financial Performance
- Strategies
- BenQ Corporation
- Company Highlights
- Product Portfolio
- Key Developments
- Financial Performance
- Strategies
- Elo Touch Solutions
- Company Highlights
- Product Portfolio
- Key Developments
- Financial Performance
- Strategies
- NEC Display Solutions
- Company Highlights
- Product Portfolio
- Key Developments
- Financial Performance
- Strategies
- ViewSonic Corporation
- Company Highlights
- Product Portfolio
- Key Developments
- Financial Performance
- Strategies
- SMART Technologies
- Company Highlights
- Product Portfolio
- Key Developments
- Financial Performance
- Strategies
- Promethean World
- Company Highlights
- Product Portfolio
- Key Developments
- Financial Performance
- Strategies
- InFocus Corporation
- Company Highlights
- Product Portfolio
- Key Developments
- Financial Performance
- Strategies
- Panasonic Corporation
- Company Highlights
- Product Portfolio
- Key Developments
- Financial Performance
- Strategies
- Cisco Systems, Inc.
- Company Highlights
- Product Portfolio
- Key Developments
- Financial Performance
- Strategies
- Acer Inc.
- Company Highlights
- Product Portfolio
- Key Developments
- Financial Performance
- Strategies
8. Analyst Recommendations
- Wheel of Fortune
- Analyst View
- Coherent Opportunity Map
9. References and Research Methodology
- References
- Research Methodology
- About us
