|
|
市場調査レポート
商品コード
1326534
マイクロモビリティの世界市場規模調査・予測、推進タイプ別、車両タイプ別、シェアリングタイプ別、年齢層別、地域別分析、2023-2030年Global Micro mobility Market Size study & Forecast, by Propulsion Type, by Vehicle Type by Sharing Type by Age Group and Regional Analysis, 2023-2030 |
||||||
|
|
|||||||
カスタマイズ可能
|
|||||||


| マイクロモビリティの世界市場規模調査・予測、推進タイプ別、車両タイプ別、シェアリングタイプ別、年齢層別、地域別分析、2023-2030年 |
|
出版日: 2023年07月28日
発行: Bizwit Research & Consulting LLP
ページ情報: 英文
納期: 2~3営業日
|

- 全表示
- 概要
- 図表
- 目次
世界のマイクロモビリティ市場は、2022年に約594億6,000万米ドルと評価され、予測期間2023-2030年には17.4%以上の健全な成長率で成長すると予測されています。
マイクロモビリティには、短距離の通勤用に設計されたコンパクトで軽量なさまざまな交通手段が含まれ、通常は10キロメートルまでの距離をカバーします。このカテゴリーには、自転車、e-bike、電動スクーター、電動スケートボード、シェアサイクル、電動ペダル付き自転車など、多様な乗り物が含まれます。これらの移動手段の特徴は、制限速度が時速15マイル(時速25km)以下であることです。世界のマイクロモビリティ市場は、スマートシティと車両インフラの世界の進歩に起因する拡大を目の当たりにしています。オンデマンド交通サービスへの需要の高まり、スマートシティ構想を推進する政府の取り組み、ベンチャーキャピタル投資の増加など、さまざまな要因が成長を後押ししています。また、オフィス通勤者の間で相乗りサービスや自転車プールサービスが好まれることも、ライドヘイリングやライドシェアサービスの成長に寄与しています。
小旅行のための便利で手頃な交通手段として自転車への嗜好が高まっているため、マイクロモビリティ・ソリューションの需要が急増しています。この自転車需要の増加が、マイクロモビリティ市場の成長を促す重要な要因となっています。Statistaによると、世界の自転車販売台数は大幅な成長を遂げ、2021年から2027年にかけてほぼ倍増すると予測されています。2021年の市場規模は384億米ドルで、自転車産業は上昇基調を続け、2027年には738億5,000万米ドルに達すると予測されています。さらに、インテリジェント交通システムや、自転車シェアリング・インフラ整備のための政府の支援イニシアティブは、世界中のマイクロモビリティ世界市場の成長に数多くの機会を創出すると予想されます。しかし、新興国市場におけるインターネット普及率の低さが、2023~2030年の予測期間を通じて市場の成長を阻害しています。
マイクロモビリティの世界市場調査において考慮した主な地域は、アジア太平洋、北米、欧州、ラテンアメリカ、中東&アフリカです。北米は、都市人口の拡大、主要市場プレイヤーの存在、都市のインフラ整備により、公共交通機関の利用が促進され、2022年の市場シェアは最大となり、市場を独占しました。アジア太平洋地域は、様々な分野での自動車需要の増加、スマートシティに向けた政府の積極的な取り組み、便利で手頃な交通手段としての自転車への嗜好の高まりにより、予測期間中に大きく成長すると予想されます。
本調査の目的は、近年における様々なセグメントと国の市場規模を明らかにし、今後数年間の市場規模を予測することです。本レポートは、調査対象国における業界の質的・量的側面を盛り込むよう設計されています。
また、市場の将来的な成長を規定する促進要因や課題などの重要な側面に関する詳細情報も提供しています。さらに、主要企業の競合情勢や製品提供の詳細な分析とともに、利害関係者が投資するためのミクロ市場における潜在的な機会も組み込んでいます。
目次
第1章 エグゼクティブサマリー
第2章 世界のマイクロモビリティ市場の定義と範囲
- 調査目的
- 市場の定義と範囲
- 産業の進化
- 調査範囲
- 調査対象年
- 通貨換算レート
第3章 世界のマイクロモビリティ市場力学
- マイクロモビリティ市場の影響分析(2020-2030年)
- 市場促進要因
- スマートシティと車両インフラ整備の増加
- オンデマンド交通サービスの人気の高まり
- 市場の課題
- インターネット普及率の低さ
- 自転車の盗難や破損の増加
- 市場機会
- インテリジェント交通システムの成長
- バイクシェアリング・インフラ開発に対する政府の支援策
- 市場促進要因
第4章 世界のマイクロモビリティ市場:産業分析
- ポーターの5フォースモデル
- 供給企業の交渉力
- 買い手の交渉力
- 新規参入業者の脅威
- 代替品の脅威
- 競争企業間の敵対関係
- ポーターの5フォース影響分析
- PEST分析
- 政治的
- 経済
- 社会
- 技術
- 環境
- 法律
- 主な投資機会
- 主要成功戦略
- COVID-19影響分析
- 破壊的動向
- 業界専門家の視点
- アナリストの結論・提言
第5章 マイクロモビリティの世界市場:推進タイプ別
- 市場スナップショット
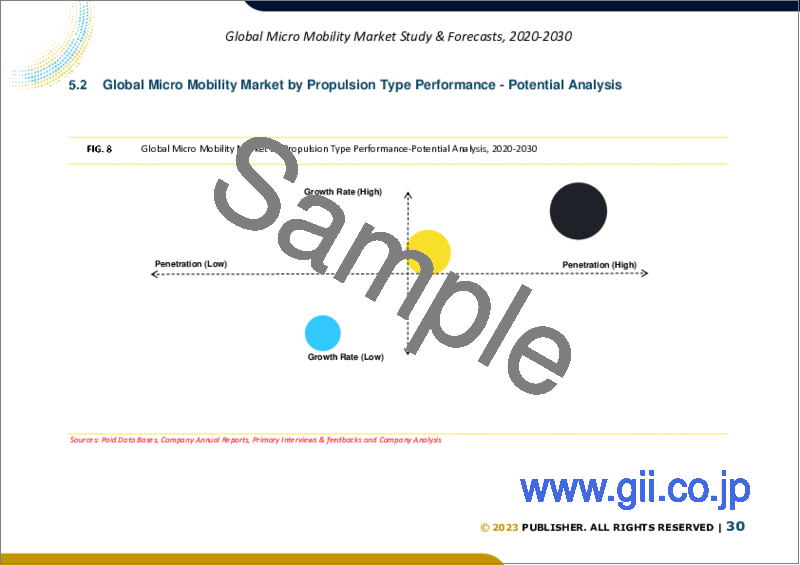
- マイクロモビリティの世界市場:推進タイプ別、実績 - ポテンシャル分析
- マイクロモビリティの世界市場:推進タイプ別推定・予測、2020-2030年
- マイクロモビリティ市場、サブセグメント分析
- 人力
- 電動
第6章 マイクロモビリティの世界市場:車両タイプ別
- 市場スナップショット
- マイクロモビリティの世界市場:車両タイプ別、実績 - ポテンシャル分析
- マイクロモビリティの世界市場:車両タイプ別推定・予測、2020-2030年
- マイクロモビリティ市場、サブセグメント分析
- Eキックスクーター
- 自転車
- スケートボード
- ホバーボード
- 低速EV
- その他
第7章 マイクロモビリティの世界市場:シェアリングタイプ別
- 市場スナップショット
- マイクロモビリティの世界市場:シェアリングタイプ別、実績 - ポテンシャル分析
- マイクロモビリティの世界市場:シェアリングタイプ別推定・予測、2020-2030年
- マイクロモビリティ市場、サブセグメント分析
- ドックあり
- ドックレス
第8章 マイクロモビリティの世界市場:年齢層別
- 市場スナップショット
- マイクロモビリティの世界市場:年齢層別、実績 - ポテンシャル分析
- マイクロモビリティの世界市場:年齢層別推定・予測、2020-2030年
- マイクロモビリティの世界市場、サブセグメント分析
- 5-34歳
- 35-54歳
- 55歳以上
第9章 マイクロモビリティの世界市場:地域別分析
- 主要国
- 主な新興国
- マイクロモビリティ市場の地域別市場スナップショット
- 北米
- 米国
- 推進タイプの推定・予測、2020-2030年
- 車両タイプの推定・予測、2020~2030年
- シェアリングタイプ別の推定・予測、2020~2030年
- 年齢層別推定・予測、2020~2030年
- カナダ
- 米国
- 欧州マイクロモビリティ市場スナップショット
- 英国
- ドイツ
- フランス
- スペイン
- イタリア
- その他欧州
- アジア太平洋マイクロモビリティ市場スナップショット
- 中国
- インド
- 日本
- オーストラリア
- 韓国
- その他アジア太平洋地域
- ラテンアメリカのマイクロモビリティ市場スナップショット
- ブラジル
- メキシコ
- 中東・アフリカ
- サウジアラビア
- 南アフリカ
- その他中東とアフリカ
第10章 競合情報
- 主要企業のSWOT分析
- 主要市場戦略
- 企業プロファイル
- Beam Mobility Holdings PTE. Ltd
- 主要情報
- 概要
- 財務(データの入手可能性によります)
- 製品概要
- 最近の動向
- Bird Global Inc.
- DOTT Services Ltd
- Electric feel
- Floatility GmbH
- Lime Chemicals Ltd.
- Neuron Energy Pvt Ltd.
- VOI Technology
- Yulu Bikes Pvt. Ltd
- Zagster
- Beam Mobility Holdings PTE. Ltd
第11章 調査プロセス
- 調査プロセス
- データマイニング
- 分析
- 市場推定
- 検証
- 出版
- 調査属性
- 調査前提条件
LIST OF TABLES
- TABLE 1. Global Micro Mobility Market, report scope
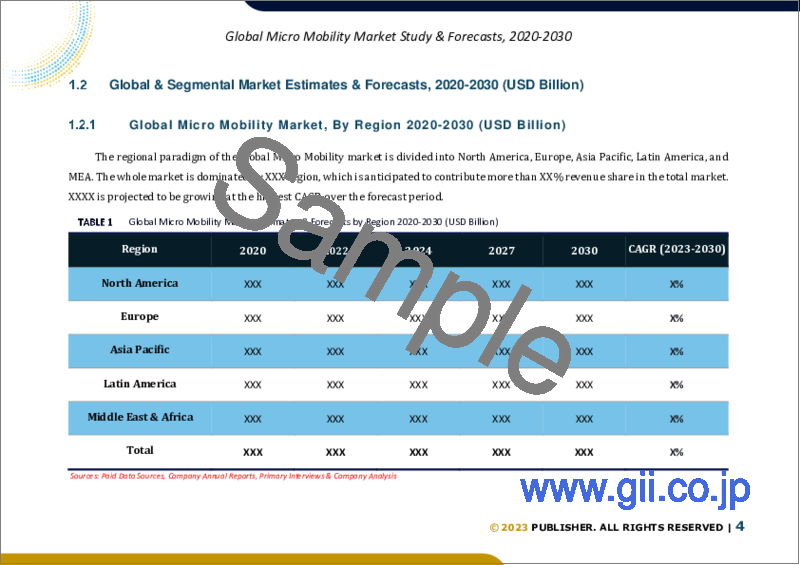
- TABLE 2. Global Micro Mobility Market estimates & forecasts by region 2020-2030 (USD Billion)
- TABLE 3. Global Micro Mobility Market estimates & forecasts by Propulsion Type 2020-2030 (USD Billion)
- TABLE 4. Global Micro Mobility Market estimates & forecasts by Vehicle Type 2020-2030 (USD Billion)
- TABLE 5. Global Micro Mobility Market estimates & forecasts by Sharing Type 2020-2030 (USD Billion)
- TABLE 6. Global Micro Mobility Market estimates & forecasts by Age Group 2020-2030 (USD Billion)
- TABLE 7. Global Micro Mobility Market by segment, estimates & forecasts, 2020-2030 (USD Billion)
- TABLE 8. Global Micro Mobility Market by region, estimates & forecasts, 2020-2030 (USD Billion)
- TABLE 9. Global Micro Mobility Market by segment, estimates & forecasts, 2020-2030 (USD Billion)
- TABLE 10. Global Micro Mobility Market by region, estimates & forecasts, 2020-2030 (USD Billion)
- TABLE 11. Global Micro Mobility Market by segment, estimates & forecasts, 2020-2030 (USD Billion)
- TABLE 12. Global Micro Mobility Market by region, estimates & forecasts, 2020-2030 (USD Billion)
- TABLE 13. Global Micro Mobility Market by segment, estimates & forecasts, 2020-2030 (USD Billion)
- TABLE 14. Global Micro Mobility Market by region, estimates & forecasts, 2020-2030 (USD Billion)
- TABLE 15. Global Micro Mobility Market by segment, estimates & forecasts, 2020-2030 (USD Billion)
- TABLE 16. Global Micro Mobility Market by region, estimates & forecasts, 2020-2030 (USD Billion)
- TABLE 17. U.S. Micro Mobility Market estimates & forecasts, 2020-2030 (USD Billion)
- TABLE 18. U.S. Micro Mobility Market estimates & forecasts by segment 2020-2030 (USD Billion)
- TABLE 19. U.S. Micro Mobility Market estimates & forecasts by segment 2020-2030 (USD Billion)
- TABLE 20. Canada Micro Mobility Market estimates & forecasts, 2020-2030 (USD Billion)
- TABLE 21. Canada Micro Mobility Market estimates & forecasts by segment 2020-2030 (USD Billion)
- TABLE 22. Canada Micro Mobility Market estimates & forecasts by segment 2020-2030 (USD Billion)
- TABLE 23. UK Micro Mobility Market estimates & forecasts, 2020-2030 (USD Billion)
- TABLE 24. UK Micro Mobility Market estimates & forecasts by segment 2020-2030 (USD Billion)
- TABLE 25. UK Micro Mobility Market estimates & forecasts by segment 2020-2030 (USD Billion)
- TABLE 26. Germany Micro Mobility Market estimates & forecasts, 2020-2030 (USD Billion)
- TABLE 27. Germany Micro Mobility Market estimates & forecasts by segment 2020-2030 (USD Billion)
- TABLE 28. Germany Micro Mobility Market estimates & forecasts by segment 2020-2030 (USD Billion)
- TABLE 29. France Micro Mobility Market estimates & forecasts, 2020-2030 (USD Billion)
- TABLE 30. France Micro Mobility Market estimates & forecasts by segment 2020-2030 (USD Billion)
- TABLE 31. France Micro Mobility Market estimates & forecasts by segment 2020-2030 (USD Billion)
- TABLE 32. Italy Micro Mobility Market estimates & forecasts, 2020-2030 (USD Billion)
- TABLE 33. Italy Micro Mobility Market estimates & forecasts by segment 2020-2030 (USD Billion)
- TABLE 34. Italy Micro Mobility Market estimates & forecasts by segment 2020-2030 (USD Billion)
- TABLE 35. Spain Micro Mobility Market estimates & forecasts, 2020-2030 (USD Billion)
- TABLE 36. Spain Micro Mobility Market estimates & forecasts by segment 2020-2030 (USD Billion)
- TABLE 37. Spain Micro Mobility Market estimates & forecasts by segment 2020-2030 (USD Billion)
- TABLE 38. RoE Micro Mobility Market estimates & forecasts, 2020-2030 (USD Billion)
- TABLE 39. RoE Micro Mobility Market estimates & forecasts by segment 2020-2030 (USD Billion)
- TABLE 40. RoE Micro Mobility Market estimates & forecasts by segment 2020-2030 (USD Billion)
- TABLE 41. China Micro Mobility Market estimates & forecasts, 2020-2030 (USD Billion)
- TABLE 42. China Micro Mobility Market estimates & forecasts by segment 2020-2030 (USD Billion)
- TABLE 43. China Micro Mobility Market estimates & forecasts by segment 2020-2030 (USD Billion)
- TABLE 44. India Micro Mobility Market estimates & forecasts, 2020-2030 (USD Billion)
- TABLE 45. India Micro Mobility Market estimates & forecasts by segment 2020-2030 (USD Billion)
- TABLE 46. India Micro Mobility Market estimates & forecasts by segment 2020-2030 (USD Billion)
- TABLE 47. Japan Micro Mobility Market estimates & forecasts, 2020-2030 (USD Billion)
- TABLE 48. Japan Micro Mobility Market estimates & forecasts by segment 2020-2030 (USD Billion)
- TABLE 49. Japan Micro Mobility Market estimates & forecasts by segment 2020-2030 (USD Billion)
- TABLE 50. South Korea Micro Mobility Market estimates & forecasts, 2020-2030 (USD Billion)
- TABLE 51. South Korea Micro Mobility Market estimates & forecasts by segment 2020-2030 (USD Billion)
- TABLE 52. South Korea Micro Mobility Market estimates & forecasts by segment 2020-2030 (USD Billion)
- TABLE 53. Australia Micro Mobility Market estimates & forecasts, 2020-2030 (USD Billion)
- TABLE 54. Australia Micro Mobility Market estimates & forecasts by segment 2020-2030 (USD Billion)
- TABLE 55. Australia Micro Mobility Market estimates & forecasts by segment 2020-2030 (USD Billion)
- TABLE 56. RoAPAC Micro Mobility Market estimates & forecasts, 2020-2030 (USD Billion)
- TABLE 57. RoAPAC Micro Mobility Market estimates & forecasts by segment 2020-2030 (USD Billion)
- TABLE 58. RoAPAC Micro Mobility Market estimates & forecasts by segment 2020-2030 (USD Billion)
- TABLE 59. Brazil Micro Mobility Market estimates & forecasts, 2020-2030 (USD Billion)
- TABLE 60. Brazil Micro Mobility Market estimates & forecasts by segment 2020-2030 (USD Billion)
- TABLE 61. Brazil Micro Mobility Market estimates & forecasts by segment 2020-2030 (USD Billion)
- TABLE 62. Mexico Micro Mobility Market estimates & forecasts, 2020-2030 (USD Billion)
- TABLE 63. Mexico Micro Mobility Market estimates & forecasts by segment 2020-2030 (USD Billion)
- TABLE 64. Mexico Micro Mobility Market estimates & forecasts by segment 2020-2030 (USD Billion)
- TABLE 65. RoLA Micro Mobility Market estimates & forecasts, 2020-2030 (USD Billion)
- TABLE 66. RoLA Micro Mobility Market estimates & forecasts by segment 2020-2030 (USD Billion)
- TABLE 67. RoLA Micro Mobility Market estimates & forecasts by segment 2020-2030 (USD Billion)
- TABLE 68. Saudi Arabia Micro Mobility Market estimates & forecasts, 2020-2030 (USD Billion)
- TABLE 69. South Africa Micro Mobility Market estimates & forecasts by segment 2020-2030 (USD Billion)
- TABLE 70. RoMEA Micro Mobility Market estimates & forecasts by segment 2020-2030 (USD Billion)
- TABLE 71. List of secondary sources, used in the study of global Micro Mobility Market
- TABLE 72. List of primary sources, used in the study of global Micro Mobility Market
- TABLE 73. Years considered for the study
- TABLE 74. Exchange rates considered
List of tables and figures are dummy in Propulsion Type, final lists may vary in the final deliverable
LIST OF FIGURES
- FIG 1. Global Micro Mobility Market, research methodology
- FIG 2. Global Micro Mobility Market, Market estimation techniques
- FIG 3. Global Market size estimates & forecast methods
- FIG 4. Global Micro Mobility Market, key trends 2022
- FIG 5. Global Micro Mobility Market, growth prospects 2023-2030
- FIG 6. Global Micro Mobility Market, porters 5 force model
- FIG 7. Global Micro Mobility Market, pest analysis
- FIG 8. Global Micro Mobility Market, value chain analysis
- FIG 9. Global Micro Mobility Market by segment, 2020 & 2030 (USD Billion)
- FIG 10. Global Micro Mobility Market by segment, 2020 & 2030 (USD Billion)
- FIG 11. Global Micro Mobility Market by segment, 2020 & 2030 (USD Billion)
- FIG 12. Global Micro Mobility Market by segment, 2020 & 2030 (USD Billion)
- FIG 13. Global Micro Mobility Market by segment, 2020 & 2030 (USD Billion)
- FIG 14. Global Micro Mobility Market, regional snapshot 2020 & 2030
- FIG 15. North America Micro Mobility Market 2020 & 2030 (USD Billion)
- FIG 16. Europe Micro Mobility Market 2020 & 2030 (USD Billion)
- FIG 17. Asia pacific Micro Mobility Market 2020 & 2030 (USD Billion)
- FIG 18. Latin America Micro Mobility Market 2020 & 2030 (USD Billion)
- FIG 19. Middle East & Africa Micro Mobility Market 2020 & 2030 (USD Billion)
List of tables and figures are dummy in Propulsion Type, final lists may vary in the final deliverable
Global Micro mobility Market is valued approximately at USD 59.46 billion in 2022 and is anticipated to grow with a healthy growth rate of more than 17.4% over the forecast period 2023-2030. Micro mobility encompasses a variety of compact and lightweight transportation options designed for short-distance commutes, typically covering distances of up to 10 kilometers. This category includes a diverse range of vehicles like bicycles, e-bikes, electric scooters, electric skateboards, shared bicycles, electric pedal-assisted bicycles, and more. These modes of transportation are characterized by their speed limit of 15 miles per hour (25 km/h) or less. The global micro mobility market is witnessing expansion attributed to the worldwide advancement of smart cities and vehicle infrastructure. Growth is propelled by various factors, including the rising demand for on-demand transportation services, government efforts to promote smart city initiatives, and increased venture capital investments. Also, the preference for carpool and bike pool services among office commuters contributes to the growth of ride-hailing and ride-sharing services.
The growing preference for bicycles as a convenient and affordable mode of transportation for short trips has resulted in an upsurge in the demand for micro mobility solutions. This increased demand for bicycles is a significant factor driving the market growth of micro mobility. According to Statista, the global bicycle sales are anticipated to experience substantial growth, nearly doubling from 2021 to 2027. With a market value of USD 38.4 billion in 2021, the bicycle industry is expected to continue its upward trajectory, reaching a projected value of USD 73.85 billion by 2027. Additionally, intelligent transportation system and supportive government initiatives for the development of bike-sharing infrastructure are expected to create numerous opportunities for the growth of the global micro mobility market across the globe. However, low internet penetration rate in developing regions stifles the market growth throughout the forecast period of 2023-2030.
The key regions considered for the Global Micro mobility Market study includes Asia Pacific, North America, Europe, Latin America, and Middle East & Africa. North America dominated the market in 2022 with largest market share owing to the expanding urban population, presence of key market players and the improved infrastructure of cities, which in turn promotes the use of public transportation. Asia Pacific is expected to fastest growing significantly during the forecast period, owing to increasing demand for vehicles across various sectors, cohesive government initiatives for smart cities, and rising preference for bicycles as a convenient and affordable mode of transportation.
Major market player included in this report are:
- Beam Mobility Holdings PTE. Ltd
- Bird Global Inc.
- DOTT Services Ltd.
- Electric feel
- Floatility GmbH
- Lime Chemicles Ltd.
- Neuron Energy Pvt Ltd.
- VOI Technology
- Yulu Bikes Pvt. Ltd
- Zagster
Recent Developments in the Market:
- In August 2022, Bird Global, Inc. has announced its expansion into several new cities across the United States. The company has revealed plans to enhance their shared e-mobility programs in cities such as San Diego, California; Memphis, Tennessee; Newark, New Jersey; Durham, North Carolina; and Louisville, Kentucky.
- In March 2022, Lime has partnered with Aspiration, a "sustainability as a service" platform, to provide riders with an effortless means to combat climate change. This collaboration enables Lime to actively contribute to decarbonization efforts by funding the planting of a tree through Aspiration's reforestation initiative for every ride taken. The partnership aligns Lime's mission with sustainable practices and supports their commitment to reducing carbon emissions.
Global Micro mobility Market Report Scope:
- Historical Data: 2020 - 2021
- Base Year for Estimation: 2022
- Forecast period: 2023-2030
- Report Coverage: Revenue forecast, Company Ranking, Competitive Landscape, Growth factors, and Trends
- Segments Covered: Propulsion Type, Vehicle Type, Sharing Type, Age Group, Region
- Regional Scope: North America; Europe; Asia Pacific; Latin America; Middle East & Africa
- Customization Scope: Free report customization (equivalent up to 8 analyst's working hours) with purchase. Addition or alteration to country, regional & segment scope*
The objective of the study is to define market sizes of different segments & countries in recent years and to forecast the values to the coming years. The report is designed to incorporate both qualitative and quantitative aspects of the industry within countries involved in the study.
The report also caters detailed information about the crucial aspects such as driving factors & challenges which will define the future growth of the market. Additionally, it also incorporates potential opportunities in micro markets for stakeholders to invest along with the detailed analysis of competitive landscape and product offerings of key players. The detailed segments and sub-segment of the market are explained below:
By Propulsion Type:
- Human Powered
- Electrically Powered
By Vehicle Type:
- E-kick scooters
- Bicycles
- Skateboards
- Hoverboard
- Low Speed EVs
- Others
By Sharing Type:
- Docked
- Dock-less
By Age Group:
- 5-34
- 35-54
- 55 and above
By Region:
- North America
- U.S.
- Canada
- Europe
- UK
- Germany
- France
- Spain
- Italy
- ROE
- Asia Pacific
- China
- India
- Japan
- Australia
- South Korea
- RoAPAC
- Latin America
- Brazil
- Mexico
- Middle East & Africa
- Saudi Arabia
- South Africa
- Rest of Middle East & Africa
Table of Contents
Chapter 1. Executive Summary
- 1.1. Market Snapshot
- 1.2. Global & Segmental Market Estimates & Forecasts, 2020-2030 (USD Billion)
- 1.2.1. Micro Mobility Market, by region, 2020-2030 (USD Billion)
- 1.2.2. Micro Mobility Market, by Propulsion Type, 2020-2030 (USD Billion)
- 1.2.3. Micro Mobility Market, by Vehicle Type, 2020-2030 (USD Billion)
- 1.2.4. Micro Mobility Market, by Sharing Type, 2020-2030 (USD Billion)
- 1.2.5. Micro Mobility Market, by Age Group, 2020-2030 (USD Billion)
- 1.3. Key Trends
- 1.4. Estimation Methodology
- 1.5. Research Assumption
Chapter 2. Global Micro Mobility Market Definition and Scope
- 2.1. Objective of the Study
- 2.2. Market Definition & Scope
- 2.2.1. Industry Evolution
- 2.2.2. Scope of the Study
- 2.3. Years Considered for the Study
- 2.4. Currency Conversion Rates
Chapter 3. Global Micro Mobility Market Dynamics
- 3.1. Micro Mobility Market Impact Analysis (2020-2030)
- 3.1.1. Market Drivers
- 3.1.1.1. Increasing development of smart cities and vehicle infrastructure
- 3.1.1.2. Growing popularity of on-demand transportation services
- 3.1.2. Market Challenges
- 3.1.2.1. Low rate of internet penetration
- 3.1.2.2. Increase in bike stealing or damage
- 3.1.3. Market Opportunities
- 3.1.3.1. Growing intelligent transportation system
- 3.1.3.2. Supportive government initiatives for the development of bike-sharing infrastructure
- 3.1.1. Market Drivers
Chapter 4. Global Micro Mobility Market: Industry Analysis
- 4.1. Porter's 5 Force Model
- 4.1.1. Bargaining Power of Suppliers
- 4.1.2. Bargaining Power of Buyers
- 4.1.3. Threat of New Entrants
- 4.1.4. Threat of Substitutes
- 4.1.5. Competitive Rivalry
- 4.2. Porter's 5 Force Impact Analysis
- 4.3. PEST Analysis
- 4.3.1. Political
- 4.3.2. Economic
- 4.3.3. Social
- 4.3.4. Technological
- 4.3.5. Environmental
- 4.3.6. Legal
- 4.4. Top investment opportunity
- 4.5. Top winning strategies
- 4.6. COVID-19 Impact Analysis
- 4.7. Disruptive Trends
- 4.8. Industry Expert Perspective
- 4.9. Analyst Recommendation & Conclusion
Chapter 5. Global Micro Mobility Market, by Propulsion Type
- 5.1. Market Snapshot
- 5.2. Global Micro Mobility Market by Propulsion Type, Performance - Potential Analysis
- 5.3. Global Micro Mobility Market Estimates & Forecasts by Propulsion Type 2020-2030 (USD Billion)
- 5.4. Micro Mobility Market, Sub Segment Analysis
- 5.4.1. Human Powered
- 5.4.2. Electrically Powered
Chapter 6. Global Micro Mobility Market, by Vehicle Type
- 6.1. Market Snapshot
- 6.2. Global Micro Mobility Market by Vehicle Type, Performance - Potential Analysis
- 6.3. Global Micro Mobility Market Estimates & Forecasts by Vehicle Type 2020-2030 (USD Billion)
- 6.4. Micro Mobility Market, Sub Segment Analysis
- 6.4.1. E-kick scooters
- 6.4.2. Bicycles
- 6.4.3. Skateboards
- 6.4.4. Hoverboard
- 6.4.5. Low Speed EVs
- 6.4.6. Others
Chapter 7. Global Micro Mobility Market, by Sharing Type
- 7.1. Market Snapshot
- 7.2. Global Micro Mobility Market by Sharing Type, Performance - Potential Analysis
- 7.3. Global Micro Mobility Market Estimates & Forecasts by Sharing Type 2020-2030 (USD Billion)
- 7.4. Micro Mobility Market, Sub Segment Analysis
- 7.4.1. Docked
- 7.4.2. Dock-less
Chapter 8. Global Micro Mobility Market, by Age Group
- 8.1. Market Snapshot
- 8.2. Global Micro Mobility Market by Age Group, Performance - Potential Analysis
- 8.3. Global Micro Mobility Market Estimates & Forecasts by Age Group 2020-2030 (USD Billion)
- 8.4. Micro Mobility Market, Sub Segment Analysis
- 8.4.1. 5-34
- 8.4.2. 35-54
- 8.4.3. 55 and above
Chapter 9. Global Micro Mobility Market, Regional Analysis
- 9.1. Top Leading Countries
- 9.2. Top Emerging Countries
- 9.3. Micro Mobility Market, Regional Market Snapshot
- 9.4. North America Micro Mobility Market
- 9.4.1. U.S. Micro Mobility Market
- 9.4.1.1. Propulsion Type breakdown estimates & forecasts, 2020-2030
- 9.4.1.2. Vehicle Type breakdown estimates & forecasts, 2020-2030
- 9.4.1.3. Sharing Type breakdown estimates & forecasts, 2020-2030
- 9.4.1.4. Age Group breakdown estimates & forecasts, 2020-2030
- 9.4.2. Canada Micro Mobility Market
- 9.4.1. U.S. Micro Mobility Market
- 9.5. Europe Micro Mobility Market Snapshot
- 9.5.1. U.K. Micro Mobility Market
- 9.5.2. Germany Micro Mobility Market
- 9.5.3. France Micro Mobility Market
- 9.5.4. Spain Micro Mobility Market
- 9.5.5. Italy Micro Mobility Market
- 9.5.6. Rest of Europe Micro Mobility Market
- 9.6. Asia-Pacific Micro Mobility Market Snapshot
- 9.6.1. China Micro Mobility Market
- 9.6.2. India Micro Mobility Market
- 9.6.3. Japan Micro Mobility Market
- 9.6.4. Australia Micro Mobility Market
- 9.6.5. South Korea Micro Mobility Market
- 9.6.6. Rest of Asia Pacific Micro Mobility Market
- 9.7. Latin America Micro Mobility Market Snapshot
- 9.7.1. Brazil Micro Mobility Market
- 9.7.2. Mexico Micro Mobility Market
- 9.8. Middle East & Africa Micro Mobility Market
- 9.8.1. Saudi Arabia Micro Mobility Market
- 9.8.2. South Africa Micro Mobility Market
- 9.8.3. Rest of Middle East & Africa Micro Mobility Market
Chapter 10. Competitive Intelligence
- 10.1. Key Company SWOT Analysis
- 10.1.1. Company 1
- 10.1.2. Company 2
- 10.1.3. Company 3
- 10.2. Top Market Strategies
- 10.3. Company Profiles
- 10.3.1. Beam Mobility Holdings PTE. Ltd
- 10.3.1.1. Key Information
- 10.3.1.2. Overview
- 10.3.1.3. Financial (Subject to Data Availability)
- 10.3.1.4. Product Summary
- 10.3.1.5. Recent Developments
- 10.3.2. Bird Global Inc.
- 10.3.3. DOTT Services Ltd
- 10.3.4. Electric feel
- 10.3.5. Floatility GmbH
- 10.3.6. Lime Chemicals Ltd.
- 10.3.7. Neuron Energy Pvt Ltd.
- 10.3.8. VOI Technology
- 10.3.9. Yulu Bikes Pvt. Ltd
- 10.3.10. Zagster
- 10.3.1. Beam Mobility Holdings PTE. Ltd
Chapter 11. Research Process
- 11.1. Research Process
- 11.1.1. Data Mining
- 11.1.2. Analysis
- 11.1.3. Market Estimation
- 11.1.4. Validation
- 11.1.5. Publishing
- 11.2. Research Attributes
- 11.3. Research Assumption
