|
|
市場調査レポート
商品コード
1269742
自律走行シャトルの世界市場規模調査&予測:自律性のレベル別(完全、準、ハイブリッド、部分)、座席数別(5人未満、5~10人、10人以上)、地域別分析、2022~2029年Global Autonomous Shuttle Market Size study & Forecast, by Level of Autonomy (Fully, Semi, Hybrid, Partial) By Seating Capacity (under 5, 5 to 10, More than 10) and Regional Analysis, 2022-2029 |
||||||
|
|
|||||||
|
● お客様のご希望に応じて、既存データの加工や未掲載情報(例:国別セグメント)の追加などの対応が可能です。 詳細はお問い合わせください。 |
|||||||


| 自律走行シャトルの世界市場規模調査&予測:自律性のレベル別(完全、準、ハイブリッド、部分)、座席数別(5人未満、5~10人、10人以上)、地域別分析、2022~2029年 |
|
出版日: 2023年05月05日
発行: Bizwit Research & Consulting LLP
ページ情報: 英文
納期: 2~3営業日
|
- 全表示
- 概要
- 図表
- 目次
自律走行シャトルとは、キャンパス内や都市の特定のエリア内など、通常、固定ルートで運行する自動運転車のことです。
このシャトルは電気自動車であることが多く、人間の運転手を必要とせずに乗客を運ぶように設計されています。自律走行シャトルは、カメラ、ライダー、レーダーなどのさまざまなセンサーを使用して、周囲の障害物を回避しながら走行します。自律走行シャトル市場は、自律走行車の需要の増加や、OEMや自律走行スタートアップの存在意義の高まりなどの要因で拡大しています。
自律走行シャトルは、都市部におけるモビリティの向上と渋滞の緩和を実現するとともに、環境に優しい交通手段を提供する可能性を持っています。公共交通機関のハブとの往復や、通勤客のラストワンマイル輸送に利用されることもあります。この数十年の間に、その普及率は徐々に高まっています。Statistaによると、世界の自律走行車市場は2021年に270億米ドル以上と評価されました。2026年には最大620億米ドルに達すると予想されています。さらに、2030年には、これらの自動車の世界販売台数は約5,800万台の値に達すると予測されています。スペースの増加を促進するもう一つの重要な要素は、OEMと自律型スタートアップ企業です。Statistaによると、世界の自動車部品メーカーの時価総額は、2020年に約1兆5,000億米ドルに達しています。日本の自動車メーカーであるトヨタとデンソーは、それぞれ世界最大のOEMとサプライヤーの1つです。また、2022年4月時点で、アメリカの自律走行車会社Cruiseは、自律走行分野のスタートアップとして世界で最も資金を集めている企業でした。同社はこれまでに84億7,000万米ドルの資金を獲得しています。また、環境問題への関心の高まりや交通安全意識の高まりは、予測期間中、市場に有利な成長展望をもたらすでしょう。しかし、自律走行シャトルのコストが高いことが、2022年から2029年の予測期間を通じて市場の成長を阻害します。
自律走行シャトルの世界市場調査において考慮された主要地域は、アジア太平洋地域、北米、欧州、中南米、その他の地域です。北米は、主要な市場プレイヤーの存在により、収益面で市場を独占しています。また、アジア太平洋地域は、主要プレイヤーの地理的拡大、政府機関の積極的な市場参入などの要因により、予測期間中に最も高いCAGRで成長すると予想されます。
本調査の目的は、近年におけるさまざまなセグメントと国の市場規模を明らかにし、今後数年間の市場規模を予測することにあります。本レポートは、調査対象国において、業界の質的・量的な側面を取り入れるよう設計されています。
また、市場の将来的な成長を規定する促進要因や課題など、重要な側面に関する詳細情報も提供しています。さらに、主要企業の競合情勢や製品提供の詳細な分析とともに、利害関係者が投資するためのミクロ市場での潜在的な機会も組み込んでいます。
目次
第1章 エグゼクティブサマリー
- 市場スナップショット
- 世界・セグメント別市場推定・予測、2019年~2029年
- 自律走行シャトル市場、地域別、2019-2029年
- 自律走行シャトル市場、自律性のレベル別、2019-2029年
- 自律走行シャトル市場、座席数別、2019年~2029年
- 主な動向
- 調査手法
- 調査の前提条件
第2章 自律走行シャトルの世界市場の定義と範囲
- 調査目的
- 市場の定義と範囲
- 調査対象範囲
- 産業の進化
- 本調査の対象となった年
- 通貨換算レート
第3章 自律走行シャトルの世界市場力学
- 自律走行シャトル市場の影響分析(2019-2029)自律型スタートアップ
- 市場促進要因
- 自律走行車の需要増
- OEMの重要性の高まりと
- 市場の課題
- 自律走行シャトルの高いコスト
- 市場機会
- 高まる環境問題への関心
- 交通安全意識の高まり
- クルマの安全・安心に対する意識の高まり
- 市場促進要因
第4章 世界の自律走行シャトル市場産業分析
- ポーターの5フォースモデル
- 供給企業の交渉力
- 買い手の交渉力
- 新規参入業者の脅威
- 代替品の脅威
- 競争企業間の敵対関係
- ポーターの5フォースモデルへの未来的アプローチ(2019-2029年)
- PEST分析
- 政治的
- 経済的
- ソーシャル
- テクニカル
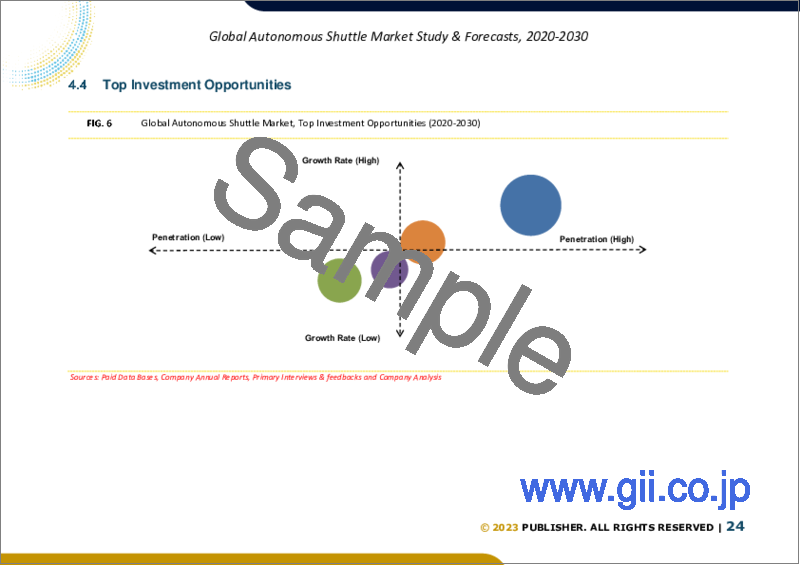
- 主な投資機会
- 主要成功戦略
- 業界関係者見通し
- アナリストの提言と結論
第5章 リスク評価:COVID-19の影響
- COVID-19が業界に与える全体的な影響についての評価
- COVID-19以前とCOVID-19以後の市場シナリオ
第6章 自律走行シャトルの世界市場:自律性のレベル別
- 市場スナップショット
- 自律走行シャトルの世界市場:自律性のレベル、実績 - ポテンシャル分析
- 自律走行シャトルの世界市場推定・予測(自律性レベル別) 2019-2029
- 自律走行シャトル市場、サブセグメント分析
- 完全
- 準
- ハイブリッド
- 部分的
第7章 自律走行シャトルの世界市場:座席数別
- 市場スナップショット
- 自律走行シャトルの世界市場:座席数、実績 - ポテンシャル分析
- 自律走行シャトルの世界市場推定・予測(座席数別) 2019-2029
- 自律走行シャトル市場、サブセグメント分析
- 5人未満
- 5~10人
- 10人以上
第8章 自律走行シャトルの世界市場:地域別分析
- 自律走行シャトル市場、地域別市場スナップショット
- 北米
- 米国
- 自律性のレベル別の推定・予測、2019-2029年
- 座席数別の推定・予測、2019年~2029年
- カナダ
- 米国
- 欧州の自律走行シャトル市場スナップショット
- 英国
- ドイツ
- フランス
- スペイン
- イタリア
- その他欧州
- アジア太平洋の自律走行シャトル市場スナップショット
- 中国
- インド
- 日本
- オーストラリア
- 韓国
- その他アジア太平洋地域
- ラテンアメリカの自律走行シャトル市場スナップショット
- ブラジル
- メキシコ
- その他ラテンアメリカ地域
- 世界のその他の地域
第9章 競合情報
- 主要市場戦略
- 企業プロファイル
- Aptiv Inc
- 主要な情報
- 概要
- 財務(データの入手が可能な場合のみ)
- 製品概要
- 最近の動向
- Robert Bosch GmbH
- Continental AG
- ZF Friedrichshafen AG
- Google LLC
- Visteon Corporation
- Cisco Systems Inc
- Denso Corporation
- Delphi Inc.
- Valeo S.A.
- Aptiv Inc
第10章 調査プロセス
- 調査プロセス
- データマイニング
- 分析
- 市場推定
- バリデーション
- 出版
- 調査の特徴
- 調査の前提条件
LIST OF TABLES
- TABLE 1. Global Autonomous Shuttle Market, report scope
- TABLE 2. Global Autonomous Shuttle Market estimates & forecasts by Region 2019-2029 (USD Billion)
- TABLE 3. Global Autonomous Shuttle Market estimates & forecasts by Level of Autonomy 2019-2029 (USD Billion)
- TABLE 4. Global Autonomous Shuttle Market estimates & forecasts by Seating capacity 2019-2029 (USD Billion)
- TABLE 5. Global Autonomous Shuttle Market by segment, estimates & forecasts, 2019-2029 (USD Billion)
- TABLE 6. Global Autonomous Shuttle Market by region, estimates & forecasts, 2019-2029 (USD Billion)
- TABLE 7. Global Autonomous Shuttle Market by segment, estimates & forecasts, 2019-2029 (USD Billion)
- TABLE 8. Global Autonomous Shuttle Market by region, estimates & forecasts, 2019-2029 (USD Billion)
- TABLE 9. Global Autonomous Shuttle Market by segment, estimates & forecasts, 2019-2029 (USD Billion)
- TABLE 10. Global Autonomous Shuttle Market by region, estimates & forecasts, 2019-2029 (USD Billion)
- TABLE 11. Global Autonomous Shuttle Market by segment, estimates & forecasts, 2019-2029 (USD Billion)
- TABLE 12. Global Autonomous Shuttle Market by region, estimates & forecasts, 2019-2029 (USD Billion)
- TABLE 13. Global Autonomous Shuttle Market by segment, estimates & forecasts, 2019-2029 (USD Billion)
- TABLE 14. Global Autonomous Shuttle Market by region, estimates & forecasts, 2019-2029 (USD Billion)
- TABLE 15. U.S. Autonomous Shuttle Market estimates & forecasts, 2019-2029 (USD Billion)
- TABLE 16. U.S. Autonomous Shuttle Market estimates & forecasts by segment 2019-2029 (USD Billion)
- TABLE 17. U.S. Autonomous Shuttle Market estimates & forecasts by segment 2019-2029 (USD Billion)
- TABLE 18. Canada Autonomous Shuttle Market estimates & forecasts, 2019-2029 (USD Billion)
- TABLE 19. Canada Autonomous Shuttle Market estimates & forecasts by segment 2019-2029 (USD Billion)
- TABLE 20. Canada Autonomous Shuttle Market estimates & forecasts by segment 2019-2029 (USD Billion)
- TABLE 21. UK Autonomous Shuttle Market estimates & forecasts, 2019-2029 (USD Billion)
- TABLE 22. UK Autonomous Shuttle Market estimates & forecasts by segment 2019-2029 (USD Billion)
- TABLE 23. UK Autonomous Shuttle Market estimates & forecasts by segment 2019-2029 (USD Billion)
- TABLE 24. Germany Autonomous Shuttle Market estimates & forecasts, 2019-2029 (USD Billion)
- TABLE 25. Germany Autonomous Shuttle Market estimates & forecasts by segment 2019-2029 (USD Billion)
- TABLE 26. Germany Autonomous Shuttle Market estimates & forecasts by segment 2019-2029 (USD Billion)
- TABLE 27. France Autonomous Shuttle Market estimates & forecasts, 2019-2029 (USD Billion)
- TABLE 28. France Autonomous Shuttle Market estimates & forecasts by segment 2019-2029 (USD Billion)
- TABLE 29. France Autonomous Shuttle Market estimates & forecasts by segment 2019-2029 (USD Billion)
- TABLE 30. Italy Autonomous Shuttle Market estimates & forecasts, 2019-2029 (USD Billion)
- TABLE 31. Italy Autonomous Shuttle Market estimates & forecasts by segment 2019-2029 (USD Billion)
- TABLE 32. Italy Autonomous Shuttle Market estimates & forecasts by segment 2019-2029 (USD Billion)
- TABLE 33. Spain Autonomous Shuttle Market estimates & forecasts, 2019-2029 (USD Billion)
- TABLE 34. Spain Autonomous Shuttle Market estimates & forecasts by segment 2019-2029 (USD Billion)
- TABLE 35. Spain Autonomous Shuttle Market estimates & forecasts by segment 2019-2029 (USD Billion)
- TABLE 36. RoE Autonomous Shuttle Market estimates & forecasts, 2019-2029 (USD Billion)
- TABLE 37. RoE Autonomous Shuttle Market estimates & forecasts by segment 2019-2029 (USD Billion)
- TABLE 38. RoE Autonomous Shuttle Market estimates & forecasts by segment 2019-2029 (USD Billion)
- TABLE 39. China Autonomous Shuttle Market estimates & forecasts, 2019-2029 (USD Billion)
- TABLE 40. China Autonomous Shuttle Market estimates & forecasts by segment 2019-2029 (USD Billion)
- TABLE 41. China Autonomous Shuttle Market estimates & forecasts by segment 2019-2029 (USD Billion)
- TABLE 42. India Autonomous Shuttle Market estimates & forecasts, 2019-2029 (USD Billion)
- TABLE 43. India Autonomous Shuttle Market estimates & forecasts by segment 2019-2029 (USD Billion)
- TABLE 44. India Autonomous Shuttle Market estimates & forecasts by segment 2019-2029 (USD Billion)
- TABLE 45. Japan Autonomous Shuttle Market estimates & forecasts, 2019-2029 (USD Billion)
- TABLE 46. Japan Autonomous Shuttle Market estimates & forecasts by segment 2019-2029 (USD Billion)
- TABLE 47. Japan Autonomous Shuttle Market estimates & forecasts by segment 2019-2029 (USD Billion)
- TABLE 48. South Korea Autonomous Shuttle Market estimates & forecasts, 2019-2029 (USD Billion)
- TABLE 49. South Korea Autonomous Shuttle Market estimates & forecasts by segment 2019-2029 (USD Billion)
- TABLE 50. South Korea Autonomous Shuttle Market estimates & forecasts by segment 2019-2029 (USD Billion)
- TABLE 51. Australia Autonomous Shuttle Market estimates & forecasts, 2019-2029 (USD Billion)
- TABLE 52. Australia Autonomous Shuttle Market estimates & forecasts by segment 2019-2029 (USD Billion)
- TABLE 53. Australia Autonomous Shuttle Market estimates & forecasts by segment 2019-2029 (USD Billion)
- TABLE 54. RoAPAC Autonomous Shuttle Market estimates & forecasts, 2019-2029 (USD Billion)
- TABLE 55. RoAPAC Autonomous Shuttle Market estimates & forecasts by segment 2019-2029 (USD Billion)
- TABLE 56. RoAPAC Autonomous Shuttle Market estimates & forecasts by segment 2019-2029 (USD Billion)
- TABLE 57. Brazil Autonomous Shuttle Market estimates & forecasts, 2019-2029 (USD Billion)
- TABLE 58. Brazil Autonomous Shuttle Market estimates & forecasts by segment 2019-2029 (USD Billion)
- TABLE 59. Brazil Autonomous Shuttle Market estimates & forecasts by segment 2019-2029 (USD Billion)
- TABLE 60. Mexico Autonomous Shuttle Market estimates & forecasts, 2019-2029 (USD Billion)
- TABLE 61. Mexico Autonomous Shuttle Market estimates & forecasts by segment 2019-2029 (USD Billion)
- TABLE 62. Mexico Autonomous Shuttle Market estimates & forecasts by segment 2019-2029 (USD Billion)
- TABLE 63. RoLA Autonomous Shuttle Market estimates & forecasts, 2019-2029 (USD Billion)
- TABLE 64. RoLA Autonomous Shuttle Market estimates & forecasts by segment 2019-2029 (USD Billion)
- TABLE 65. RoLA Autonomous Shuttle Market estimates & forecasts by segment 2019-2029 (USD Billion)
- TABLE 66. Row Autonomous Shuttle Market estimates & forecasts, 2019-2029 (USD Billion)
- TABLE 67. Row Autonomous Shuttle Market estimates & forecasts by segment 2019-2029 (USD Billion)
- TABLE 68. Row Autonomous Shuttle Market estimates & forecasts by segment 2019-2029 (USD Billion)
- TABLE 69. List of secondary sources, used in the study of global Autonomous Shuttle Market
- TABLE 70. List of primary sources, used in the study of global Autonomous Shuttle Market
- TABLE 71. Years considered for the study
- TABLE 72. Exchange rates considered
List of tables and figures and dummy in nature, final lists may vary in the final deliverable
LIST OF FIGURES
List of figures
- FIG 1. Global Autonomous Shuttle Market, research methodology
- FIG 2. Global Autonomous Shuttle Market, Market estimation techniques
- FIG 3. Global Market size estimates & forecast methods
- FIG 4. Global Autonomous Shuttle Market, key trends 2021
- FIG 5. Global Autonomous Shuttle Market, growth prospects 2022-2029
- FIG 6. Global Autonomous Shuttle Market, porters 5 force model
- FIG 7. Global Autonomous Shuttle Market, pest analysis
- FIG 8. Global Autonomous Shuttle Market, value chain analysis
- FIG 9. Global Autonomous Shuttle Market by segment, 2019 & 2029 (USD Billion)
- FIG 10. Global Autonomous Shuttle Market by segment, 2019 & 2029 (USD Billion)
- FIG 11. Global Autonomous Shuttle Market by segment, 2019 & 2029 (USD Billion)
- FIG 12. Global Autonomous Shuttle Market by segment, 2019 & 2029 (USD Billion)
- FIG 13. Global Autonomous Shuttle Market by segment, 2019 & 2029 (USD Billion)
- FIG 14. Global Autonomous Shuttle Market, regional snapshot 2019 & 2029
- FIG 15. North America Autonomous Shuttle Market 2019 & 2029 (USD Billion)
- FIG 16. Europe Autonomous Shuttle Market 2019 & 2029 (USD Billion)
- FIG 17. Asia pacific Autonomous Shuttle Market 2019 & 2029 (USD Billion)
- FIG 18. Latin America Autonomous Shuttle Market 2019 & 2029 (USD Billion)
- FIG 19. Global Autonomous Shuttle Market, company Market share analysis (2021)
List of tables and figures and dummy in nature, final lists may vary in the final deliverable
Global Autonomous Shuttle Market is valued at approximately USD xxx billion in 2021 and is anticipated to grow with a healthy growth rate of more than xxx% over the forecast period 2022-2029. An autonomous shuttle is a self-driving vehicle that typically operates on a fixed route, such as on a campus or within a particular area of a city. These shuttles are often electric and are designed to transport passengers without the need for a human driver. Autonomous shuttles use a variety of sensors, including cameras, lidar, and radar, to navigate and avoid obstacles in their environment. The Autonomous Shuttle market is expanding because of factors such as an increase in the demand for autonomous vehicles and the growing significance of OEMs and autonomous startups.
Autonomous shuttles have the potential to improve mobility and reduce congestion in urban areas, while also providing an eco-friendly transportation option. They can be used to transport people to and from public transit hubs or to provide last-mile transportation for commuters. Its prevalence has progressively increased during the last few decades. According to Statista, the global autonomous car market was valued at over USD 27 billion in 2021. The market is expected to reach up to USD 62 billion by 2026. Furthermore, in 2030, the global sales of these vehicles are projected to reach a value of around 58 million units. Another important component driving space increase is OEMs and autonomous startups. According to Statista, the market capitalization of the world's automotive original equipment manufacturers has reached about USD 1.5 trillion in 2020. Japanese automotive manufacturers Toyota and Denso were among the world's largest OEMs and suppliers, respectively. In addition, As of April 2022, the American autonomous vehicle company Cruise was the most well-funded startup in the field of autonomous driving worldwide. The company has received USD 8.47 billion in funding so far. Also, growing environmental concerns and rising road safety awareness would create a lucrative growth prospectus for the market over the forecast period. However, the high cost of autonomous shuttles stifles market growth throughout the forecast period of 2022-2029.
The key regions considered for the Global Autonomous Shuttle Market study includes Asia Pacific, North America, Europe, Latin America, and Rest of the World. North America dominated the market in terms of revenue, owing to the presence of key market players. Furthermore, Asia Pacific is expected to grow with the highest CAGR during the forecast period, owing to factors such as the geographic expansion of key players, and active participation of government organizations in the market space.
Major market player included in this report are:
- Aptiv Inc.
- Robert Bosch GmbH
- Continental AG
- ZF Friedrichshafen AG
- Google LLC
- Visteon Corporation
- Cisco Systems Inc
- Denso Corporation
- Delphi Inc.
- Valeo S.A.
Recent Developments in the Market:
- In August 2020, Hyundai collaborates with Aptiv on a project called Motional. The new joint venture, in which both parties own 50% of the new company. The goal of their new venture is to develop Level 4 and Level 5 commercial-ready self-driving systems and makes them available to robotaxi and fleet operators, as well as other automakers, by the year 2022.
Global Autonomous Shuttle Market Report Scope:
- Historical Data 2019-2020-2021
- Base Year for Estimation 2021
- Forecast period 2022-2029
- Report Coverage Revenue forecast, Company Ranking, Competitive Landscape, Growth factors, and Trends
- Segments Covered Level of Autonomy, Seating capacity, Region
- Regional Scope North America; Europe; Asia Pacific; Latin America; Rest of the World
- Customization Scope Free report customization (equivalent up to 8 analyst's working hours) with purchase. Addition or alteration to country, regional & segment scope*
The objective of the study is to define market sizes of different segments & countries in recent years and to forecast the values to the coming years. The report is designed to incorporate both qualitative and quantitative aspects of the industry within countries involved in the study.
The report also caters detailed information about the crucial aspects such as driving factors & challenges which will define the future growth of the market. Additionally, it also incorporates potential opportunities in micro markets for stakeholders to invest along with the detailed analysis of competitive landscape and product offerings of key players. The detailed segments and sub-segment of the market are explained below.
By Level of Autonomy
- Fully
- Semi
- Hybrid
- Partial
- By Seating capacity
- under 5
- 5 to 10
- More than 10
By Region:
- North America
- U.S.
- Canada
- Europe
- UK
- Germany
- France
- Spain
- Italy
- ROE
- Asia Pacific
- China
- India
- Japan
- Australia
- South Korea
- RoAPAC
- Latin America
- Brazil
- Mexico
- RoLA
- Rest of the World
Table of Contents
Chapter 1. Executive Summary
- 1.1. Market Snapshot
- 1.2. Global & Segmental Market Estimates & Forecasts, 2019-2029 (USD Billion)
- 1.2.1. Autonomous Shuttle Market, by Region, 2019-2029 (USD Billion)
- 1.2.2. Autonomous Shuttle Market, by Level of Autonomy, 2019-2029 (USD Billion)
- 1.2.3. Autonomous Shuttle Market, by Seating Capacity, 2019-2029 (USD Billion)
- 1.3. Key Trends
- 1.4. Estimation Methodology
- 1.5. Research Assumption
Chapter 2. Global Autonomous Shuttle Market Definition and Scope
- 2.1. Objective of the Study
- 2.2. Market Definition & Scope
- 2.2.1. Scope of the Study
- 2.2.2. Industry Evolution
- 2.3. Years Considered for the Study
- 2.4. Currency Conversion Rates
Chapter 3. Global Autonomous Shuttle Market Dynamics
- 3.1. Autonomous Shuttle Market Impact Analysis (2019-2029) autonomous startups.
- 3.1.1. Market Drivers
- 3.1.1.1. Increase in the demand for autonomous vehicles.
- 3.1.1.2. Growing significance of OEMs and
- 3.1.2. Market Challenges
- 3.1.2.1. High Cost of Autonomous Shuttle
- 3.1.3. Market Opportunities
- 3.1.3.1. Growing environmental concerns.
- 3.1.3.2. Rising road safety awareness
- 3.1.1. Market Drivers
- 3.1.3.3. Rising awareness about safety and security of vehicles
Chapter 4. Global Autonomous Shuttle Market Industry Analysis
- 4.1. Porter's 5 Force Model
- 4.1.1. Bargaining Power of Suppliers
- 4.1.2. Bargaining Power of Buyers
- 4.1.3. Threat of New Entrants
- 4.1.4. Threat of Substitutes
- 4.1.5. Competitive Rivalry
- 4.2. Futuristic Approach to Porter's 5 Force Model (2019-2029)
- 4.3. PEST Analysis
- 4.3.1. Political
- 4.3.2. Economical
- 4.3.3. Social
- 4.3.4. Technological
- 4.4. Top investment opportunity
- 4.5. Top winning strategies
- 4.6. Industry Experts Prospective
- 4.7. Analyst Recommendation & Conclusion
Chapter 5. Risk Assessment: COVID-19 Impact
- 5.1. Assessment of the overall impact of COVID-19 on the industry
- 5.2. Pre COVID-19 and post COVID-19 Market scenario
Chapter 6. Global Autonomous Shuttle Market, by Level of Autonomy
- 6.1. Market Snapshot
- 6.2. Global Autonomous Shuttle Market by Level of Autonomy, Performance - Potential Analysis
- 6.3. Global Autonomous Shuttle Market Estimates & Forecasts by Level of Autonomy 2019-2029 (USD Billion)
- 6.4. Autonomous Shuttle Market, Sub Segment Analysis
- 6.4.1. Fully
- 6.4.2. Semi
- 6.4.3. Hybrid
- 6.4.4. Partial
Chapter 7. Global Autonomous Shuttle Market, by Seating capacity
- 7.1. Market Snapshot
- 7.2. Global Autonomous Shuttle Market by Seating capacity, Performance - Potential Analysis
- 7.3. Global Autonomous Shuttle Market Estimates & Forecasts by Seating capacity 2019-2029 (USD Billion)
- 7.4. Autonomous Shuttle Market, Sub Segment Analysis
- 7.4.1. under 5
- 7.4.2. 5 to 10
- 7.4.3. More than 10
Chapter 8. Global Autonomous Shuttle Market, Regional Analysis
- 8.1. Autonomous Shuttle Market, Regional Market Snapshot
- 8.2. North America Autonomous Shuttle Market
- 8.2.1. U.S. Autonomous Shuttle Market
- 8.2.1.1. Level of Autonomy breakdown estimates & forecasts, 2019-2029
- 8.2.1.2. Seating capacity breakdown estimates & forecasts, 2019-2029
- 8.2.2. Canada Autonomous Shuttle Market
- 8.2.1. U.S. Autonomous Shuttle Market
- 8.3. Europe Autonomous Shuttle Market Snapshot
- 8.3.1. U.K. Autonomous Shuttle Market
- 8.3.2. Germany Autonomous Shuttle Market
- 8.3.3. France Autonomous Shuttle Market
- 8.3.4. Spain Autonomous Shuttle Market
- 8.3.5. Italy Autonomous Shuttle Market
- 8.3.6. Rest of Europe Autonomous Shuttle Market
- 8.4. Asia-Pacific Autonomous Shuttle Market Snapshot
- 8.4.1. China Autonomous Shuttle Market
- 8.4.2. India Autonomous Shuttle Market
- 8.4.3. Japan Autonomous Shuttle Market
- 8.4.4. Australia Autonomous Shuttle Market
- 8.4.5. South Korea Autonomous Shuttle Market
- 8.4.6. Rest of Asia Pacific Autonomous Shuttle Market
- 8.5. Latin America Autonomous Shuttle Market Snapshot
- 8.5.1. Brazil Autonomous Shuttle Market
- 8.5.2. Mexico Autonomous Shuttle Market
- 8.5.3. Rest of Latin America Autonomous Shuttle Market
- 8.6. Rest of The World Autonomous Shuttle Market
Chapter 9. Competitive Intelligence
- 9.1. Top Market Strategies
- 9.2. Company Profiles
- 9.2.1. Aptiv Inc
- 9.2.1.1. Key Information
- 9.2.1.2. Overview
- 9.2.1.3. Financial (Subject to Data Availability)
- 9.2.1.4. Product Summary
- 9.2.1.5. Recent Developments
- 9.2.2. Robert Bosch GmbH
- 9.2.3. Continental AG
- 9.2.4. ZF Friedrichshafen AG
- 9.2.5. Google LLC
- 9.2.6. Visteon Corporation
- 9.2.7. Cisco Systems Inc
- 9.2.8. Denso Corporation
- 9.2.9. Delphi Inc.
- 9.2.10. Valeo S.A.
- 9.2.1. Aptiv Inc
Chapter 10. Research Process
- 10.1. Research Process
- 10.1.1. Data Mining
- 10.1.2. Analysis
- 10.1.3. Market Estimation
- 10.1.4. Validation
- 10.1.5. Publishing
- 10.2. Research Attributes
- 10.3. Research Assumption