|
|
市場調査レポート
商品コード
1269605
グラフェンエレクトロニクスの世界市場規模の調査・予測、製品別、業界別・地域別分析、2022-2029年Global Graphene Electronics Market Size study & Forecast, by Product by Industry Vertical and Regional Analysis, 2022-2029 |
||||||
|
|
|||||||
カスタマイズ可能
|
|||||||


| グラフェンエレクトロニクスの世界市場規模の調査・予測、製品別、業界別・地域別分析、2022-2029年 |
|
出版日: 2023年05月02日
発行: Bizwit Research & Consulting LLP
ページ情報: 英文
納期: 2~3営業日
|

- 全表示
- 概要
- 図表
- 目次
世界のグラフェンエレクトロニクス市場は、2021年に約2億7,080万米ドルと評価され、予測期間2022-2029年には34.2%以上の健全な成長率で成長すると予測されています。
グラフェンは、グラファイト原子が規則正しく並んだ1枚のシートで構成されています。従来の電極材料よりも電気をよく通すため、次世代半導体の開発に利用されています。グラフェンは、強い機械的強度、極めて高い電子移動度、熱伝導率の向上など、さまざまな特性を備えています。電子機器用メモリーデバイスの需要急増、電気自動車の販売増加、優れた性能と機能に関する意識の高まりが、世界の市場成長の要因となっています。
ポータブル電子機器の需要の高まりは、グラフェンエレクトロニクスの需要に大きな役割を果たしています。グラフェンは、その薄さや導電性などの特性から、バッテリー、タッチスクリーン、センサー、太陽電池など、さまざまな電子機器部品に採用され、エレクトロニクス分野で高い支持を得ています。例えば、Statistaによると、2022年の家電・エレクトロニクス分野の売上高は4,551億5,000万米ドルと推定されており、2015年の2,042億3,000万米ドルから増加傾向にあります。さらに、英国を拠点とする新興企業Paragraf-は、グラフェンベースのセンサーを作成し、電子機器の希少金属インジウムをグラフェンに置き換えるために、2019年に1,600万米ドルを調達しました。したがって、これらの前述の要因は、かなりの割合で市場の需要を促進しています。さらに、技術的進歩の重視の高まりや、ウルトラハイエンド以外の用途の拡大が、予測期間中にさまざまな有利な機会をもたらしています。しかし、高コスト要因や必要なインフラの欠如が、2022-2029年の予測期間を通じて市場成長に影響を与えています。
グラフェンエレクトロニクスの世界市場調査において考慮された主要地域は、アジア太平洋地域、北米、欧州、中南米、その他の地域です。北米は、モノのインターネットやコンシューマーエレクトロニクスソリューションの開発の高まりとともに、次世代グラフェンベースのエレクトロニクスソリューションの開発に注目が集まっていることから、収益面で市場を独占しています。一方、アジア太平洋地域は、エネルギー効率の高いグラフェンバッテリーおよびICソリューションへの投資の増加や、同地域における電子機器の需要の急増などの要因により、予測期間中に最も高いCAGRで成長すると予想されます。
本調査の目的は、近年におけるさまざまなセグメントと国の市場規模を明らかにし、今後数年間の市場規模を予測することにあります。本レポートは、調査対象国の産業の質的・量的な側面を取り入れるよう設計されています。
また、市場の将来的な成長を規定する促進要因や課題など、重要な側面に関する詳細情報も提供しています。さらに、主要企業の競合情勢や製品提供の詳細な分析とともに、利害関係者が投資するためのミクロ市場での潜在的な機会も組み込んでいます。.
目次
第1章 エグゼクティブサマリー
- マーケットスナップショット
- 世界・セグメント別市場推定・予測、2019年~2029年
- グラフェンエレクトロニクス市場、地域別、2019-2029年
- グラフェンエレクトロニクス市場、製品別、2019-2029年
- グラフェンエレクトロニクス市場、産業分野別、2019年~2029年
- 主な動向
- 調査手法
- 調査の前提条件
第2章 グラフェンエレクトロニクスの世界市場の定義と範囲
- 調査目的
- 市場の定義と範囲
- 調査対象範囲
- 産業の進化
- 本調査の対象となった年
- 通貨換算レート
第3章 グラフェンエレクトロニクスの世界市場力学
- グラフェンエレクトロニクス市場のインパクト分析(2019-2029年)
- 市場促進要因
- 携帯型電子機器の需要増
- 電気自動車の販売台数の増加
- 市場の課題
- 高コスト要因
- 必要なインフラが不足している
- 市場機会
- 技術の進化を重視する傾向が強まる
- 非超高級機からの応用が広がる
- 市場促進要因
第4章 世界のグラフェンエレクトロニクス市場産業分析
- ポーターの5フォースモデル
- 供給企業の交渉力
- 買い手の交渉力
- 新規参入業者の脅威
- 代替品の脅威
- 競争企業間の敵対関係
- ポーターの5フォースモデルへの未来的アプローチ(2019-2029年)
- PEST分析
- 政治的
- 経済的
- ソーシャル
- テクニカル
- 主な投資機会
- 主要成功戦略
- 業界関係者見通し
- アナリストの提言と結論
第5章 リスク評価:COVID-19の影響
- COVID-19が業界に与える全体的な影響についての評価
- COVID-19以前とCOVID-19以後の市場シナリオ
第6章 グラフェンエレクトロニクスの世界市場:製品別
- マーケットスナップショット
- グラフェンエレクトロニクスの世界市場:製品別、実績、ポテンシャル分析
- グラフェンエレクトロニクスの世界市場、製品別推定・予測2019-2029
- グラフェンエレクトロニクス市場、サブセグメント分析
- ディスプレイ
- メモリ
- バッテリ
- 太陽電池
- 集積回路とチップ
- その他
第7章 グラフェンエレクトロニクスの世界市場:産業別
- マーケットスナップショット
- グラフェンエレクトロニクスの世界市場:産業分野別、実績 - ポテンシャル分析
- グラフェンエレクトロニクスの世界市場産業分野別推定・予測2019-2029
- グラフェンエレクトロニクス市場、サブセグメント分析
- コンシューマーエレクトロニクス
- 自動車
- ヘルスケア
- 産業用ロボティクス
- 航空宇宙・防衛
- その他
第8章 グラフェンエレクトロニクスの世界市場:地域別分析
- グラフェンエレクトロニクス市場、地域別マーケットスナップショット
- 北米
- 米国
- 製品別の推定・予測、2019年~2029年
- 業界別の推定・予測、2019年~2029年
- カナダ
- 米国
- 欧州グラフェンエレクトロニクス市場スナップショット
- 英国
- ドイツ
- フランス
- スペイン
- イタリア
- その他欧州
- アジア太平洋地域のグラフェンエレクトロニクス市場のスナップショット
- 中国
- インド
- 日本
- オーストラリア
- 韓国
- その他アジア太平洋地域
- ラテンアメリカのグラフェンエレクトロニクス市場スナップショット
- ブラジル
- メキシコ
- その他ラテンアメリカ地域
- 世界のその他の地域
第9章 競合情報
- トップ市場戦略
- 企業プロファイル
- AMG Advanced Metallurgical Group N.V.
- 主要な情報
- 概要
- 財務(データの入手が可能な場合のみ)
- 製品概要
- 最近の動向
- Graphene Frontiers LLC
- Graphenea
- Talga Group
- NanoXplore Inc.
- Versarien plc
- Graphene Platform Corporation
- Graphene Square, Inc.
- First Graphene
- Grafen Chemical Industries Co. Ltd
- AMG Advanced Metallurgical Group N.V.
第10章 調査プロセス
- 調査プロセス
- データマイニング
- 分析
- 市場推定
- バリデーション
- 出版
- 調査の特徴
- 調査の前提条件
LIST OF TABLES
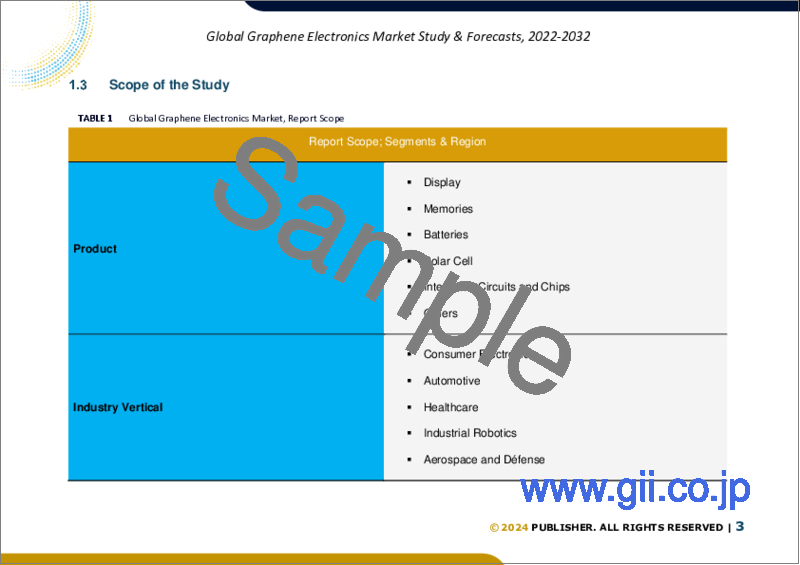
- TABLE 1. Global Graphene Electronics Market, report scope
- TABLE 2. Global Graphene Electronics Market estimates & forecasts by Region 2019-2029 (USD Million)
- TABLE 3. Global Graphene Electronics Market estimates & forecasts by Product 2019-2029 (USD Million)
- TABLE 4. Global Graphene Electronics Market estimates & forecasts by Industry Vertical 2019-2029 (USD Million)
- TABLE 5. Global Graphene Electronics Market by segment, estimates & forecasts, 2019-2029 (USD Million)
- TABLE 6. Global Graphene Electronics Market by region, estimates & forecasts, 2019-2029 (USD Million)
- TABLE 7. Global Graphene Electronics Market by segment, estimates & forecasts, 2019-2029 (USD Million)
- TABLE 8. Global Graphene Electronics Market by region, estimates & forecasts, 2019-2029 (USD Million)
- TABLE 9. Global Graphene Electronics Market by segment, estimates & forecasts, 2019-2029 (USD Million)
- TABLE 10. Global Graphene Electronics Market by region, estimates & forecasts, 2019-2029 (USD Million)
- TABLE 11. Global Graphene Electronics Market by segment, estimates & forecasts, 2019-2029 (USD Million)
- TABLE 12. Global Graphene Electronics Market by region, estimates & forecasts, 2019-2029 (USD Million)
- TABLE 13. Global Graphene Electronics Market by segment, estimates & forecasts, 2019-2029 (USD Million)
- TABLE 14. Global Graphene Electronics Market by region, estimates & forecasts, 2019-2029 (USD Million)
- TABLE 15. U.S. Graphene Electronics Market estimates & forecasts, 2019-2029 (USD Million)
- TABLE 16. U.S. Graphene Electronics Market estimates & forecasts by segment 2019-2029 (USD Million)
- TABLE 17. U.S. Graphene Electronics Market estimates & forecasts by segment 2019-2029 (USD Million)
- TABLE 18. Canada Graphene Electronics Market estimates & forecasts, 2019-2029 (USD Million)
- TABLE 19. Canada Graphene Electronics Market estimates & forecasts by segment 2019-2029 (USD Million)
- TABLE 20. Canada Graphene Electronics Market estimates & forecasts by segment 2019-2029 (USD Million)
- TABLE 21. UK Graphene Electronics Market estimates & forecasts, 2019-2029 (USD Million)
- TABLE 22. UK Graphene Electronics Market estimates & forecasts by segment 2019-2029 (USD Million)
- TABLE 23. UK Graphene Electronics Market estimates & forecasts by segment 2019-2029 (USD Million)
- TABLE 24. Germany Graphene Electronics Market estimates & forecasts, 2019-2029 (USD Million)
- TABLE 25. Germany Graphene Electronics Market estimates & forecasts by segment 2019-2029 (USD Million)
- TABLE 26. Germany Graphene Electronics Market estimates & forecasts by segment 2019-2029 (USD Million)
- TABLE 27. France Graphene Electronics Market estimates & forecasts, 2019-2029 (USD Million)
- TABLE 28. France Graphene Electronics Market estimates & forecasts by segment 2019-2029 (USD Million)
- TABLE 29. France Graphene Electronics Market estimates & forecasts by segment 2019-2029 (USD Million)
- TABLE 30. Italy Graphene Electronics Market estimates & forecasts, 2019-2029 (USD Million)
- TABLE 31. Italy Graphene Electronics Market estimates & forecasts by segment 2019-2029 (USD Million)
- TABLE 32. Italy Graphene Electronics Market estimates & forecasts by segment 2019-2029 (USD Million)
- TABLE 33. Spain Graphene Electronics Market estimates & forecasts, 2019-2029 (USD Million)
- TABLE 34. Spain Graphene Electronics Market estimates & forecasts by segment 2019-2029 (USD Million)
- TABLE 35. Spain Graphene Electronics Market estimates & forecasts by segment 2019-2029 (USD Million)
- TABLE 36. RoE Graphene Electronics Market estimates & forecasts, 2019-2029 (USD Million)
- TABLE 37. RoE Graphene Electronics Market estimates & forecasts by segment 2019-2029 (USD Million)
- TABLE 38. RoE Graphene Electronics Market estimates & forecasts by segment 2019-2029 (USD Million)
- TABLE 39. China Graphene Electronics Market estimates & forecasts, 2019-2029 (USD Million)
- TABLE 40. China Graphene Electronics Market estimates & forecasts by segment 2019-2029 (USD Million)
- TABLE 41. China Graphene Electronics Market estimates & forecasts by segment 2019-2029 (USD Million)
- TABLE 42. India Graphene Electronics Market estimates & forecasts, 2019-2029 (USD Million)
- TABLE 43. India Graphene Electronics Market estimates & forecasts by segment 2019-2029 (USD Million)
- TABLE 44. India Graphene Electronics Market estimates & forecasts by segment 2019-2029 (USD Million)
- TABLE 45. Japan Graphene Electronics Market estimates & forecasts, 2019-2029 (USD Million)
- TABLE 46. Japan Graphene Electronics Market estimates & forecasts by segment 2019-2029 (USD Million)
- TABLE 47. Japan Graphene Electronics Market estimates & forecasts by segment 2019-2029 (USD Million)
- TABLE 48. South Korea Graphene Electronics Market estimates & forecasts, 2019-2029 (USD Million)
- TABLE 49. South Korea Graphene Electronics Market estimates & forecasts by segment 2019-2029 (USD Million)
- TABLE 50. South Korea Graphene Electronics Market estimates & forecasts by segment 2019-2029 (USD Million)
- TABLE 51. Australia Graphene Electronics Market estimates & forecasts, 2019-2029 (USD Million)
- TABLE 52. Australia Graphene Electronics Market estimates & forecasts by segment 2019-2029 (USD Million)
- TABLE 53. Australia Graphene Electronics Market estimates & forecasts by segment 2019-2029 (USD Million)
- TABLE 54. RoAPAC Graphene Electronics Market estimates & forecasts, 2019-2029 (USD Million)
- TABLE 55. RoAPAC Graphene Electronics Market estimates & forecasts by segment 2019-2029 (USD Million)
- TABLE 56. RoAPAC Graphene Electronics Market estimates & forecasts by segment 2019-2029 (USD Million)
- TABLE 57. Brazil Graphene Electronics Market estimates & forecasts, 2019-2029 (USD Million)
- TABLE 58. Brazil Graphene Electronics Market estimates & forecasts by segment 2019-2029 (USD Million)
- TABLE 59. Brazil Graphene Electronics Market estimates & forecasts by segment 2019-2029 (USD Million)
- TABLE 60. Mexico Graphene Electronics Market estimates & forecasts, 2019-2029 (USD Million)
- TABLE 61. Mexico Graphene Electronics Market estimates & forecasts by segment 2019-2029 (USD Million)
- TABLE 62. Mexico Graphene Electronics Market estimates & forecasts by segment 2019-2029 (USD Million)
- TABLE 63. RoLA Graphene Electronics Market estimates & forecasts, 2019-2029 (USD Million)
- TABLE 64. RoLA Graphene Electronics Market estimates & forecasts by segment 2019-2029 (USD Million)
- TABLE 65. RoLA Graphene Electronics Market estimates & forecasts by segment 2019-2029 (USD Million)
- TABLE 66. Row Graphene Electronics Market estimates & forecasts, 2019-2029 (USD Million)
- TABLE 67. Row Graphene Electronics Market estimates & forecasts by segment 2019-2029 (USD Million)
- TABLE 68. Row Graphene Electronics Market estimates & forecasts by segment 2019-2029 (USD Million)
- TABLE 69. List of secondary sources, used in the study of global Graphene Electronics Market
- TABLE 70. List of primary sources, used in the study of global Graphene Electronics Market
- TABLE 71. Years considered for the study
- TABLE 72. Exchange rates considered
List of tables and figures and dummy in nature, final lists may vary in the final deliverable
LIST OF FIGURES
List of figures
- FIG 1. Global Graphene Electronics Market, research methodology
- FIG 2. Global Graphene Electronics Market, Market estimation techniques
- FIG 3. Global Market size estimates & forecast methods
- FIG 4. Global Graphene Electronics Market, key trends 2021
- FIG 5. Global Graphene Electronics Market, growth prospects 2022-2029
- FIG 6. Global Graphene Electronics Market, porters 5 force model
- FIG 7. Global Graphene Electronics Market, pest analysis
- FIG 8. Global Graphene Electronics Market, value chain analysis
- FIG 9. Global Graphene Electronics Market by segment, 2019 & 2029 (USD Million)
- FIG 10. Global Graphene Electronics Market by segment, 2019 & 2029 (USD Million)
- FIG 11. Global Graphene Electronics Market by segment, 2019 & 2029 (USD Million)
- FIG 12. Global Graphene Electronics Market by segment, 2019 & 2029 (USD Million)
- FIG 13. Global Graphene Electronics Market by segment, 2019 & 2029 (USD Million)
- FIG 14. Global Graphene Electronics Market, regional snapshot 2019 & 2029
- FIG 15. North America Graphene Electronics Market 2019 & 2029 (USD Million)
- FIG 16. Europe Graphene Electronics Market 2019 & 2029 (USD Million)
- FIG 17. Asia pacific Graphene Electronics Market 2019 & 2029 (USD Million)
- FIG 18. Latin America Graphene Electronics Market 2019 & 2029 (USD Million)
- FIG 19. Global Graphene Electronics Market, company Market share analysis (2021)
List of tables and figures and dummy in nature, final lists may vary in the final deliverable
Global Graphene Electronics Market is valued at approximately USD 270.8 million in 2021 and is anticipated to grow with a healthy growth rate of more than 34.2% over the forecast period 2022-2029. Graphene is composed of a single sheet of ordered graphite atoms. It is used for the development of the next-generation semiconductor, which conducts electricity better than conventional electrode materials. Graphene offers various characteristics such as strong mechanical strength, extremely high electron mobility, and improved thermal conductivity. The surging demand for memory devices of electronics, increasing sales of electric vehicles, coupled with the rising awareness regarding superior performance and functionalities are attributing towards the market growth across the globe.
The rising demand for portable electronics plays a prominent role in the demand of graphene electronics. The graphene is gaining high traction in electronics due to its characteristics such as thinness and conductivity, which lead its adoption in a variety of electronic device components, including batteries, touch screens, sensors, solar cells, and many others. For instance, according to Statista, in 2022, it was estimated that the consumer electronics and appliances segment was accounted with USD 455.15 billion, which is a rise from USD 204.23 billion in 2015. Furthermore, Paragraf- a UK-based startup raised USD 16 million in 2019 in order to create graphene-based sensors and replace the rare metal indium with graphene in electronics devices. Thus, these aforementioned factors are fostering market demand at a considerable rate. Moreover, increasing emphasis on technological advancements, as well as the growing applications non-ultra high-end are presenting various lucrative opportunities over the forecasting years. However, the high-cost factor and lack of required infrastructure are challenging the market growth throughout the forecast period of 2022-2029.
The key regions considered for the Global Graphene Electronics Market study include Asia Pacific, North America, Europe, Latin America, and the Rest of the World. North America dominated the market in terms of revenue, owing to the increasing focus on the development of next-generation graphene-based electronics solutions, along with the rising development in the Internet of Things and consumer electronics solutions. Whereas, the Asia Pacific is expected to grow with the highest CAGR during the forecast period, owing to factors such as the increasing investment in energy-efficient graphene battery and ICs solutions, as well as surging demand for electronics devices in the market space.
Major market players included in this report are:
- AMG Advanced Metallurgical Group N.V.
- Graphene Frontiers LLC
- Graphenea
- Talga Group
- NanoXplore Inc.
- Versarien Plc
- Graphene Platform Corporation
- Graphene Square, Inc.
- First Graphene
- Grafen Chemical Industries Co. Ltd
Recent Developments in the Market:
- In December 2022, AMG Advanced Metallurgical Group N.V. established a strategic cooperation between AMG Brasil SA, JX Nippon Mining & Metals Corporation, and TANIOBIS GmbH in order to produce and supply tantalum concentrate from AMG's Mibra Mine in the Brazilian state of Minas Gerais.
Global Graphene Electronics Market Report Scope:
- Historical Data 2019-2020-2021
- Base Year for Estimation 2021
- Forecast period 2022-2029
- Report Coverage Revenue forecast, Company Ranking, Competitive Landscape, Growth factors, and Trends
- Segments Covered Product, Industry Vertical, Region
- Regional Scope North America; Europe; Asia Pacific; Latin America; Rest of the World
- Customization Scope Free report customization (equivalent up to 8 analyst's working hours) with purchase. Addition or alteration to country, regional & segment scope*
The objective of the study is to define market sizes of different segments & countries in recent years and to forecast the values to the coming years. The report is designed to incorporate both qualitative and quantitative aspects of the industry within countries involved in the study.
The report also caters detailed information about the crucial aspects such as driving factors & challenges which will define the future growth of the market. Additionally, it also incorporates potential opportunities in micro markets for stakeholders to invest along with the detailed analysis of competitive landscape and product offerings of key players. The detailed segments and sub-segment of the market are explained below.
By Product:
- Display
- Memories
- Batteries
- Solar Cell
- Integrated Circuits and Chips
- Others
By Industry Vertical:
- Consumer Electronics
- Automotive
- Healthcare
- Industrial Robotics
- Aerospace and Defense
- Others
By Region:
- North America
- U.S.
- Canada
- Europe
- UK
- Germany
- France
- Spain
- Italy
- ROE
- Asia Pacific
- China
- India
- Japan
- Australia
- South Korea
- RoAPAC
- Latin America
- Brazil
- Mexico
- RoLA
- Rest of the World
Table of Contents
Chapter 1. Executive Summary
- 1.1. Market Snapshot
- 1.2. Global & Segmental Market Estimates & Forecasts, 2019-2029 (USD Million)
- 1.2.1. Graphene Electronics Market, by Region, 2019-2029 (USD Million)
- 1.2.2. Graphene Electronics Market, by Product, 2019-2029 (USD Million)
- 1.2.3. Graphene Electronics Market, by Industry Vertical, 2019-2029 (USD Million)
- 1.3. Key Trends
- 1.4. Estimation Methodology
- 1.5. Research Assumption
Chapter 2. Global Graphene Electronics Market Definition and Scope
- 2.1. Objective of the Study
- 2.2. Market Definition & Scope
- 2.2.1. Scope of the Study
- 2.2.2. Industry Evolution
- 2.3. Years Considered for the Study
- 2.4. Currency Conversion Rates
Chapter 3. Global Graphene Electronics Market Dynamics
- 3.1. Graphene Electronics Market Impact Analysis (2019-2029)
- 3.1.1. Market Drivers
- 3.1.1.1. Rising demand for portable electronics
- 3.1.1.2. Increasing sales of electric vehicles
- 3.1.2. Market Challenges
- 3.1.2.1. High-cost factor
- 3.1.2.2. Lack of required infrastructure
- 3.1.3. Market Opportunities
- 3.1.3.1. Increasing emphasis on the technological advancements
- 3.1.3.2. Growing application from non ultra high-end applications
- 3.1.1. Market Drivers
Chapter 4. Global Graphene Electronics Market Industry Analysis
- 4.1. Porter's 5 Force Model
- 4.1.1. Bargaining Power of Suppliers
- 4.1.2. Bargaining Power of Buyers
- 4.1.3. Threat of New Entrants
- 4.1.4. Threat of Substitutes
- 4.1.5. Competitive Rivalry
- 4.2. Futuristic Approach to Porter's 5 Force Model (2019-2029)
- 4.3. PEST Analysis
- 4.3.1. Political
- 4.3.2. Economical
- 4.3.3. Social
- 4.3.4. Technological
- 4.4. Top investment opportunity
- 4.5. Top winning strategies
- 4.6. Industry Experts Prospective
- 4.7. Analyst Recommendation & Conclusion
Chapter 5. Risk Assessment: COVID-19 Impact
- 5.1. Assessment of the overall impact of COVID-19 on the industry
- 5.2. Pre COVID-19 and post COVID-19 Market scenario
Chapter 6. Global Graphene Electronics Market, by Product
- 6.1. Market Snapshot
- 6.2. Global Graphene Electronics Market by Product, Performance - Potential Analysis
- 6.3. Global Graphene Electronics Market Estimates & Forecasts by Product 2019-2029 (USD Million)
- 6.4. Graphene Electronics Market, Sub Segment Analysis
- 6.4.1. Display
- 6.4.2. Memories
- 6.4.3. Batteries
- 6.4.4. Solar Cell
- 6.4.5. Integrated Circuits and Chips
- 6.4.6. Others
Chapter 7. Global Graphene Electronics Market, by Industry Vertical
- 7.1. Market Snapshot
- 7.2. Global Graphene Electronics Market by Industry Vertical, Performance - Potential Analysis
- 7.3. Global Graphene Electronics Market Estimates & Forecasts by Industry Vertical 2019-2029 (USD Million)
- 7.4. Graphene Electronics Market, Sub Segment Analysis
- 7.4.1. Consumer Electronics
- 7.4.2. Automotive
- 7.4.3. Healthcare
- 7.4.4. Industrial Robotics
- 7.4.5. Aerospace and Defense
- 7.4.6. Others
Chapter 8. Global Graphene Electronics Market, Regional Analysis
- 8.1. Graphene Electronics Market, Regional Market Snapshot
- 8.2. North America Graphene Electronics Market
- 8.2.1. U.S. Graphene Electronics Market
- 8.2.1.1. Product breakdown estimates & forecasts, 2019-2029
- 8.2.1.2. Industry Vertical breakdown estimates & forecasts, 2019-2029
- 8.2.2. Canada Graphene Electronics Market
- 8.2.1. U.S. Graphene Electronics Market
- 8.3. Europe Graphene Electronics Market Snapshot
- 8.3.1. U.K. Graphene Electronics Market
- 8.3.2. Germany Graphene Electronics Market
- 8.3.3. France Graphene Electronics Market
- 8.3.4. Spain Graphene Electronics Market
- 8.3.5. Italy Graphene Electronics Market
- 8.3.6. Rest of Europe Graphene Electronics Market
- 8.4. Asia-Pacific Graphene Electronics Market Snapshot
- 8.4.1. China Graphene Electronics Market
- 8.4.2. India Graphene Electronics Market
- 8.4.3. Japan Graphene Electronics Market
- 8.4.4. Australia Graphene Electronics Market
- 8.4.5. South Korea Graphene Electronics Market
- 8.4.6. Rest of Asia Pacific Graphene Electronics Market
- 8.5. Latin America Graphene Electronics Market Snapshot
- 8.5.1. Brazil Graphene Electronics Market
- 8.5.2. Mexico Graphene Electronics Market
- 8.5.3. Rest of Latin America Graphene Electronics Market
- 8.6. Rest of The World Graphene Electronics Market
Chapter 9. Competitive Intelligence
- 9.1. Top Market Strategies
- 9.2. Company Profiles
- 9.2.1. AMG Advanced Metallurgical Group N.V.
- 9.2.1.1. Key Information
- 9.2.1.2. Overview
- 9.2.1.3. Financial (Subject to Data Availability)
- 9.2.1.4. Product Summary
- 9.2.1.5. Recent Developments
- 9.2.2. Graphene Frontiers LLC
- 9.2.3. Graphenea
- 9.2.4. Talga Group
- 9.2.5. NanoXplore Inc.
- 9.2.6. Versarien plc
- 9.2.7. Graphene Platform Corporation
- 9.2.8. Graphene Square, Inc.
- 9.2.9. First Graphene
- 9.2.10. Grafen Chemical Industries Co. Ltd
- 9.2.1. AMG Advanced Metallurgical Group N.V.
Chapter 10. Research Process
- 10.1. Research Process
- 10.1.1. Data Mining
- 10.1.2. Analysis
- 10.1.3. Market Estimation
- 10.1.4. Validation
- 10.1.5. Publishing
- 10.2. Research Attributes
- 10.3. Research Assumption