
|
市場調査レポート
商品コード
1757090
コネクター業界年鑑:2025年2025 Connector Industry Yearbook |
||||||
|
|||||||
| コネクター業界年鑑:2025年 |
|
出版日: 2025年06月26日
発行: Bishop & Associates, Inc.
ページ情報: 英文
納期: お問合せ
|

全表示
- 概要
- 目次
Bishop & Associatesは毎年、上場コネクター企業から提供される年次報告書に基づいてコネクター業界年鑑を作成しています。損益計算書と貸借対照表は、過去10年、5年、最新年度のものが連結されており、業界と公開会社の全体的な業績に関するベンチマークを提供しています。
さらに当レポートでは、2014年から2024年までの地域別、最終用途機器分野別の売上と、2025年および2030年の地域別、最終用途機器分野別の当社最新予測について、コネクター業界のレビューを掲載しています。
当レポートの特徴
以下を含む公開会社の連結履歴:
- 主要財務指標(2014年~2024年)
- 貸借対照表 (2014年~2024年)
- 損益計算書 (2014年~2024年)
- 貸借対照表パーセント(2014年~2024年)
- 損益計算書パーセント(2014年~2024年)
以下の財務指標の業界平均を用いた、企業別の15年間の業績推移:
- 販売費および一般管理費(2010年~2024年)
- 純利益率(2010年~2024年)
- 総資産利益率(2010年~2024年)
- 長期有利子負債/自己資本(2010年~2024年)
- 売掛金回転率(2010年~2024年)
- 在庫回転率(2010年~2024年)
- 売上原価率(2010年~2024年)
- 売上原価+販管費率(2010年~2024年)
- 流動比率(2010年~2024年)
- 自己資本利益率(2010年~2024年)
- 自己資本負債比率(2010年~2024年)
- 平均回収期間(2010年~2024年)
- 在庫日数(2010年~2024年)
2024 Yearbook Companies売上高純利益率
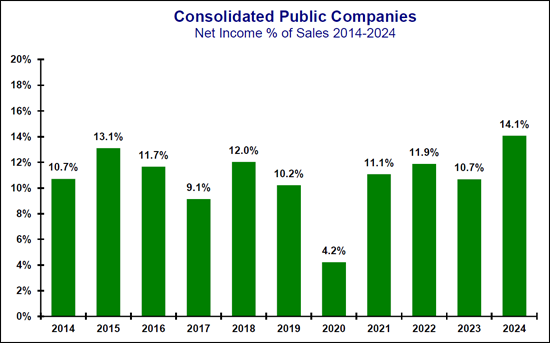
以下の表は、2025年コネクター産業年鑑に含まれる公開会社の2014年から2024年までの売上高に対する純利益のパーセンテージです。
純利益
2024年のコネクター業界の平均純利益は売上高の14.1%でした。2018年は、米国では減税・雇用法が成立した年であったため、重要な年でした。この法律は連邦法人税を35%から21%に引き下げました。世界のCOVIDパンデミックの結果、売上高に対する純利益の割合が最も低かったのは2020年の4.2%でした。2015年から2019年にかけて、純利益は2015年の売上高の13.1%から2019年には10.2%に減少しました。2020年から2024年にかけて、純利益は2020年の4.2%から2024年には14.1%に増加しました。
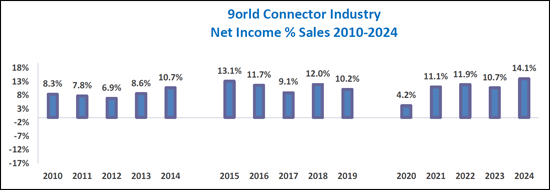
以下のグラフは、2010年から2024年までのコネクター業界の純利益の歴史です。
目次
プロローグ
第1章 世界の電子コネクター産業
- 過去10年間(2014年~2024年)
- 過去5年間(2019年~2024年)
- 昨年~2024年
- 機器セクターの売上(2022年~2024年)
- 機器部門別売上高
- 地域別2025年と2030年の予測
- 主要な技術動向
- リードタイム
- 価格動向
第2章 重要な出来事
第3章 -連結主要業績評価指標
統合主要業績指標
企業別業績履歴
売上原価
販売費および一般管理費(SG&A)
売上原価+販売費及び一般管理費
純利益の推移
流動比率
資産利益率
自己資本利益率
長期債務/資本
負債対資本
売掛金回転率
平均収集期間
在庫回転率
在庫日数
第4章 選定企業の業績履歴
主要企業の業績履歴
Amphenol Corporatio
- 主要な財務指標
- チャート:主要な財務指標
- 貸借対照表(米ドル)(2014年~2024年)
- 貸借対照表(%)(2014年~2024年)
- 損益計算書(米ドル)(2014年~2024年)
- 損益計算書の割合(2014年~2024年)
Cheng Uei Precision Co. Ltd. (Foxlink)
- 主要な財務指標
- チャート:主要な財務指標
- 貸借対照表(米ドル)(2014年~2024年)
- 貸借対照表(%)(2014年~2024年)
- 損益計算書(米ドル)(2014年~2024年)
- 損益計算書の割合(2014年~2024年)
FIT Hon Teng Ltd
- 主要な財務指標
- チャート:主要な財務指標
- 貸借対照表(米ドル)(2014年~2024年)
- 貸借対照表(%)(2014年~2024年)
- 損益計算書(米ドル)(2014年~2024年)
- 損益計算書の割合(2014年~2024年)
Hirose Electric Co., Ltd
- 主要な財務指標
- チャート:主要な財務指標
- 貸借対照表(米ドル)(2014年~2024年)
- 貸借対照表(%)(2014年~2024年)
- 損益計算書(米ドル)(2014年~2024年)
- 損益計算書の割合(2014年~2024年)
Hosiden
- 主要な財務指標
- チャート:主要な財務指標
- 貸借対照表(米ドル)(2014年~2024年)
- 貸借対照表(%)(2014年~2024年)
- 損益計算書(米ドル)(2014年~2024年)
- 損益計算書の割合(2014年~2024年)
HUBER+SUHNER
- 主要な財務指標
- チャート:主要な財務指標
- 貸借対照表(米ドル)(2014年~2024年)
- 貸借対照表(%)(2014年~2024年)
- 損益計算書(米ドル)(2014年~2024年)
- 損益計算書の割合(2014年~2024年)
Japan Aviation Electronics Industry (JAE), Limited
- 主要な財務指標
- チャート:主要な財務指標
- 貸借対照表(米ドル)(2014年~2024年)
- 貸借対照表(%)(2014年~2024年)
- 損益計算書(米ドル)(2014年~2024年)
- 損益計算書の割合(2014年~2024年)
Korea Electric Terminal Co. Ltd.
- 主要な財務指標
- チャート:主要な財務指標
- 貸借対照表(米ドル)(2014年~2024年)
- 貸借対照表(%)(2014年~2024年)
- 損益計算書(米ドル)(2014年~2024年)
- 損益計算書の割合(2014年~2024年)
SMK
- 主要な財務指標
- チャート:主要な財務指標
- 貸借対照表(米ドル)(2014年~2024年)
- 貸借対照表(%)(2014年~2024年)
- 損益計算書(米ドル)(2014年~2024年)
- 損益計算書の割合(2014年~2024年)
TE Connectivity
- 主要な財務指標
- チャート:主要な財務指標
- 貸借対照表(米ドル)(2014年~2024年)
- 貸借対照表(%)(2014年~2024年)
- 損益計算書(米ドル)(2014年~2024年)
- 損益計算書の割合(2014年~2024年)
Each year, Bishop & Associates prepares the Connector Industry Yearbook based on annual reports provided by publicly traded connector companies. Income statements and balance sheets are consolidated for the past 10 years, five years, and most current year, providing benchmarks on the industry and the overall performance of the public connector companies.
In addition, the report provides a review of the connector industry for the period 2014-2024 for sales by region, end-use equipment sector and our current forecast for 2025 and 2030 by region and end-use equipment sector.
This report features:
Consolidated history of the public companies including:
- Key Financial Measurements (2014-2024)
- Balance Sheet $ (2014-2024)
- Income Statement $ (2014-2024)
- Balance Sheet percent (2014-2024)
- Income Statement percent (2014-2024)
Fifteen-year history of performance by company, with industry averages for the following financial measurements:
- Selling, General, & Administrative percent (2010-2024)
- Net Income percent (2010-2024)
- Return on Assets (2010-2024)
- Long Term Debt/Equity (2010-2024)
- Accounts Receivables Turnover (2010-2024)
- Inventory Turns (2010-2024)
- Cost of Goods Sold percent (2010-2024)
- COGS + SG&A percent (2010-2024)
- Current Ratio (2010-2024)
- Return on Equity (2010-2024)
- Liabilities to Equity (2010-2024)
- Average Collection Period (2010-2024)
- Days Inventory (2010-2024)
2024 Yearbook Companies Net Income as a Percent of Sales
The following table provides Net Income as a percent of sales from 2014-2024 for public companies included in the 2025 Connector Industry Yearbook.
Net Income
In 2024 the connector industry had an average net income of 14.1% of sales. 2018 was a significant year in the United States because it was the year the Tax Cuts and Jobs Act was passed. This act reduced the federal corporate income tax from 35% to 21%. As a result of the worldwide COVID pandemic, the lowest net income as a percent of sales occurred in 2020 at 4.2%. Between 2015 and 2019, net income decreased from 13.1% of sales in 2015 to 10.2% of sales in 2019. Between 2020 and 2024, net income increased from 4.2% in 2020 to 14.1% in 2024.
The following chart provides a history of net income for the Connector Industry from 2010-2024.
TABLE OF CONTENTS
PROLOGUE
CHAPTER 1 - THE WORLD ELECTRONIC CONNECTOR INDUSTRY
- The Last Ten Years (2014-2024)
- Table: Sales by Geographic Region
- Graph: Change by Region 2014 vs 2024
- The Last Five Years (2019-2024)
- Table: Sales by Geographic Region
- Graph: World Connector Industry - Year-To-Year Percent
- Change in Growth 1980-2025F
- Graph: North American Market Year-to-Year Growth 1980-2025F
- Graph: European Market Year-to-Year Growth 1980-2025F
- Graph: Japanese Market Year-to-Year Growth 1980-2025F
- Graph: Chinese Market Year-to-Year Growth 1995-2025F
- Graph: Asia Pacific Market Year-to-Year Growth 1980-2025F
- Graph: ROW Market Year-to-Year Growth 1980-2025F
- Last Year - 2024
- Table: 2022, 2023 and 2024 Percent Change in Growth Region
- Table: 2022, 2023 and 2024 Percent Share of Market by Region
- Equipment Sector Sales - 2022-2024
- Table: 2022-2024 Percent Change in Equipment Sales by Equipment Sector
- Graph: 2023-2024 Percent Change World Connector
- Sales by Equipment Sector
- Table: 2024 World Sales by Equipment Sector
- Graph: 2024 World Connector Market Top 5 Equipment Sectors
- Forecast 2025 and 2030 by Region
- Table: 2025 & 2030 Forecast by End-Use Market
- Graph: 2025 and 2030 End-Use Market Five-Year CAGR Mergers and Acquisitions
- Key Technology Trends
- Lead Times
- Price Trends
CHAPTER 2 - SIGNIFICANT EVENTS
CHAPTER 3 - CONSOLIDATED KEY PERFORMANCE MEASURES
Consolidated Key Performance Measures
- Key Financial Measurements (2014-2024)
- Charts: Key Financial Measurements
- Balance Sheet $ (2014-2024)
- Balance Sheet % (2014-2024)
- Income Statement $ (2014-2024)
- Income Statement % (2014-2024)
Performance History by Company
- Selected Connector Manufacturers
Cost-of-Goods Sold
- Cost of Goods Sold % (2010-2024)
Selling, General & Administrative (SG&A)
- Selling, General, & Administrative % (2010-2024)
COGS+SG&A
- COGS + SG&A % (2010-2024)
Net Income History
- Net Income % (2010-2024)
Current Ratio
- Current Ratio (2010-2024)
Return on Assets
- Return on Assets (2010-2024)
Return on Equity
- Return on Equity (2010-2024)
Long Term Debt/Equity
- Long Term Debt/Equity (2010-2024)
Liabilities to Equity
- Liabilities to Equity (2010-2024)
Accounts Receivable Turnover
- Accounts Receivables Turnover (2010-2024)
Average Collection Period
- Average Collection Period (2010-2024)
Inventory Turns
- Inventory Turns (2010-2024)
Days Inventory
- Days Inventory (2010-2024)
CHAPTER 4 - PERFORMANCE HISTORY OF SELECTED COMPANIES
Performance History of Selected Companies
Amphenol Corporation
- Key Financial Measurements
- Charts: Key Financial Measurements
- Balance Sheet $ (2014-2024)
- Balance Sheet % (2014-2024)
- Income Statement $ (2014-2024)
- Income Statement % (2014-2024)
Cheng Uei Precision Co. Ltd. (Foxlink)
- Key Financial Measurements
- Charts: Key Financial Measurements
- Balance Sheet $ (2014-2024)
- Balance Sheet % (2014-2024)
- Income Statement $ (2014-2024)
- Income Statement % (2014-2024)
FIT Hon Teng Ltd
- Key Financial Measurements
- Charts: Key Financial Measurements
- Balance Sheet $ (2014-2024)
- Balance Sheet % (2014-2024)
- Income Statement $ (2014-2024)
- Income Statement % (2014-2024)
Hirose Electric Co., Ltd
- Key Financial Measurements
- Charts: Key Financial Measurements
- Balance Sheet $ (2014-2024)
- Balance Sheet % (2014-2024)
- Income Statement $ (2014-2024)
- Income Statement % (2014-2024)
Hosiden
- Key Financial Measurements
- Charts: Key Financial Measurements
- Balance Sheet $ (2014-2024)
- Balance Sheet % (2014-2024)
- Income Statement $ (2014-2024)
- Income Statement % (2014-2024)
HUBER+SUHNER
- Key Financial Measurements
- Charts: Key Financial Measurements
- Balance Sheet $ (2014-2024)
- Balance Sheet % (2014-2024)
- Income Statement $ (2014-2024)
- Income Statement % (2014-2024)
Japan Aviation Electronics Industry (JAE), Limited
- Key Financial Measurements
- Charts: Key Financial Measurements
- Balance Sheet $ (2014-2024)
- Balance Sheet % (2014-2024)
- Income Statement $ (2014-2024)
- Income Statement % (2014-2024)
Korea Electric Terminal Co. Ltd.
- Key Financial Measurements
- Charts: Key Financial Measurements
- Balance Sheet $ (2014-2024)
- Balance Sheet % (2014-2024)
- Income Statement $ (2014-2024)
- Income Statement % (2014-2024)
SMK
- Key Financial Measurements
- Charts: Key Financial Measurements
- Balance Sheet $ (2014-2024)
- Balance Sheet % (2014-2024)
- Income Statement $ (2014-2024)
- Income Statement % (2014-2024)
TE Connectivity
- Key Financial Measurements
- Charts: Key Financial Measurements
- Balance Sheet $ (2014-2024)
- Balance Sheet % (2014-2024)
- Income Statement $ (2014-2024)
- Income Statement % (2014-2024)

