|
|
市場調査レポート
商品コード
1227627
電気ユーティリティビークルの世界市場 - 世界の規模、シェア、動向分析、機会、予測レポート: 車両タイプ別、バッテリータイプ別、駆動タイプ別、座席数別、推進力別、用途別、地域別(2019年~2029年)Electric Utility Vehicle Market - Global Size, Share, Trend Analysis, Opportunity and Forecast Report, 2019-2029, Segmented By Vehicle Type ; By Battery Type ; By Drive Type ; Seating Capacity ; Propulsion ; Application ; By Region |
||||||
|
|
|||||||


| 電気ユーティリティビークルの世界市場 - 世界の規模、シェア、動向分析、機会、予測レポート: 車両タイプ別、バッテリータイプ別、駆動タイプ別、座席数別、推進力別、用途別、地域別(2019年~2029年) |
|
出版日: 2023年02月23日
発行: Blueweave Consulting
ページ情報: 英文 400 Pages
納期: 2~3営業日
|
- 全表示
- 概要
- 目次
世界の電気ユーティリティビークルの市場規模は、2022年は167億米ドルと推定され、2023年から2029年の予測期間中に9.45%の著しいCAGRで成長し、2029年には314億2,000万米ドルに達すると予測されています。市場の成長を後押しする主な要因には、電気自動車(EV)充電ステーションの設置に対する投資の増加、ラストマイル配送における電気自動車の利用拡大、地球温暖化対策として自動車からの二酸化炭素排出量の削減に向けた注目度の高まりなどが挙げられます。
当レポートでは、世界の電気ユーティリティビークル市場を調査しており、市場の概要、市場規模や予測、動向、促進要因・抑制要因、車両タイプ別・バッテリータイプ別・駆動タイプ別・座席数別・推進力別・用途別・地域別の分析、および企業プロファイルなどの包括的な情報を提供しています。
目次
第1章 調査の枠組み
第2章 エグゼクティブサマリー
第3章 世界の電気ユーティリティビークル市場の洞察
- 業界バリューチェーン分析
- DROC分析
- 促進要因
- EV用バッテリーの価格低下
- 石油価格の上昇
- eコマース・倉庫部門の台頭
- 抑制要因
- 他の燃料より充電時間が長い
- 対応するICEと比較して範囲が狭い
- 機会
- 電気ユーティリティビークルのバッテリー交換
- 自動車・輸送部門での需要の増加
- 課題
- 電気ユーティリティビークルの高コスト
- 世界的に不十分なグリッドインフラストラクチャ
- 促進要因
- 技術の進歩/最近の開発
- 規制の枠組み
- ポーターのファイブフォース分析
- 供給企業の交渉力
- 買い手の交渉力
- 新規参入業者の脅威
- 代替品の脅威
- 競争の激しさ
第4章 世界の電気ユーティリティビークル市場概要
- 市場規模と予測、金額別(2019年~2029年)
- 金額別
- 市場シェアと予測
- 車両タイプ別
- 電気ATV
- 電気UTV
- 電気ユーティリティカート
- 電気シャトルカート
- 産業用電気ユーティリティビークル
- バッテリータイプ別
- 鉛酸
- リチウムイオン
- その他
- 駆動タイプ別
- 2WD
- 4WD
- AWD
- 座席数別
- 1人乗り
- 2人乗り
- 2人乗り以上
- 推進力別
- 完全電気式
- ハイブリッド電気式
- 用途別
- 商用輸送
- レクリエーション
- 農業
- 工業
- その他
- 地域別
- 北米
- 欧州
- アジア太平洋
- ラテンアメリカ
- 中東・アフリカ
- 車両タイプ別
第5章 北米の電気ユーティリティビークル市場
- 市場規模と予測、金額別(2019年~2029年)
- 金額別
- 市場シェアと予測
- 車両タイプ別
- バッテリータイプ別
- 駆動タイプ別
- 推進力別
- 座席数別
- 用途別
- 国別
- 米国
- カナダ
第6章 欧州の電気ユーティリティビークル市場
- 市場規模と予測、金額別(2019年~2029年)
- 金額別
- 市場シェアと予測
- 車両タイプ別
- バッテリータイプ別
- 駆動タイプ別
- 推進力別
- 座席数別
- 用途別
- 国別
- ドイツ
- 英国
- イタリア
- フランス
- スペイン
- オランダ
- その他の欧州
第7章 アジア太平洋の電気ユーティリティビークル市場
- 市場規模と予測、金額別(2019年~2029年)
- 金額別
- 市場シェアと予測
- 車両タイプ別
- バッテリータイプ別
- 駆動タイプ別
- 推進力別
- 座席数別
- 用途別
- 国別
- 中国
- インド
- 日本
- 韓国
- オーストラリア・ニュージーランド
- インドネシア
- マレーシア
- シンガポール
- フィリピン
- ベトナム
- その他のアジア太平洋
第8章 ラテンアメリカの電気ユーティリティビークル市場
- 市場規模と予測、金額別(2019年~2029年)
- 金額別
- 市場シェアと予測
- 車両タイプ別
- バッテリータイプ別
- 駆動タイプ別
- 推進力別
- 座席数別
- 用途別
- 国別
- ブラジル
- メキシコ
- アルゼンチン
- ペルー
- その他のラテンアメリカ
第9章 中東・アフリカの電気ユーティリティビークル市場
- 市場規模と予測、金額別(2019年~2029年)
- 金額別
- 市場シェアと予測
- 車両タイプ別
- バッテリータイプ別
- 駆動タイプ別
- 推進力別
- 座席数別
- 用途別
- 国別
- サウジアラビア
- アラブ首長国連邦
- カタール
- クウェート
- 南アフリカ
- ナイジェリア
- アルジェリア
- その他の中東・アフリカ
第10章 競合情勢
- 主な企業とその製品のリスト
- 世界の電気ユーティリティビークル市場シェア分析、2022年
- 運用パラメータ別の競合ベンチマーキング
- 主要な戦略的展開(合併、買収、パートナーシップ)
第11章 世界の電気ユーティリティビークル市場へのCOVID-19の影響
第12章 企業プロファイル(会社概要、財務マトリックス、競合情勢、主要な人材、主要な競合、連絡先、戦略的展望、SWOT分析)
- Tesla Inc.
- Tropos Motors
- Columbia Vehicle Group Inc.
- Marshell Green Power
- Polaris Inc.
- Club Car
- Star EV Corporation
- Neuron EV
- Bollinger Motors
- Mahindra Electric Mobility Limited
- Ford Motor Company
- The General Motors Company
- Toyota Motor Corporation
- Hyundai Motor Company
- その他の有力企業
第13章 主要な戦略的推奨事項
第14章 調査手法
Global Electric Utility Vehicle Market Size Booming to Cross USD 31.4 billion by 2029.
Global electric utility vehicle market is flourishing because of decreasing cost of EV batteries, high prices of petroleum, and thriving e-commerce and warehousing sectors.
BlueWeave Consulting, a leading strategic consulting and market research firm, in its recent study, estimated global electric utility vehicle market size at USD 16.7 billion in 2022. During the forecast period between 2023 and 2029, BlueWeave expects global electric utility vehicle market size to grow at a significant CAGR of 9.45% reaching a value of USD 31.42 billion by 2029. Major growth drivers for global electric utility vehicle market include increasing investments in the establishment of electric vehicle (EV) charging stations, growing use of electric utility cars in the last mile delivery, and a rising focus on lowering carbon emissions from automobiles to combat global warming. Increasing government measures to promote the adoption of electric cars for a variety of applications across a variety of end-use sectors are also likely to support market revenue growth over the forecast period. Electric utility vehicles are built with zero-emission and high work capacity in mind. Commercial vehicles such as buses, trucks, and agricultural vehicles have recently been electrified, making them more environmentally friendly, quieter, and fuel-efficient. Because utility vehicles outnumber passenger vehicles on the road, they burn vast amounts of fuel. Electric utility vehicles significantly cut carbon emissions, hence minimizing the effect of greenhouse gases and the negative environmental impact. Electric vehicles have an on-board rechargeable battery that can be charged from the grid. Governments and major corporations around the world are spending extensively in the development of robust EV charging infrastructure in order to increase EV adoption in the future years. The popularity of last-mile delivery and innovations in the logistics sector have considerably contributed to the market's revenue growth. However, longer charging time than other fuels and lower range compared to ice counterparts are anticipated to restrain the overall market expansion.
Global Electric Utility Vehicle Market - Overview:
An electric vehicle is a vehicle powered by one or more electric motors. It can be powered by a collector system or by a battery on its own (sometimes charged with solar panels, or by converting fuel to electricity using fuel cells or a generator). Surface and underwater watercraft, road and rail vehicles, electric aero planes, and electric spaceships are all examples of EVs. EVs first debuted a long time ago, when electricity was one of the favored methods of motor vehicle propulsion, providing a level of comfort and convenience of operation that gasoline automobiles of the time couldn't match. Furthermore, internal combustion engines dominated automotive and truck propulsion, but electric power remained common in trains and smaller vehicles of all sorts. Electric vehicles are either powered by a collector system, which collects electricity from charging station deployments, or by self-charging equipment such as turbochargers, regenerative braking systems, and other similar devices.
Impact of COVID-19 on Global Electric Utility Vehicle Market
COVID-19 had a detrimental impact on the market for electric utility vehicles. Though the sales growth of electric vehicles were temporarily hindered by the pandemic, the industry is expected to fully recover with a relatively high growth rate than the previous year, due to the ongoing rise in fuel prices and increasing concerns about environmental pollution as well as subsidies provided by various governments. The pandemic substantially impacted the expansion of the electric utility vehicle sector. However, it is expected to develop rapidly as a result of increased efforts by governments throughout the world to promote the automotive industry in their respective countries, as well as the growing acceptance of electric vehicles due to its cost-effectiveness and environmental benefits.
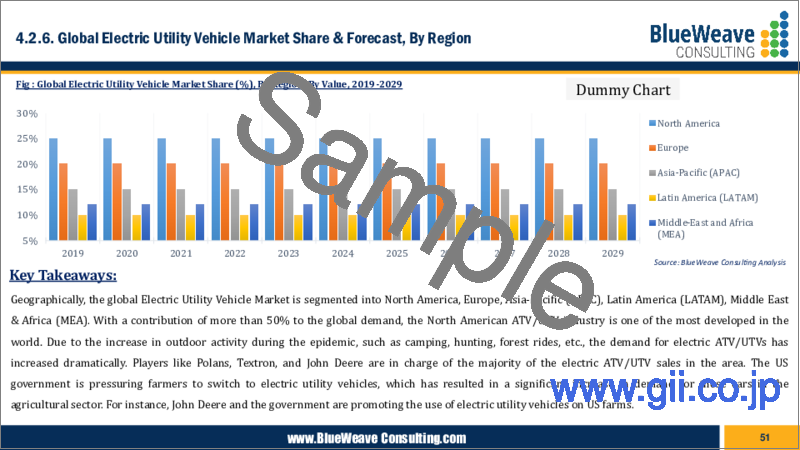
Global Electric Utility Vehicle Market - By Region
Geographically, global electric utility vehicle market covers five major regions: North America, Europe, Asia Pacific (APAC), Latin America, and Middle East and Africa (MEA). North America is predicted to dominate the market due to due to rapid adoption of electric vehicles, increased emphasis and research on improving fuel efficiency and lowering carbon emissions, and increased use of electric vehicles for logistics and last-mile deliveries. Europe is predicted to account for significant revenue growth throughout the projection period due to increased investment to expedite advances in electric mobility, a growing move towards green transportation, and the region's strong presence of important vehicle manufacturers. Asia Pacific is predicted to have the highest revenue CAGR due to increased manufacturing of electric vehicles in APAC nations like as China and India, as well as significant government initiatives to electrify transportation in the future years.
Competitive Landscape:
Major players operating in global electric utility vehicle market include: Tesla Inc., Tropos Motors, Columbia Vehicle Group Inc., Marshell Green Power, Polaris Inc., Club Car, Star EV Corporation, Neuron EV, Bollinger Motors, Mahindra Electric Mobility Limited, Ford Motor Company, The General Motors Company, Toyota Motor Corporation, and Hyundai Motor Company. To further enhance their market share, these companies employ various strategies, including mergers and acquisitions, partnerships, joint ventures, license agreements, and new product launches.
The in-depth analysis of the report provides information about growth potential, upcoming trends, and statistics of Global Electric Utility Vehicle Market. It also highlights the factors driving forecasts of total market size. The report promises to provide recent technology trends in Global Electric Utility Vehicle Market and industry insights to help decision-makers make sound strategic decisions. Furthermore, the report also analyzes the growth drivers, challenges, and competitive dynamics of the market.
Table of Contents
1. Research Framework
- 1.1. Research Objective
- 1.2. Product Overview
- 1.3. Market Segmentation
2. Executive Summary
3. Global Electric Utility Vehicle Market Insights
- 3.1. Industry Value Chain Analysis
- 3.2. DROC Analysis
- 3.2.1. Growth Drivers
- 3.2.1.1. Reduced prices of EV batteries
- 3.2.1.2. Increasing prices of petroleum
- 3.2.1.3. Rising e-commerce and warehousing sectors
- 3.2.2. Restraints
- 3.2.2.1. Longer charging time than other fuels
- 3.2.2.2. Lower range compared to ICE counterparts
- 3.2.3. Opportunities
- 3.2.3.1. Battery swapping for electric utility vehicles
- 3.2.3.2. Increasing demand in automotive and transportation sectors
- 3.2.4. Challenges
- 3.2.4.1. Higher cost of electric utility vehicles
- 3.2.4.2. Insufficient grid infrastructure globally
- 3.2.1. Growth Drivers
- 3.3. Technology Advancements/Recent Developments
- 3.4. Regulatory Framework
- 3.5. Porter's Five Forces Analysis
- 3.5.1.1. Bargaining Power of Suppliers
- 3.5.1.2. Bargaining Power of Buyers
- 3.5.1.3. Threat of New Entrants
- 3.5.1.4. Threat of Substitutes
- 3.5.1.5. Intensity of Rivalry
4. Global Electric Utility Vehicle Market Overview
- 4.1. Market Size & Forecast, by Value, 2019-2029
- 4.1.1. By Value (USD Billion)
- 4.2. Market Share & Forecast
- 4.2.1. By Vehicle Type
- 4.2.1.1. Electric ATVs
- 4.2.1.2. Electric UTVs
- 4.2.1.3. Electric Utility Carts
- 4.2.1.4. Electric Shuttle Carts
- 4.2.1.5. Industrial Electric Utility Vehicles
- 4.2.2. By Battery Type
- 4.2.2.1. Lead Acid
- 4.2.2.2. Lithium-Ion
- 4.2.2.3. Others
- 4.2.3. By Drive Type
- 4.2.3.1. 2WD
- 4.2.3.2. 4WD
- 4.2.3.3. AWD
- 4.2.4. By Seating Capacity
- 4.2.4.1. 1-Seater
- 4.2.4.2. 2-Seater
- 4.2.4.3. >2-Seater
- 4.2.5. By Propulsion
- 4.2.5.1. Pure Electric
- 4.2.5.2. Hybrid Electric
- 4.2.6. By Application
- 4.2.6.1. Commercial Transport
- 4.2.6.2. Recreation
- 4.2.6.3. Agriculture
- 4.2.6.4. Industrial
- 4.2.6.5. Others
- 4.2.7. By Region
- 4.2.7.1. North America
- 4.2.7.2. Europe
- 4.2.7.3. Asia Pacific (APAC)
- 4.2.7.4. Latin America (LATAM)
- 4.2.7.5. Middle East and Africa (MEA)
- 4.2.1. By Vehicle Type
5. North America Electric Utility Vehicle Market
- 5.1.1. Market Size & Forecast, by Value, 2019-2029
- 5.1.2. By Value (USD Billion)
- 5.2. Market Share & Forecast
- 5.2.1. By Vehicle Type
- 5.2.2. By Battery Type
- 5.2.3. By Drive Type
- 5.2.4. By Propulsion
- 5.2.5. By Seating Capacity
- 5.2.6. By Application
- 5.2.7. By Country
- 5.2.7.1. US
- 5.2.7.1.1. By Vehicle Type
- 5.2.7.1.2. By Battery Type
- 5.2.7.1.3. By Drive Type
- 5.2.7.1.4. By Propulsion
- 5.2.7.1.5. By Seating Capacity
- 5.2.7.1.6. By Application
- 5.2.7.2. Canada
- 5.2.7.2.1. By Vehicle Type
- 5.2.7.2.2. By Battery Type
- 5.2.7.2.3. By Drive Type
- 5.2.7.2.4. By Propulsion
- 5.2.7.2.5. By Seating Capacity
- 5.2.7.2.6. By Application
6. Europe Electric Utility Vehicle Market
- 6.1. Market Size & Forecast, by Value, 2019-2029
- 6.1.1. By Value (USD Billion)
- 6.2. Market Share & Forecast
- 6.2.1. By Vehicle Type
- 6.2.2. By Battery Type
- 6.2.3. By Drive Type
- 6.2.4. By Propulsion
- 6.2.5. By Seating Capacity
- 6.2.6. By Application
- 6.2.7. By Country
- 6.2.7.1. Germany
- 6.2.7.1.1. By Vehicle Type
- 6.2.7.1.2. By Battery Type
- 6.2.7.1.3. By Drive Type
- 6.2.7.1.4. By Propulsion
- 6.2.7.1.5. By Seating Capacity
- 6.2.7.1.6. By Application
- 6.2.7.2. UK
- 6.2.7.2.1. By Vehicle Type
- 6.2.7.2.2. By Battery Type
- 6.2.7.2.3. By Drive Type
- 6.2.7.2.4. By Propulsion
- 6.2.7.2.5. By Seating Capacity
- 6.2.7.2.6. By Application
- 6.2.7.3. Italy
- 6.2.7.3.1. By Vehicle Type
- 6.2.7.3.2. By Battery Type
- 6.2.7.3.3. By Drive Type
- 6.2.7.3.4. By Propulsion
- 6.2.7.3.5. By Seating Capacity
- 6.2.7.3.6. By Application
- 6.2.7.4. France
- 6.2.7.4.1. By Vehicle Type
- 6.2.7.4.2. By Battery Type
- 6.2.7.4.3. By Drive Type
- 6.2.7.4.4. By Propulsion
- 6.2.7.4.5. By Seating Capacity
- 6.2.7.4.6. By Application
- 6.2.7.4.7.
- 6.2.7.5. Spain
- 6.2.7.5.1. By Vehicle Type
- 6.2.7.5.2. By Battery Type
- 6.2.7.5.3. By Drive Type
- 6.2.7.5.4. By Propulsion
- 6.2.7.5.5. By Seating Capacity
- 6.2.7.5.6. By Application
- 6.2.7.6. The Netherlands
- 6.2.7.6.1. By Vehicle Type
- 6.2.7.6.2. By Battery Type
- 6.2.7.6.3. By Drive Type
- 6.2.7.6.4. By Propulsion
- 6.2.7.6.5. By Seating Capacity
- 6.2.7.6.6. By Application
- 6.2.7.7. Rest of Europe
- 6.2.7.7.1. By Vehicle Type
- 6.2.7.7.2. By Battery Type
- 6.2.7.7.3. By Drive Type
- 6.2.7.7.4. By Propulsion
- 6.2.7.7.5. By Seating Capacity
- 6.2.7.7.6. By Application
7. Asia Pacific Electric Utility Vehicle Market
- 7.1. Market Size & Forecast, by Value, 2019-2029
- 7.1.1. By Value (USD Billion)
- 7.2. Market Share & Forecast
- 7.2.1. By Vehicle Type
- 7.2.2. By Battery Type
- 7.2.3. By Drive Type
- 7.2.4. By Propulsion
- 7.2.5. By Seating Capacity
- 7.2.6. By Application
- 7.2.7. By Country
- 7.2.7.1. China
- 7.2.7.1.1. By Vehicle Type
- 7.2.7.1.2. By Battery Type
- 7.2.7.1.3. By Drive Type
- 7.2.7.1.4. By Propulsion
- 7.2.7.1.5. By Seating Capacity
- 7.2.7.1.6. By Application
- 7.2.7.2. India
- 7.2.7.2.1. By Vehicle Type
- 7.2.7.2.2. By Battery Type
- 7.2.7.2.3. By Drive Type
- 7.2.7.2.4. By Propulsion
- 7.2.7.2.5. By Seating Capacity
- 7.2.7.2.6. By Application
- 7.2.7.3. Japan
- 7.2.7.3.1. By Vehicle Type
- 7.2.7.3.2. By Battery Type
- 7.2.7.3.3. By Drive Type
- 7.2.7.3.4. By Propulsion
- 7.2.7.3.5. By Seating Capacity
- 7.2.7.3.6. By Application
- 7.2.7.4. South Korea
- 7.2.7.4.1. By Vehicle Type
- 7.2.7.4.2. By Battery Type
- 7.2.7.4.3. By Drive Type
- 7.2.7.4.4. By Propulsion
- 7.2.7.4.5. By Seating Capacity
- 7.2.7.4.6. By Application
- 7.2.7.5. Australia & New Zealand
- 7.2.7.5.1. By Vehicle Type
- 7.2.7.5.2. By Battery Type
- 7.2.7.5.3. By Drive Type
- 7.2.7.5.4. By Propulsion
- 7.2.7.5.5. By Seating Capacity
- 7.2.7.5.6. By Application
- 7.2.7.6. Indonesia
- 7.2.7.6.1. By Vehicle Type
- 7.2.7.6.2. By Battery Type
- 7.2.7.6.3. By Drive Type
- 7.2.7.6.4. By Propulsion
- 7.2.7.6.5. By Seating Capacity
- 7.2.7.6.6. By Application
- 7.2.7.7. Malaysia
- 7.2.7.7.1. By Vehicle Type
- 7.2.7.7.2. By Battery Type
- 7.2.7.7.3. By Drive Type
- 7.2.7.7.4. By Propulsion
- 7.2.7.7.5. By Seating Capacity
- 7.2.7.7.6. By Application
- 7.2.7.8. Singapore
- 7.2.7.8.1. By Vehicle Type
- 7.2.7.8.2. By Battery Type
- 7.2.7.8.3. By Drive Type
- 7.2.7.8.4. By Propulsion
- 7.2.7.8.5. By Seating Capacity
- 7.2.7.8.6. By Application
- 7.2.7.9. Philippines
- 7.2.7.9.1. By Vehicle Type
- 7.2.7.9.2. By Battery Type
- 7.2.7.9.3. By Drive Type
- 7.2.7.9.4. By Propulsion
- 7.2.7.9.5. By Seating Capacity
- 7.2.7.9.6. By Application
- 7.2.7.10. Vietnam
- 7.2.7.10.1. By Vehicle Type
- 7.2.7.10.2. By Battery Type
- 7.2.7.10.3. By Drive Type
- 7.2.7.10.4. By Propulsion
- 7.2.7.10.5. By Seating Capacity
- 7.2.7.10.6. By Application
- 7.2.7.11. Rest of APAC
- 7.2.7.11.1. By Vehicle Type
- 7.2.7.11.2. By Battery Type
- 7.2.7.11.3. By Drive Type
- 7.2.7.11.4. By Propulsion
- 7.2.7.11.5. By Seating Capacity
- 7.2.7.11.6. By Application
8. Latin America Electric Utility Vehicle Market
- 8.1. Market Size & Forecast, by Value, 2019-2029
- 8.1.1. By Value (USD Billion)
- 8.2. Market Share & Forecast
- 8.2.1. By Vehicle Type
- 8.2.2. By Battery Type
- 8.2.3. By Drive Type
- 8.2.4. By Propulsion
- 8.2.5. By Seating Capacity
- 8.2.6. By Application
- 8.2.7. By Country
- 8.2.7.1. Brazil
- 8.2.7.1.1. By Vehicle Type
- 8.2.7.1.2. By Battery Type
- 8.2.7.1.3. By Drive Type
- 8.2.7.1.4. By Propulsion
- 8.2.7.1.5. By Seating Capacity
- 8.2.7.1.6. By Application
- 8.2.7.2. Mexico
- 8.2.7.2.1. By Vehicle Type
- 8.2.7.2.2. By Battery Type
- 8.2.7.2.3. By Drive Type
- 8.2.7.2.4. By Propulsion
- 8.2.7.2.5. By Seating Capacity
- 8.2.7.2.6. By Application
- 8.2.7.3. Argentina
- 8.2.7.3.1. By Vehicle Type
- 8.2.7.3.2. By Battery Type
- 8.2.7.3.3. By Drive Type
- 8.2.7.3.4. By Propulsion
- 8.2.7.3.5. By Seating Capacity
- 8.2.7.3.6. By Application
- 8.2.7.4. Peru
- 8.2.7.4.1. By Vehicle Type
- 8.2.7.4.2. By Battery Type
- 8.2.7.4.3. By Drive Type
- 8.2.7.4.4. By Propulsion
- 8.2.7.4.5. By Seating Capacity
- 8.2.7.4.6. By Application
- 8.2.7.5. Rest of LATAM
- 8.2.7.5.1. By Vehicle Type
- 8.2.7.5.2. By Battery Type
- 8.2.7.5.3. By Drive Type
- 8.2.7.5.4. By Propulsion
- 8.2.7.5.5. By Seating Capacity
- 8.2.7.5.6. By Application
9. Middle East and Africa Electric Utility Vehicle Market
- 9.1. Market Size & Forecast, by Value, 2019-2029
- 9.1.1. By Value (USD Billion)
- 9.2. Market Share & Forecast
- 9.2.1. By Vehicle Type
- 9.2.2. By Battery Type
- 9.2.3. By Drive Type
- 9.2.4. By Propulsion
- 9.2.5. By Seating Capacity
- 9.2.6. By Application
- 9.2.7. By Country
- 9.2.7.1. Saudi Arabia
- 9.2.7.1.1. By Vehicle Type
- 9.2.7.1.2. By Battery Type
- 9.2.7.1.3. By Drive Type
- 9.2.7.1.4. By Propulsion
- 9.2.7.1.5. By Seating Capacity
- 9.2.7.1.6. By Application
- 9.2.7.2. UAE
- 9.2.7.2.1. By Vehicle Type
- 9.2.7.2.2. By Battery Type
- 9.2.7.2.3. By Drive Type
- 9.2.7.2.4. By Propulsion
- 9.2.7.2.5. By Seating Capacity
- 9.2.7.2.6. By Application
- 9.2.7.3. Qatar
- 9.2.7.3.1. By Vehicle Type
- 9.2.7.3.2. By Battery Type
- 9.2.7.3.3. By Drive Type
- 9.2.7.3.4. By Propulsion
- 9.2.7.3.5. By Seating Capacity
- 9.2.7.3.6. By Application
- 9.2.7.4. Kuwait
- 9.2.7.4.1. By Vehicle Type
- 9.2.7.4.2. By Battery Type
- 9.2.7.4.3. By Drive Type
- 9.2.7.4.4. By Propulsion
- 9.2.7.4.5. By Seating Capacity
- 9.2.7.4.6. By Application
- 9.2.7.5. South Africa
- 9.2.7.5.1. By Vehicle Type
- 9.2.7.5.2. By Battery Type
- 9.2.7.5.3. By Drive Type
- 9.2.7.5.4. By Propulsion
- 9.2.7.5.5. By Seating Capacity
- 9.2.7.5.6. By Application
- 9.2.7.6. Nigeria
- 9.2.7.6.1. By Vehicle Type
- 9.2.7.6.2. By Battery Type
- 9.2.7.6.3. By Drive Type
- 9.2.7.6.4. By Propulsion
- 9.2.7.6.5. By Seating Capacity
- 9.2.7.6.6. By Application
- 9.2.7.7. Algeria
- 9.2.7.7.1. By Vehicle Type
- 9.2.7.7.2. By Battery Type
- 9.2.7.7.3. By Drive Type
- 9.2.7.7.4. By Propulsion
- 9.2.7.7.5. By Seating Capacity
- 9.2.7.7.6. By Application
- 9.2.7.8. Rest of MEA
- 9.2.7.8.1. By Vehicle Type
- 9.2.7.8.2. By Battery Type
- 9.2.7.8.3. By Drive Type
- 9.2.7.8.4. By Propulsion
- 9.2.7.8.5. By Seating Capacity
- 9.2.7.8.6. By Application
10. Competitive Landscape
- 10.1. List of Key Players and Their Offerings
- 10.2. Global Electric Utility Vehicle Company Market Share Analysis, 2022
- 10.3. Competitive Benchmarking, By Operating Parameters
- 10.4. Key Strategic Developments (Mergers, Acquisitions, Partnerships)
11. Impact of Covid-19 on Global Electric Utility Vehicle Market
12. Company Profile (Company Overview, Financial Matrix, Competitive Landscape, Key Personnel, Key Competitors, Contact Address, Strategic Outlook, SWOT Analysis)
- 12.1. Tesla Inc.
- 12.2. Tropos Motors
- 12.3. Columbia Vehicle Group Inc.
- 12.4. Marshell Green Power
- 12.5. Polaris Inc.
- 12.6. Club Car
- 12.7. Star EV Corporation
- 12.8. Neuron EV
- 12.9. Bollinger Motors
- 12.10. Mahindra Electric Mobility Limited
- 12.11. Ford Motor Company
- 12.12. The General Motors Company
- 12.13. Toyota Motor Corporation
- 12.14. Hyundai Motor Company
- 12.15. Other Prominent Players
13. Key Strategic Recommendations
14. Research Methodology
- 14.1. Qualitative Research
- 14.1.1. Primary & Secondary Research
- 14.2. Quantitative Research
- 14.3. Market Breakdown & Data Triangulation
- 14.3.1. Secondary Research
- 14.3.2. Primary Research
- 14.4. Breakdown of Primary Research Respondents, By Region
- 14.5. Assumptions & Limitations