|
|
市場調査レポート
商品コード
1794367
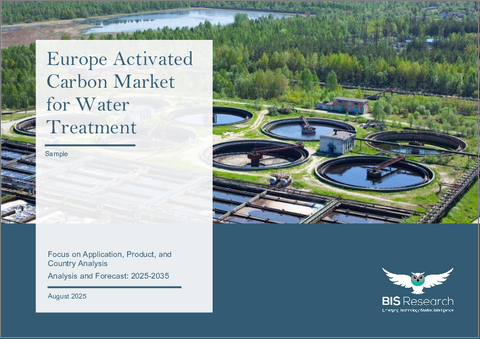
欧州の水処理用活性炭市場:用途別、製品別、国別 - 分析と予測(2025年~2035年)Europe Activated Carbon Market for Water Treatment: Focus on Application, Product, and Country Analysis - Analysis and Forecast, 2025-2035 |
||||||
カスタマイズ可能
|
|||||||
| 欧州の水処理用活性炭市場:用途別、製品別、国別 - 分析と予測(2025年~2035年) |
|
出版日: 2025年08月20日
発行: BIS Research
ページ情報: 英文 90 Pages
納期: 1~5営業日
|
全表示
- 概要
- 図表
- 目次
欧州の水処理用活性炭の市場規模は、2024年の3億7,140万米ドルから2035年には8億2,500万米ドルに達し、予測期間の2025年~2035年のCAGRは7.45%になると予測されています。
活性炭は、欧州市場では使用済み炭素を再活性化するか、木材、ヤシ殻、石炭から新鮮な材料として得られます。原料の熱分解、活性化、ペレット化または粉砕、アプリケーション・エンジニアリング、クローズドループ再生は、すべてこの地域のバリューチェーンに含まれます。高い初期吸着能力はバージン・グレードが提供し、再活性化カーボンは使用済みメディアを繰り返し補充することで費用と廃棄物を削減します。欧州の技術進歩は、破過サイクルを最大化するためのデジタルモニタリング、蒸気効率の高いロータリーキルンの再活性化、PFASと微生物除去のためのカスタマイズされた孔径分布に重点を置いています。低エネルギー活性化技術やバイオベース原料への投資は、EU規則の厳格化と持続可能性目標によって推進されています。
| 主要市場統計 | |
|---|---|
| 予測期間 | 2025年~2035年 |
| 2025年の評価 | 4億220万米ドル |
| 2035年の予測 | 8億2,500万米ドル |
| CAGR | 7.45% |
市場イントロダクション
欧州の水処理用活性炭市場は、産業、自治体、環境分野で使用される清潔で安全な水を保証するために不可欠です。活性炭はその卓越した吸着能力から、微生物、PFAS、薬剤、農薬、塩素副生成物などの不純物を飲料水や処理水から取り除くために使用されます。石炭、ヤシ殻、木材から作られるバージンカーボンと、使用済みの媒体を復元して繰り返し使用できるようにする再活性化カーボンの両方が、欧州における炭素供給のための持続可能で経済的な代替手段を提供しています。
この地域のバリューチェーンは、原料加工、活性化、成形または粉砕、アプリケーション・エンジニアリング、クローズドループ再生で構成されています。ドイツ、英国、フランス、イタリアは、高度な水処理システム、厳格な環境法、旺盛な工業用需要を背景に、重要な市場となっています。技術開発は、ロータリーキルンの再活性化効率の向上、特定の汚染物質に対する細孔構造のカスタマイズ、性能を最大化するためのデジタルモニタリングの導入に集中しています。
バイオベースの原料や低エネルギー活性化技術への移行は、EU規制、特に飲料水指令や持続可能性の目標によって加速しています。欧州の活性炭水処理市場は、技術革新、環境責任、規制遵守のバランスを取りながら、水不足、工業排水制限、公衆衛生意識の高まりにより、着実に拡大すると予想されます。
市場セグメンテーション
セグメンテーション1:最終用途産業別
- 自治体の水処理
- 食品・飲料
- 医薬品・医療
- 鉱業・金属回収
- 化学産業
- 繊維産業
- その他
セグメンテーション2:用途別
- 液相吸着
- 気相吸着
セグメント3:活性炭タイプ別
- 粉末活性炭(PAC)
- 粒状活性炭(GAC)
- その他
セグメント4:地域別
- 欧州
欧州の水処理用活性炭市場の動向、原動力、課題
市場動向
- 欧州における自治体の水道インフラ老朽化別高度浄水需要の高まり
- 再活性化やバイオベースなど、環境に優しく持続可能な活性炭製造方法へのシフト
- 微量汚染物質除去のための都市水処理プラントにおける粉末活性炭(PAC)の適用拡大。
- 活性炭と膜ろ過や紫外線消毒を組み合わせたハイブリッド処理システムの統合。
- EUの厳しい水質規制の採用(飲料水指令の更新など)。
市場促進要因
- 南欧および東欧における淡水利用可能量の減少と水ストレスレベルの上昇。
- 産業排水や市水処理に関する厳しい環境規制。
- 都市人口の急増別安全な飲料水需要の増加。
- 飲食品、医薬品、化学薬品などの分野での工業用水処理ニーズの高まり。
- 水系感染症やマイクロプラスチック汚染に対する社会的意識の高まり
主な市場課題
- 代替化学物質と比較して、活性炭の製造コストと再活性化コストが高いです。
- 特定の用途で低コストの代替品(高度酸化プロセス、イオン交換樹脂など)が利用可能。
- 輸入や製品仕様に関するEU規制遵守の複雑さ。
- コスト変動につながる原料供給(ヤシ殻、石炭、木材など)の不安定性。
- 有害化合物を吸着した使用済み活性炭の取り扱いと処分の難しさ。
製品/イノベーション戦略:本調査では、カーボンタイプ別(GAC、PAC、その他)、用途別(液相吸着、気相吸着)、最終用途産業別(都市水処理、飲食品、製薬・医療、鉱業・金属回収、化学産業、繊維産業、その他)の需要を分析しています。PFASの取り込みを促進する細孔工学の進歩を概説し、再生可能原料の動向を明らかにすることで、研究開発チームに新グレードを高成長市場セグメントに適合させるための洞察を提供します。
成長/マーケティング戦略:市場シェア表は、主要な既存企業と、それらが残すサービスのギャップを特定し、新興サプライヤーや技術パートナーの市場参入計画を導きます。
競合戦略:主要企業のプロファイルは、能力、再活性化の足跡、最近の買収をマッピングし、企業戦略担当者がM&Aや提携のターゲットをベンチマークできるようにします。価格予測や特許出願分析は、交渉のベースラインやIPポジショニングに役立ちます。
目次
エグゼクティブサマリー
第1章 市場:業界展望
- 動向:現状と将来への影響評価
- 活性炭の持続可能性と循環利用
- ろ過に関する国民の意識と普及の向上
- サプライチェーンの概要
- バリューチェーン分析
- 市場マップ
- 価格予測
- 研究開発レビュー
- 特許出願動向(特許件数別、国別、企業別)
- 規制状況
- ステークホルダー分析
- 使用事例
- エンドユーザーと購入基準
- 市場力学
- 市場の促進要因
- 市場の課題
- 市場の機会
第2章 地域
- 地域のサマリー
- 欧州
- 地域概要
- 市場成長促進要因
- 市場成長抑制要因
- 用途
- 製品
- 欧州(国別)
第3章 市場-競合ベンチマーキングと企業プロファイル
- Jacobi Carbons AB (Osaka Gas Chemicals Co., Ltd.)
- Silcarbon Aktivkohle GmbH
- Norit
- CarboTech AC GmbH
- Donau Carbon GmbH
- Desotec NV
- その他の主要企業
第4章 調査手法
List of Figures
- Figure 1: Europe Activated Carbon Market for Water Treatment (by Scenario), $Million, 2025, 2030, and 2035
- Figure 2: Europe Activated Carbon Market for Water Treatment, 2024 and 2035
- Figure 3: Market Snapshot, 2024
- Figure 4: Activated Carbon Market for Water Treatment, $Million, 2024 and 2035
- Figure 5: Europe Activated Carbon Market for Water Treatment (by End-Use Industry), $Million, 2024, 2030, and 2035
- Figure 6: Europe Activated Carbon Market for Water Treatment (by Application), $Million, 2024, 2030, and 2035
- Figure 7: Europe Activated Carbon Market for Water Treatment ((by Activated Carbon Type), $Million, 2024, 2030, and 2035
- Figure 8: Pricing Forecast, $Million/Kilo Ton, 2024-2035
- Figure 9: Patent Analysis (by Country and Company), January 2021- December 2024
- Figure 10: Use Case 1: Heavy Metals and Organic Removal in Industrial Wastewater (Germany, 2021)
- Figure 11: Use Case 2: Reusing Rinse Water by Removing Surfactants in Automotive Manufacturing (Germany, 2022)
- Figure 12: Use Case 3: Cutting COD Peaks in Biofuel Plant Wastewater (Spain, 2021)
- Figure 13: Use Case 4: Mobile PFAS Removal for Drinking Water Supply (France, 2023)
- Figure 14: Stakeholder Analysis
- Figure 15: Germany Activated Carbon Market for Water Treatment, $Million, 2024-2035
- Figure 16: France Activated Carbon Market for Water Treatment, $Million, 2024-2035
- Figure 17: U.K. Activated Carbon Market for Water Treatment, $Million, 2024-2035
- Figure 18: India Activated Carbon Market, $Million, 2024-2035
- Figure 19: Spain Activated Carbon Market, $Million, 2024-2035
- Figure 20: Poland Activated Carbon Market, $Million, 2024-2035
- Figure 21: Rest-of-Europe Activated Carbon Market for Water Treatment, $Million, 2024-2035
- Figure 22: Strategic Initiatives, January 2021-May 2025
- Figure 23: Data Triangulation
- Figure 24: Top-Down and Bottom-Up Approach
- Figure 25: Assumptions and Limitations
List of Tables
- Table 1: Market Snapshot
- Table 2: Competitive Landscape Snapshot
- Table 3: Trends: Current and Future Impact Assessment
- Table 4: Regulatory Landscape
- Table 5: Drivers, Challenges, and Opportunities, 2025-2035
- Table 6: Activated Carbon Market for Water Treatment (by Region), Kilo Ton, 2024-2035
- Table 7: Activated Carbon Market for Water Treatment (by Region), $Million, 2024-2035
- Table 8: Europe Activated Carbon Market for Water Treatment (by End-Use Industry), $Million, 2024-2035
- Table 9: Europe Activated Carbon Market for Water Treatment (by End-Use Industry), Kilo Ton, 2024-2035
- Table 10: Europe Activated Carbon Market for Water Treatment (by Application), $Million, 2024-2035
- Table 11: Europe Activated Carbon Market for Water Treatment (by Application), Kilo Ton, 2024-2035
- Table 12: Europe Activated Carbon Market for Water Treatment (by Activated Carbon Type), $Million, 2024-2035
- Table 13: Europe Activated Carbon Market for Water Treatment (by Activated Carbon Type), Kilo Ton, 2024-2035
- Table 14: Germany Activated Carbon Market for Water Treatment (by End-Use Industry), $Million, 2024-2035
- Table 15: Germany Activated Carbon Market for Water Treatment (by End-Use Industry), Kilo Ton, 2024-2035
- Table 16: Germany Activated Carbon Market for Water Treatment (by Application), $ Million, 2024-2035
- Table 17: Germany Activated Carbon Market for Water Treatment (by Application), Kilo Ton, 2024-2035
- Table 18: Germany Activated Carbon Market for Water Treatment (by Activated Carbon Type), $Million, 2024-2035
- Table 19: Germany Activated Carbon Market for Water Treatment (by Activated Carbon Type), Kilo Ton, 2024-2035
- Table 20: France Activated Carbon Market for Water Treatment (by End-Use Industry), $Million, 2024-2035
- Table 21: France Activated Carbon Market for Water Treatment (by End-Use Industry), Kilo Ton, 2024-2035
- Table 22: France Activated Carbon Market for Water Treatment (by Application), $ Million, 2024-2035
- Table 23: France Activated Carbon Market for Water Treatment (by Application), Kilo Ton, 2024-2035
- Table 24: France Activated Carbon Market for Water Treatment (by Activated Carbon Type), $Million, 2024-2035
- Table 25: France Activated Carbon Market for Water Treatment (by Activated Carbon Type), Kilo Ton, 2024-2035
- Table 26: U.K. Activated Carbon Market for Water Treatment (by End-User Industry), $Million, 2024-2035
- Table 27: U.K. Activated Carbon Market for Water Treatment (by End-User Industry), Kilo Ton,2024-2035
- Table 28: U.K. Activated Carbon Market for Water Treatment (by Application), $Million, 2024-2035
- Table 29: U.K. Activated Carbon Market for Water Treatment (by Application), Kilo Ton, 2024-2035
- Table 30: U.K. Activated Carbon Market for Water Treatment (by Activated Carbon Type), $Million, 2024-2035
- Table 31: U.K. Activated Carbon Market for Water Treatment (by Activated Carbon Type), Kilo Ton, 2024-2035
- Table 32: Italy Activated Carbon Market for Water Treatment (by End-Use Industry), $Million, 2024-2035
- Table 33: Italy Activated Carbon Market for Water Treatment (by End-Use Industry), Kilo Ton, 2024-2035
- Table 34: Italy Activated Carbon Market for Water Treatment (by Application), $Million, 2024-2035
- Table 35: Italy Activated Carbon Market for Water Treatment (by Application), Kilo Ton, 2024-2035
- Table 36: Italy Activated Carbon Market for Water Treatment (by Activated Carbon Type), $Million, 2024-2035
- Table 37: Italy Activated Carbon Market for Water Treatment (by Activated Carbon Type), Kilo Ton,2024-2035
- Table 38: Spain Activated Carbon Market for Water Treatment (by End-Use Industry), $Million, 2024-2035
- Table 39: Spain Activated Carbon Market for Water Treatment (by End-Use Industry), Kilo Ton, 2024-2035
- Table 40: Spain Activated Carbon Market for Water Treatment (by Application), $Million, 2024-2035
- Table 41: Spain Activated Carbon Market for Water Treatment (by Application), Kilo Ton, 2024-2035
- Table 42: Spain Activated Carbon Market for Water Treatment (by Activated Carbon Type), $Million, 2024-2035
- Table 43: Spain Activated Carbon Market for Water Treatment (by Activated Carbon Type), Kilo Ton, 2024-2035
- Table 44: Poland Activated Carbon Market for Water Treatment (by End-Use Industry), $Million, 2024-2035
- Table 45: Poland Activated Carbon Market for Water Treatment (by End-Use Industry), Kilo Ton, 2024-2035
- Table 46: Poland Activated Carbon Market for Water Treatment (by Application), $Million,2024-2035
- Table 47: Poland Activated Carbon Market for Water Treatment (by Application), Kilo Ton, 2024-2035
- Table 48: Poland Activated Carbon Market for Water Treatment (by Activated Carbon Type), $Million, 2024-2035
- Table 49: Poland Activated Carbon Market for Water Treatment (by Activated Carbon Type), Kilo Ton, 2024-2035
- Table 50: Rest-of-Europe Activated Carbon Market for Water Treatment (by End-Use Industry), $Million, 2024-2035
- Table 51: Rest-of-Europe Activated Carbon Market for Water Treatment (by End-Use Industry), Kilo Ton,2024-2035
- Table 52: Rest-of-Europe Activated Carbon Market for Water Treatment (by Application), $Million, 2024-2035
- Table 53: Rest-of-Europe Activated Carbon Market for Water Treatment (by Application), Kilo Ton, 2024-2035
- Table 54: Rest-of-Europe Activated Carbon Market for Water Treatment (by Activated Carbon Type), $Million, 2024-2035
- Table 55: Rest-of-Europe Activated Carbon Market for Water Treatment (by Activated Carbon Type), Kilo Ton, 2024-2035
- Table 56: Market Share, 2024
This report can be delivered in 2 working days.
Introduction to Europe Activated Carbon Market for Water Treatment
The Europe activated carbon market for water treatment is projected to reach $825.0 million by 2035 from $371.4 million in 2024, growing at a CAGR of 7.45% during the forecast period 2025-2035. Activated carbon is obtained in the European market either by reactivating spent carbon or as fresh material from wood, coconut shell, or coal. Pyrolysis of raw materials, activation, pelletizing or milling, application engineering, and closed-loop regeneration are all included in the regional value chain. High initial adsorption capacity is provided by virgin grades, and reactivated carbon lowers expenses and waste by repeatedly replenishing used media. European technological advancements focus on digital monitoring to maximize breakthrough cycles, steam-efficient rotary kiln reactivation, and customized pore-size distributions for PFAS and microorganism removal. Investment in low-energy activation technologies and bio-based feedstocks is being driven by stricter EU rules and sustainability goals.
| KEY MARKET STATISTICS | |
|---|---|
| Forecast Period | 2025 - 2035 |
| 2025 Evaluation | $402.2 Million |
| 2035 Forecast | $825.0 Million |
| CAGR | 7.45% |
Market Introduction
The market for activated carbon in water treatment in Europe is essential to guaranteeing clean, safe water for use in industrial, municipal, and environmental settings. Because of its remarkable adsorption ability, activated carbon is used to rid drinking and process water of impurities like microorganisms, PFAS, medications, pesticides, and chlorine byproducts. Both virgin carbon, which is made from coal, coconut shell, or wood, and reactivated carbon, which restores spent media for repeated use, provide a sustainable and economical alternative for the supply of carbon in Europe.
The regional value chain consists of raw material processing, activation, shape or milling, application engineering, and closed-loop regeneration. Because of their sophisticated water treatment systems, strict environmental laws, and robust industrial demand, Germany, the UK, France, and Italy are important markets. Technological developments concentrate on improving rotary-kiln reactivation efficiency, customizing pore architectures for particular pollutants, and incorporating digital monitoring to maximize performance.
The transition to bio-based feedstocks and low-energy activation techniques is being accelerated by EU regulations, especially the Drinking Water Directive, and sustainability objectives. The market for activated carbon water treatment in Europe is expected to increase steadily due to rising water shortages, industrial discharge limits, and public health awareness, all while striking a balance between innovation, environmental responsibility, and regulatory compliance.
Market Segmentation
Segmentation 1 : by End-Use Industry
- Municipal Water Treatment
- Food and Beverages
- Pharmaceutical and Medical
- Mining and Metal Recovery
- Chemical Industry
- Textile Industry
- Others
Segmentation 2: by Application
- Liquid-Phase Adsorption
- Gas-Phase Adsorption
Segmentation 3: by Activated Carbon Type
- Powdered Activated Carbon (PAC)
- Granular Activated Carbon (GAC)
- Others
Segmentation 4: by Region
- Europe
Market Trends, Drives and Challenges of Europe Activated Carbon Market for Water Treatment
Market Trends
- Growing demand for advanced water purification due to aging municipal water infrastructure in Europe.
- Shift toward environmentally friendly and sustainable activated carbon production methods, including reactivation and bio-based sources.
- Increasing application of powdered activated carbon (PAC) in municipal water treatment plants for micro-pollutant removal.
- Integration of hybrid treatment systems combining activated carbon with membrane filtration or UV disinfection.
- Adoption of stringent EU water quality regulations (e.g., Drinking Water Directive updates) driving continuous technological upgrades.
Key Market Drivers
- Declining freshwater availability and rising water stress levels in Southern and Eastern Europe.
- Stringent environmental regulations on industrial effluent discharge and municipal water treatment.
- Rapid urban population growth increasing the demand for safe drinking water.
- Rising industrial water treatment needs in sectors like food & beverage, pharmaceuticals, and chemicals.
- Increased public awareness on waterborne diseases and microplastics contamination
Major Market Challenges
- High production and reactivation costs for activated carbon compared to some chemical alternatives.
- Availability of low-cost substitutes (e.g., advanced oxidation processes, ion exchange resins) in certain applications.
- Complexity of EU regulatory compliance for imports and product specifications.
- Volatility in raw material supply (e.g., coconut shell, coal, wood) leading to cost fluctuations.
- Difficulty in handling and disposal of spent activated carbon with adsorbed hazardous compounds.
How can this report add value to an organization?
Product/Innovation Strategy: The study dissects demand by carbon type (GAC, PAC, others), by application (liquid-phase adsorption, gas-phase adsorption), and end-use industry (municipal water treatment, food and beverages, pharmaceutical and medical, mining and metal recovery, chemical industry, textile industry, and others). It outlines advances in pore-engineering that enhance PFAS uptake and highlights trends in renewable feedstocks, providing R&D teams with insights to align new grades with high-growth market segments.
Growth/Marketing Strategy: Market-share tables identify key incumbents and the service gaps they leave, guiding go-to-market plans for emerging suppliers or technology partners.
Competitive Strategy: Profiles of key players map capacities, reactivation footprints, and recent acquisitions so corporate strategists can benchmark M&A or partnership targets. Pricing-forecast and patent-filing analyses inform negotiation baselines and IP positioning.
Table of Contents
Executive Summary
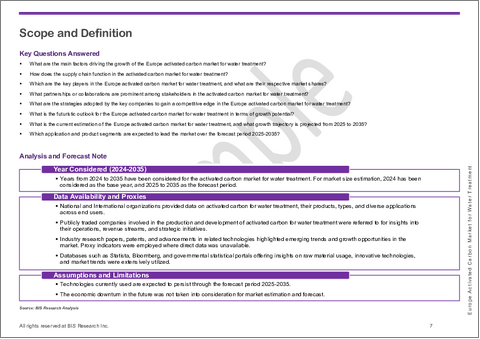
Scope and Definition
1 Market: Industry Outlook
- 1.1 Trends: Current and Future Impact Assessment
- 1.1.1 Sustainability and Circular Use of Activated Carbon
- 1.1.2 Increasing Public Awareness and Adoption of Filtration
- 1.2 Supply Chain Overview
- 1.2.1 Value Chain Analysis
- 1.2.1.1 Virgin Activated Carbon
- 1.2.1.2 Reactivated Carbon
- 1.2.2 Market Map
- 1.2.3 Pricing Forecast
- 1.2.1 Value Chain Analysis
- 1.3 Research and Development Review
- 1.3.1 Patent Filing Trend (by Number of Patents, by Country, and Company)
- 1.4 Regulatory Landscape
- 1.5 Stakeholder Analysis
- 1.5.1 Use Case
- 1.5.2 End User and Buying Criteria
- 1.6 Market Dynamics
- 1.6.1 Market Drivers
- 1.6.1.1 Stricter Water Quality Regulations
- 1.6.1.2 Growing Water Pollution and Demand for Clean Water
- 1.6.2 Market Challenges
- 1.6.2.1 Raw Material Supply Constraints and Cost Volatility
- 1.6.2.2 Spent Carbon Disposal and Environmental Concerns
- 1.6.3 Market Opportunities
- 1.6.3.1 Emerging Contaminant Remediation
- 1.6.3.2 Investment in Water Infrastructure and Reuse Projects
- 1.6.1 Market Drivers
2 Region
- 2.1 Regional Summary
- 2.2 Europe
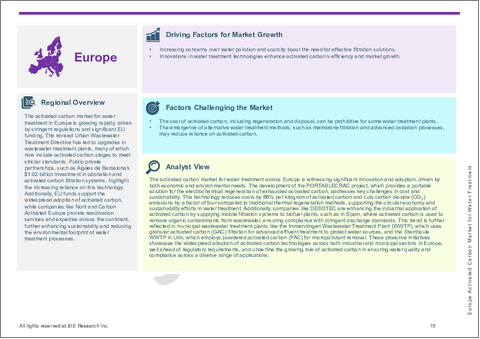
- 2.2.1 Regional Overview
- 2.2.2 Driving Factors for Market Growth
- 2.2.3 Factors Challenging the Market
- 2.2.4 Application
- 2.2.5 Product
- 2.2.6 Europe (by Country)
- 2.2.6.1 Germany
- 2.2.6.1.1 Application
- 2.2.6.1.2 Product
- 2.2.6.2 France
- 2.2.6.2.1 Application
- 2.2.6.2.2 Product
- 2.2.6.3 U.K.
- 2.2.6.3.1 Application
- 2.2.6.3.2 Product
- 2.2.6.4 Italy
- 2.2.6.4.1 Application
- 2.2.6.4.2 Product
- 2.2.6.5 Spain
- 2.2.6.5.1 Application
- 2.2.6.5.2 Product
- 2.2.6.6 Poland
- 2.2.6.6.1 Application
- 2.2.6.6.2 Product
- 2.2.6.7 Rest-of-Europe
- 2.2.6.7.1 Application
- 2.2.6.7.2 Product
- 2.2.6.1 Germany
3 Markets - Competitive Benchmarking & Company Profiles
- 3.1 Jacobi Carbons AB (Osaka Gas Chemicals Co., Ltd.)
- 3.1.1 Overview
- 3.1.2 Top Products/Product Portfolio
- 3.1.3 Top Competitors
- 3.1.4 Target Customers
- 3.1.5 Key Personal
- 3.1.6 Analyst View
- 3.1.7 Market Share, 2024
- 3.2 Silcarbon Aktivkohle GmbH
- 3.2.1 Overview
- 3.2.2 Top Products/Product Portfolio
- 3.2.3 Top Competitors
- 3.2.4 Target Customers
- 3.2.5 Key Personal
- 3.2.6 Analyst View
- 3.2.7 Market Share, 2024
- 3.3 Norit
- 3.3.1 Overview
- 3.3.2 Top Products/Product Portfolio
- 3.3.3 Top Competitors
- 3.3.4 Target Customers
- 3.3.5 Key Personal
- 3.3.6 Analyst View
- 3.3.7 Market Share, 2024
- 3.4 CarboTech AC GmbH
- 3.4.1 Overview
- 3.4.2 Top Products/Product Portfolio
- 3.4.3 Top Competitors
- 3.4.4 Target Customers
- 3.4.5 Key Personal
- 3.4.6 Analyst View
- 3.4.7 Market Share, 2024
- 3.5 Donau Carbon GmbH
- 3.5.1 Overview
- 3.5.2 Top Products/Product Portfolio
- 3.5.3 Top Competitors
- 3.5.4 Target Customers
- 3.5.5 Key Personal
- 3.5.6 Analyst View
- 3.5.7 Market Share, 2024
- 3.6 Desotec NV
- 3.6.1 Overview
- 3.6.2 Top Products/Product Portfolio
- 3.6.3 Top Competitors
- 3.6.4 Target Customers
- 3.6.5 Key Personal
- 3.6.6 Analyst View
- 3.6.7 Market Share, 2024
- 3.7 Other Key Companies
4 Research Methodology
- 4.1 Data Sources
- 4.1.1 Primary Data Sources
- 4.1.2 Secondary Data Sources
- 4.1.3 Data Triangulation
- 4.2 Market Estimation and Forecast


