|
|
市場調査レポート
商品コード
1794366
アジア太平洋の水処理用活性炭市場:用途別、製品別、国別 - 分析と予測(2025年~2035年)Asia-Pacific Activated Carbon Market for Water Treatment: Focus on Application, Product, and Country - Analysis and Forecast, 2025-2035 |
||||||
カスタマイズ可能
|
|||||||
| アジア太平洋の水処理用活性炭市場:用途別、製品別、国別 - 分析と予測(2025年~2035年) |
|
出版日: 2025年08月20日
発行: BIS Research
ページ情報: 英文 72 Pages
納期: 1~5営業日
|
全表示
- 概要
- 図表
- 目次
アジア太平洋の水処理用活性炭の市場規模は、2024年の11億4,940万米ドルから2035年には34億9,670万米ドルに達し、予測期間の2025年~2035年のCAGRは10.57%になると予測されています。
アジア太平洋市場で活性炭を得るには、石炭、木材、ヤシ殻を原料とする再生炭素と新鮮な原料の2つの方法があります。原料の熱分解、活性化、ペレット化または粉砕、アプリケーション・エンジニアリング、クローズドループ再生はすべて、この地域のバリューチェーンの構成要素です。高い初期吸着容量はバージン・グレードから得られますが、再活性化カーボンは頻繁な媒体補充を必要とするため、経費と廃棄物を削減します。エネルギー効率の高いロータリーキルンによる再活性化、工業用・自治体用水処理のための細孔分布の改善、およびブレークスルー・サイクルを延長するためのデジタル監視システムとの統合が、アジア太平洋における技術的イニシアチブの主な焦点です。水質規制の拡大と環境目標によって、現地で入手できるバイオベースの原料や低エネルギー活性化手順への投資が刺激されています。
| 主要市場統計 | |
|---|---|
| 予測期間 | 2025年~2035年 |
| 2025年の評価 | 12億7,970万米ドル |
| 2035年の予測 | 34億9,670万米ドル |
| CAGR | 10.57% |
市場イントロダクション
急速な都市化、産業の拡大、水質に対する規制圧力の高まりが、アジア太平洋の水処理用活性炭市場の堅調な成長を牽引しています。石炭、木材、ヤシ殻などの基本材料から製造される活性炭は、農薬、塩素副生成物、有機汚染物質、PFASや薬剤などの新たな有害物質の除去に不可欠です。アジア太平洋における活性炭の用途には、水のリサイクル・プログラム、工業廃水処理、自治体の浄水などがあります。
粒状活性炭(GAC)は、大規模プラントでの連続ろ過のために自治体ユーティリティでますます採用されている一方、粉末活性炭(PAC)は、緊急の汚染事象や季節的な処理の急増のために利用されています。性能と費用対効果のバランスをとるため、バージンカーボンと再活性化カーボンの両方が、原料処理、活性化、ペレット化または粉砕、アプリケーションエンジニアリング、再生を含む地域のバリューチェーンで広く使用されています。
最先端の治療技術への投資は、誰もが清潔な飲料水を利用できるようにするための政府のプログラムや、より厳しい業界の排出規制によって推進されています。さらに、水のリサイクルや再利用を促進する活性炭技術の利用は、水不足の深刻化により急速に拡大しています。システムの性能と寿命を向上させるため、アジア太平洋ではエネルギー効率の高い活性化技術、最適化された細孔構造、デジタルモニタリングとの統合に技術の進歩が集中しています。
市場セグメンテーション:
セグメンテーション1:最終用途産業別
- 自治体の水処理
- 食品・飲料
- 医薬品・医療
- 鉱業・金属回収
- 化学工業
- 繊維産業
- その他
セグメンテーション2:用途別
- 液相吸着
- 気相吸着
セグメント3:活性炭タイプ別
- 粉末活性炭(PAC)
- 粒状活性炭(GAC)
- その他
セグメント4:地域別
- アジア太平洋
アジア太平洋の水処理用活性炭市場の動向と課題
市場動向
- アジア太平洋では、より厳しい水質基準を満たすため、活性炭ろ過を含む高度な水処理技術の採用が増加しています。
- 有機化合物や汚染物質の吸着除去効率の高さから活性炭が支持され、従来の治療方法からより持続可能で効率的なソリューションへのシフト。
- 市水需要の拡大- 市水処理分野は、都市化と政府支援プロジェクトにより、東南アジア諸国で急速に拡大しています。
- 工業用水の再利用とリサイクル構想の拡大が、製造、電力、食品加工における活性炭ベースのシステム需要を牽引しています。
- 巨大都市(デリー、ジャカルタ、マニラなど)における人口密度の上昇により廃水量が増加し、公益事業者はより堅牢な処理プロセスの採用を迫られています。
主な市場促進要因
- 人口増加と急速な都市化が進むアジア太平洋では、水需要と廃水発生量が大幅に増加すると予測されます。
- アジア太平洋の先進国、発展途上国の両方で水道インフラが老朽化しており、活性炭システムを含むアップグレードが必要となっています。
- 厳しい環境規制により、より効果的な汚染物質除去ソリューションが産業界や自治体に求められています。
- 淡水利用可能量の減少と水不足問題の高まりにより、効率的な水浄化技術が急務となっています。
- 水使用量の多いセクター(石油・ガス、パルプ・製紙、鉱業)における産業拡大が、効果的な水処理薬品とろ過媒体への需要を促進しています。
- 水系感染症や汚染事故に対する公衆衛生上の懸念が、活性炭ろ過への自治体投資を後押ししています。
主な市場課題
- 大規模な活性炭システムは、いくつかの代替治療法と比較して運用コストが高いです。
- 特定の用途における費用対効果の高い代替技術(膜ろ過、高度酸化プロセスなど)との競合。
- 活性炭原料のサプライチェーンの不安定性(特に特定のアジア太平洋諸国から供給されるヤシ殻ベースの炭素)。
- 農村部や低開発地域におけるインフラと資金の不足が、高度処理システムの採用を制限しています。
- アジア太平洋諸国間の規制のばらつきが、標準化と国境を越えた技術展開に複雑さをもたらしています。
製品/イノベーション戦略:本調査では、カーボンタイプ別(GAC、PAC、その他)、用途別(液相吸着、気相吸着)、最終用途産業別(都市水処理、飲食品、製薬・医療、鉱業・金属回収、化学産業、繊維産業、その他)の需要を分析しています。PFASの取り込みを促進する細孔工学の進歩を概説し、再生可能原料の動向を明らかにすることで、研究開発チームに新グレードを高成長市場セグメントに適合させるための洞察を提供します。
成長/マーケティング戦略:市場シェア表は、主要な既存企業と、それらが残すサービスギャップを特定し、新興サプライヤーや技術パートナーの市場参入計画を導きます。
競合戦略:主要企業のプロファイルは、能力、再活性化の足跡、最近の買収をマッピングし、企業戦略家がM&Aや提携のターゲットをベンチマークできるようにします。価格予測や特許出願分析は、交渉のベースラインやIPポジショニングに役立ちます。
目次
エグゼクティブサマリー
第1章 市場:業界展望
- 動向:現状と将来への影響評価
- サプライチェーンの概要
- バリューチェーン分析
- 市場マップ
- 価格予測
- 研究開発レビュー
- 特許出願動向(特許件数別、国別、企業別)
- 規制状況
- ステークホルダー分析
- エンドユーザーと購入基準
- 市場力学
- 市場の促進要因
- 市場の課題
- 市場の機会
第2章 地域
- 地域のサマリー
- アジア太平洋
- 地域概要
- 市場成長促進要因
- 市場成長抑制要因
- 応用
- 製品
- アジア太平洋(国別)
第3章 市場-競合ベンチマーキングと企業プロファイル
- KURARAY CO., LTD
- Haycarb PLC
- Kureha Corporation
- Boyce Carbon
第4章 調査手法
List of Figures
- Figure 1: Asia-Pacific Activated Carbon Market for Water Treatment (by Scenario), $Million, 2025, 2030, and 2035
- Figure 2: Asia-Pacific Activated Carbon Market for Water Treatment, 2024 and 2035
- Figure 3: Activated Carbon Market for Water Treatment, $Million, 2024 and 2035
- Figure 4: Asia-Pacific Activated Carbon Market for Water Treatment (by End-Use Industry), $Million, 2024, 2030, and 2035
- Figure 5: Asia-Pacific Activated Carbon Market for Water Treatment (by Application), $Million, 2024, 2030, and 2035
- Figure 6: Asia-Pacific Activated Carbon Market for Water Treatment (by Activated Carbon Type), $Million, 2024, 2030, and 2035
- Figure 7: Pricing Forecast, $Million/Kilo Ton, 2024-2035
- Figure 8: Patent Analysis (by Country and Company), January 2021- December 2024
- Figure 9: Stakeholder Analysis
- Figure 10: China Activated Carbon Market for Water Treatment, $Million, 2024-2035
- Figure 11: Japan Activated Carbon Market for Water Treatment $Million, 2024-2035
- Figure 12: India Activated Carbon Market, $Million, 2024-2035
- Figure 13: South Korea Activated Carbon Market, $Million, 2024-2035
- Figure 14: Rest-of-Asia-Pacific Activated Carbon Market for Water Treatment, $Million, 2024-2035
- Figure 15: Strategic Initiatives, January 2021-May 2025
- Figure 16: Data Triangulation
- Figure 17: Top-Down and Bottom-Up Approach
- Figure 18: Assumptions and Limitations
List of Tables
- Table 1: Market Snapshot
- Table 2: Competitive Landscape Snapshot
- Table 3: Trends: Current and Future Impact Assessment
- Table 4: Regulatory Landscape
- Table 5: Drivers, Challenges, and Opportunities, 2025-2035
- Table 6: Activated Carbon Market for Water Treatment (by Region), Kilo Ton, 2024-2035
- Table 7: Activated Carbon Market for Water Treatment (by Region), $Million, 2024-2035
- Table 8: Asia-Pacific Activated Carbon Market for Water Treatment (by End-Use Industry), $Million, 2024-2035
- Table 9: Asia-Pacific Activated Carbon Market for Water Treatment (by End-Use Industry), Kilo Ton, 2024-2035
- Table 10: Asia-Pacific Activated Carbon Market for Water Treatment (by Application), $Million, 2024-2035
- Table 11: Asia-Pacific Activated Carbon Market for Water Treatment (by Application), Kilo Ton, 2024-2035
- Table 12: Asia-Pacific Activated Carbon Market for Water Treatment (by Activated Carbon Type), $Million, 2024-2035
- Table 13: Asia-Pacific Activated Carbon Market for Water Treatment (by Activated Carbon Type), Kilo Ton, 2024-2035
- Table 14: China Activated Carbon Market for Water Treatment (by End-Use Industry), $Million, 2024-2035
- Table 15: China Activated Carbon Market for Water Treatment (by End-Use Industry), Kilo Ton, 2024-2035
- Table 16: China Activated Carbon Market for Water Treatment (by Application), $Million,2024-2035
- Table 17: China Activated Carbon Market for Water Treatment (by Application), Kilo Ton, 2024-2035
- Table 18: China Activated Carbon Market for Water Treatment (by Activated Carbon Type), $Million, 2024-2035
- Table 19: China Activated Carbon Market for Water Treatment (by Activated Carbon Type), Kilo Ton, 2024-2035
- Table 20: Japan Activated Carbon Market for Water Treatment (by End-Use Industry), $Million, 2024-2035
- Table 21: Japan Activated Carbon Market for Water Treatment (by End-Use Industry), Kilo Ton, 2024-2035
- Table 22: Japan Activated Carbon Market for Water Treatment (by Application), $ Million, 2024-2035
- Table 23: Japan Activated Carbon Market for Water Treatment (by Application), Kilo Ton, 2024-2035
- Table 24: Japan Activated Carbon Market for Water Treatment (by Activated Carbon Type), $Million, 2024-2035
- Table 25: Japan Activated Carbon Market for Water Treatment (by Activated Carbon Type), Kilo Ton, 2024-2035
- Table 26: India Activated Carbon Market for Water Treatment (by End-Use Industry), $Million, 2024-2035
- Table 27: India Activated Carbon Market for Water Treatment (by End-Use Industry), Kilo Ton, 2024-2035
- Table 28: India Activated Carbon Market for Water Treatment (by Application), $Million, 2024-2035
- Table 29: India Activated Carbon Market for Water Treatment (by Application), Kilo Ton, 2024-2035
- Table 30: India Activated Carbon Market for Water Treatment (by Activated Carbon Type), $Million, 2024-2035
- Table 31: India Activated Carbon Market for Water Treatment (by Activated Carbon Type), Kilo Ton,2024-2035
- Table 32: South Korea Activated Carbon Market for Water Treatment (by End-Use Industry), $Million, 2024-2035
- Table 33: South Korea Activated Carbon Market for Water Treatment (by End-Use Industry), Kilo Ton, 2024-2035
- Table 34: South Korea Activated Carbon Market for Water Treatment (by Application), $Million, 2024-2035
- Table 35: South Korea Activated Carbon Market for Water Treatment (by Application), Kilo Ton, 2024-2035
- Table 36: South Korea Activated Carbon Market for Water Treatment (by Activated Carbon Type), $Million, 2024-2035
- Table 37: South Korea Activated Carbon Market for Water Treatment (by Activated Carbon Type), Kilo Ton, 2024-2035
- Table 38: Rest-of-Asia-Pacific Activated Carbon Market for Water Treatment (by End-Use Industry), $Million, 2024-2035
- Table 39: Rest-of-Asia-Pacific Activated Carbon Market for Water Treatment (by End-Use Industry), Kilo Ton,2024-2035
- Table 40: Rest-of-Asia-Pacific Activated Carbon Market for Water Treatment (by Application), $Million, 2024-2035
- Table 41: Rest-of-Asia-Pacific Activated Carbon Market for Water Treatment (by Application), Kilo Ton, 2024-2035
- Table 42: Rest-of-Asia-Pacific Activated Carbon Market for Water Treatment (by Activated Carbon Type), $Million, 2024-2035
- Table 43: Rest-of-Asia-Pacific Activated Carbon Market for Water Treatment (by Activated Carbon Type), Kilo Ton, 2024-2035
- Table 44: Market Share, 2024
This report can be delivered in 2 working days.
Introduction to Asia-Pacific Activated Carbon Market for Water Treatment
The Asia-Pacific activated carbon market for water treatment is projected to reach $3,496.7 million by 2035 from $1,149.4 million in 2024, growing at a CAGR of 10.57% during the forecast period 2025-2035. Reactivated carbon or fresh material made from coal, wood, or coconut shell are the two ways that activated carbon is obtained in the APAC market. Raw material pyrolysis, activation, pelletizing or milling, application engineering, and closed-loop regeneration are all components of the regional value chain. High initial adsorption capacity is provided by virgin grades, but reactivated carbon lowers expenses and waste by requiring frequent media replenishment. Energy-efficient rotary kiln reactivation, enhanced pore-size distributions for industrial and municipal water treatment, and integration with digital monitoring systems to prolong breakthrough cycles are the main focuses of technological initiatives in Asia-Pacific. Investments in locally obtained bio-based feedstocks and low-energy activation procedures are being stimulated by expanding water quality restrictions and environmental goals.
| KEY MARKET STATISTICS | |
|---|---|
| Forecast Period | 2025 - 2035 |
| 2025 Evaluation | $1,279.7 Million |
| 2035 Forecast | $3,496.7 Million |
| CAGR | 10.57% |
Market Introduction
Rapid urbanization, industrial expansion, and mounting regulatory pressure on water quality are driving the robust growth of the Asia-Pacific (APAC) activated carbon market for water treatment. Produced from basic materials including coal, wood, and coconut shell, activated carbon is essential for eliminating pesticides, chlorine byproducts, organic pollutants, and new toxins like PFAS and medications. Its use in APAC includes water recycling programs, industrial wastewater treatment, and municipal water purification.
Granular activated carbon (GAC) is being employed more and more by municipal utilities for continuous filtering in large-scale plants, whereas powdered activated carbon (PAC) is utilized for emergency contamination events or seasonal treatment surges. In order to balance performance and cost effectiveness, both virgin and reactivated carbon are widely used in the region's value chain, which includes raw material processing, activation, pelletizing or milling, application engineering, and regeneration.
Investment in cutting-edge treatment technologies is being driven by government programs to ensure that everyone has access to clean drinking water as well as more stringent industry discharge regulations. Furthermore, the usage of activated carbon technology to facilitate water recycling and reuse is growing faster due to growing water constraint. In order to increase system performance and lifetime, technological advancements in APAC are concentrated on energy-efficient activation techniques, optimized pore architectures, and integration with digital monitoring.
Market Segmentation:
Segmentation 1 : by End-Use Industry
- Municipal Water Treatment
- Food and Beverages
- Pharmaceutical and Medical
- Mining and Metal Recovery
- Chemical Industry
- Textile Industry
- Others
Segmentation 2: by Application
- Liquid-Phase Adsorption
- Gas-Phase Adsorption
Segmentation 3: by Activated Carbon Type
- Powdered Activated Carbon (PAC)
- Granular Activated Carbon (GAC)
- Others
Segmentation 4: by Region
- Asia-Pacific
Market Trends, Drives and Challenges of APAC Activated Carbon Market for Water Treatment
Market Trends
- Increasing adoption of advanced water treatment technologies, including activated carbon filtration, to meet stricter water quality standards in APAC.
- Shift from traditional treatment methods toward more sustainable and efficient solutions, with activated carbon favored for its adsorption efficiency in removing organic compounds and contaminants.
- Growing municipal demand - the municipal water treatment segment is expanding rapidly in Southeast Asian countries due to urbanization and government-backed projects.
- Expansion of industrial water reuse and recycling initiatives driving demand for activated carbon-based systems in manufacturing, power, and food processing.
- Rising population density in megacities (e.g., Delhi, Jakarta, Manila) increasing wastewater volumes and pressuring utilities to adopt more robust treatment processes.
Key Market Drivers
- Population growth and rapid urbanization in APAC, projected to increase water demand and wastewater generation significantly.
- Aging water infrastructure in both developed and developing APAC nations, necessitating upgrades that include activated carbon systems.
- Stringent environmental regulations pushing industries and municipalities toward more effective contaminant removal solutions.
- Declining freshwater availability and rising water scarcity issues, creating urgency for efficient water purification technologies.
- Industrial expansion in high water-use sectors (oil & gas, pulp & paper, mining) driving demand for effective water treatment chemicals and filtration media.
- Public health concerns over waterborne diseases and contamination incidents, boosting municipal investment in activated carbon filtration.
Major Market Challenges
- High operational costs for large-scale activated carbon systems compared to some alternative treatment methods.
- Competition from cost-effective alternative technologies (e.g., membrane filtration, advanced oxidation processes) in certain applications.
- Supply chain volatility in activated carbon raw materials (especially coconut shell-based carbon sourced from specific APAC countries).
- Lack of infrastructure and funding in rural and underdeveloped regions, limiting the adoption of advanced treatment systems.
- Regulatory variability across APAC nations, creating complexities for standardization and cross-border technology deployment.
How can this report add value to an organization?
Product/Innovation Strategy: The study dissects demand by carbon type (GAC, PAC, others), by application (liquid-phase adsorption, gas-phase adsorption), and end-use industry (municipal water treatment, food and beverages, pharmaceutical and medical, mining and metal recovery, chemical industry, textile industry, and others). It outlines advances in pore-engineering that enhance PFAS uptake and highlights trends in renewable feedstocks, providing R&D teams with insights to align new grades with high-growth market segments.
Growth/Marketing Strategy: Market-share tables identify key incumbents and the service gaps they leave, guiding go-to-market plans for emerging suppliers or technology partners.
Competitive Strategy: Profiles of key players map capacities, reactivation footprints, and recent acquisitions so corporate strategists can benchmark M&A or partnership targets. Pricing-forecast and patent-filing analyses inform negotiation baselines and IP positioning.
Table of Contents
Executive Summary
Scope and Definition
1 Market: Industry Outlook
- 1.1 Trends: Current and Future Impact Assessment
- 1.1.1 Sustainability and Circular Use of Activated Carbon
- 1.1.2 Increasing Public Awareness and Adoption of Filtration
- 1.2 Supply Chain Overview
- 1.2.1 Value Chain Analysis
- 1.2.1.1 Virgin Activated Carbon
- 1.2.1.2 Reactivated Carbon
- 1.2.2 Market Map
- 1.2.3 Pricing Forecast
- 1.2.1 Value Chain Analysis
- 1.3 Research and Development Review
- 1.3.1 Patent Filing Trend (by Number of Patents, by Country, and Company)
- 1.4 Regulatory Landscape
- 1.5 Stakeholder Analysis
- 1.5.1 End User and Buying Criteria
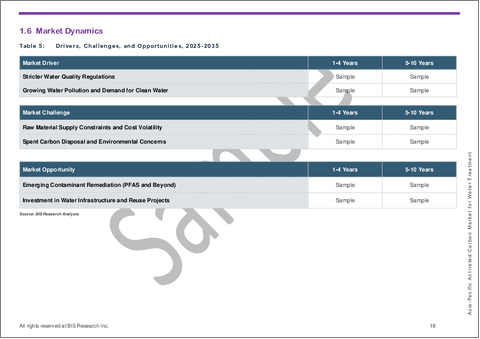
- 1.6 Market Dynamics
- 1.6.1 Market Drivers
- 1.6.1.1 Stricter Water Quality Regulations
- 1.6.1.2 Growing Water Pollution and Demand for Clean Water
- 1.6.2 Market Challenges
- 1.6.2.1 Raw Material Supply Constraints and Cost Volatility
- 1.6.2.2 Spent Carbon Disposal and Environmental Concerns
- 1.6.3 Market Opportunities
- 1.6.3.1 Emerging Contaminant Remediation
- 1.6.3.2 Investment in Water Infrastructure and Reuse Projects
- 1.6.1 Market Drivers
2 Region
- 2.1 Regional Summary
- 2.2 Asia-Pacific
- 2.2.1 Regional Overview
- 2.2.2 Driving Factors for Market Growth
- 2.2.3 Factors Challenging the Market
- 2.2.4 Application
- 2.2.5 Product
- 2.2.6 Asia-Pacific (by Country)
- 2.2.6.1 China
- 2.2.6.1.1 Application
- 2.2.6.1.2 Product
- 2.2.6.2 Japan
- 2.2.6.2.1 Application
- 2.2.6.2.2 Product
- 2.2.6.3 India
- 2.2.6.3.1 Application
- 2.2.6.3.2 Product
- 2.2.6.4 South Korea
- 2.2.6.4.1 Application
- 2.2.6.4.2 Product
- 2.2.6.5 Rest-of-Asia-Pacific
- 2.2.6.5.1 Application
- 2.2.6.5.2 Product
- 2.2.6.1 China
3 Markets - Competitive Benchmarking & Company Profiles
- 3.1 KURARAY CO., LTD
- 3.1.1 Overview
- 3.1.2 Top Products/Product Portfolio
- 3.1.3 Top Competitors
- 3.1.4 Target Customers
- 3.1.5 Key Personal
- 3.1.6 Analyst View
- 3.1.7 Market Share, 2024
- 3.2 Haycarb PLC
- 3.2.1 Overview
- 3.2.2 Company Financials
- 3.2.3 Top Products/Product Portfolio
- 3.2.4 Top Competitors
- 3.2.5 Target Customers
- 3.2.6 Key Personal
- 3.2.7 Analyst View
- 3.2.8 Market Share, 2024
- 3.3 Kureha Corporation
- 3.3.1 Overview
- 3.3.2 Top Products/Product Portfolio
- 3.3.3 Top Competitors
- 3.3.4 Target Customers
- 3.3.5 Key Personal
- 3.3.6 Analyst View
- 3.3.7 Market Share, 2024
- 3.4 Boyce Carbon
- 3.4.1 Overview
- 3.4.2 Top Products/Product Portfolio
- 3.4.3 Top Competitors
- 3.4.4 Target Customers
- 3.4.5 Key Personal
- 3.4.6 Analyst View
- 3.4.7 Market Share, 2024
4 Research Methodology
- 4.1 Data Sources
- 4.1.1 Primary Data Sources
- 4.1.2 Secondary Data Sources
- 4.1.3 Data Triangulation
- 4.2 Market Estimation and Forecast


