|
|
市場調査レポート
商品コード
1778602
量子ドットフォトニックナイトビジョンセンサーアレイ市場 - 世界および地域別分析:用途別、製品タイプ別、国別 - 分析と予測(2025年~2035年)Quantum Dot Photonic Night Vision Sensor Array Market - A Global and Regional Analysis: Focus on Application, Product Type, and Country-Level Analysis - Analysis and Forecast, 2025-2035 |
||||||
|
|||||||
カスタマイズ可能
|
|||||||

| 量子ドットフォトニックナイトビジョンセンサーアレイ市場 - 世界および地域別分析:用途別、製品タイプ別、国別 - 分析と予測(2025年~2035年) |
|
出版日: 2025年07月30日
発行: BIS Research
ページ情報: 英文 120 Pages
納期: 1~5営業日
|

全表示
- 概要
- 図表
- 目次
量子ドットフォトニックナイトビジョンセンサーアレイ(QD-PNVSA)は、半導体量子ドットを薄い光吸収膜としてシリコン読み取り回路上に直接蒸着した固体画像センシングチップです。
ナノ結晶層は、微弱な可視および短波長の赤外線光子を各ピクセル内の電荷に変換し、受動的に冷却された焦点面アレイは、確立された相補型金属酸化膜半導体(CMOS)製造フローと互換性を保ちながら、星明りまたは完全な暗闇で高コントラストの画像を提供することができます。
量子ドットフォトニックナイトビジョンセンサーアレイ市場は、ヘルメット搭載型ビューワー、兵士用照準器、小型無人プラットフォーム向けに、インジウムガリウムヒ素や水銀カドミウムテルル検出器に代わる、より軽量で安価なものを求める防衛・安全保障機関によって成長しています。産業オートメーションや自律型モビリティの開発企業も、煙や霞、プラスチック筐体を見通すことができる広帯域センサーに注目しており、ハイパースペクトル分析企業は、調整可能なバンドエッジとマルチスペクトル・レスポンスを持つ量子ドット膜を高く評価しています。吸収体は低温で溶液処理されるため、サプライヤーは量産ウエハファブを活用し、コストを民生用エレクトロニクスの閾値に近づけることができます。
| 主要市場統計 | |
|---|---|
| 予測期間 | 2025年~2035年 |
| 2025年の評価 | 1億4,120万米ドル |
| 2035年の予測 | 7億2,000万米ドル |
| CAGR | 17.69% |
この技術はまだ自明ではないハードルに直面しています。コロイド膜はエピタキシャルIII-Vアレイよりもキャリア移動度と光変換効率が低く、配位子エンジニアリングとドーピング制御によって感度のギャップを埋めなければなりません。鉛や水銀をベースとする組成物は、環境問題や輸出コンプライアンス上の問題を引き起こすため、主要企業はより毒性の低い化学物質に目を向けるようになります。長期安定性、ウエハレベルの均一性、ピクセル間のばらつきによって生じるスクリーンドアのアーティファクトは、依然として重要な信頼性の問題点です。
一方、量子ドットフォトニックナイトビジョンセンサーアレイ市場においては、モノリシック成膜がウエハレベルの微細化、ピクセルピッチの縮小、ロジックとのシームレスな統合を可能にし、スマートフォン、複合現実感ヘッドセット、ADAS(先進運転支援システム)に可視光と赤外線を組み合わせたカメラを搭載する道を開きます。新興の重金属フリーの量子ドット製剤とハイブリッド・ナノ光電子スタックは、アドレス可能な波長窓を広げ、消費者市場への道をスムーズに開きます。政府のデジタルナイトビジョン近代化計画や気候変動への対応(山火事の煙モニタリングなど)は、川下需要をさらに拡大します。
市場ライフサイクルステージ
世界の量子ドットフォトニックナイトビジョンセンサーアレイ市場は、現在、ライフサイクルの開発初期段階にあります。ナイトビジョンアレイシステムの進歩、量子フォトニクスの開発による効率的で費用対効果の高いソリューションへの需要の高まりにより、この市場は急速に拡大しています。量子ドットフォトニック暗視センサアレイ市場は、超高感度NIR応答性の革新と、非毒性でCMOS統合可能な材料への移行が需要を牽引すると予想されています。
量子ドットフォトニックナイトビジョンセンサーアレイの世界市場セグメンテーション:
セグメンテーション1:用途別
- 防衛・セキュリティイメージング
- 工業検査・マシンビジョン
- 自動車/モビリティ
- 監視・スマートシティCCTV
- その他
防衛・セキュリティイメージングは、世界の量子ドットフォトニック暗視センサアレイ市場において顕著な用途セグメントの1つです。
セグメンテーション2:製品タイプ別
- モノリシックCQDオンCMOS SWIRアレイ
- 量子膜可視/近赤外モバイルセンサー
- HgTe CQD拡張SWIR/eSWIRアレイ
- その他
セグメンテーション3:地域別
- 北米 - 米国、カナダ、メキシコ
- 欧州 - ドイツ、フランス、英国、イタリア、スペイン、その他
- アジア太平洋 - 中国、日本、韓国、インド、その他
- その他の地域 - 南米、中東アフリカ
世界の量子ドットフォトニックナイトビジョンセンサーアレイ市場では、北米が継続的な成長と主要メーカーの存在により、生産面で牽引役となると予測されています。
主要市場参入企業と競合の要約
世界の量子ドットフォトニックナイトビジョンセンサーアレイ市場は、SWIR Vision Systems、Emberion、Quantum Solutions、Qurv Technologies、IMECなどの主要企業が存在し、導入の初期段階にあります。これらの企業は、高度な製造技術、広範な研究開発、エンドユーザー用途との戦略的パートナーシップを通じて、初期段階から開発を進めています。新興企業は、防衛、自動車、産業など幅広い用途で高性能ナイトビジョンアレイシステムに対する需要の高まりに対応するため、持続可能でコスト効率の高いソリューションに注力しています。同市場は、技術的進歩、規制遵守、スマートシティにおける監視の増加などを背景とした激しい競合によって特徴付けられ、バリューチェーン全体にわたる急速な技術革新と協力関係をもたらしています。
量子ドットフォトニックナイトビジョンセンサーアレイ市場で著名な企業は以下の通りです:
- SWIR Vision Systems
- Emberion
- Quantum Solutions
- Qurv Technologies
- IMEC
- STMicroelectronics
- Nanoco Technologies
- onsemi
- Ray Imaging Solutions
- New Imaging Technologies (NIT)
- Sony Semiconductor Solutions
- CSEM
- Graphenea
- Tetramer Technologies
- Samsung Semiconductor
当レポートでは、世界の量子ドットフォトニックナイトビジョンセンサーアレイ市場について調査し、市場の概要とともに、用途別、製品タイプ別、国別の動向、および市場に参入する企業のプロファイルなどを提供しています。
目次
エグゼクティブサマリー
第1章 市場:業界展望
- 動向:現状と将来への影響評価
- 動向:概要
- 非毒性、CMOS統合可能な材料への移行
- SWIRとブロードバンド機能への移行
- サプライチェーンの概要
- バリューチェーン分析
- 市場マップ
- 研究開発レビュー
- 国別・企業別特許出願動向
- 規制状況
- 市場力学の概要
- 市場促進要因
- 市場抑制要因
- 市場機会
第2章 用途
- 用途のセグメンテーション
- 用途のサマリー
- 量子ドットフォトニックナイトビジョンセンサーアレイ市場(用途別)
- 防衛・セキュリティイメージング
- 産業検査・マシンビジョン
- 自動車/モビリティ
- 監視・スマートシティのCCTV
- その他
第3章 製品
- 製品のセグメンテーション
- 製品のサマリー
- 量子ドットフォトニックナイトビジョンセンサーアレイ市場(製品タイプ別)
- CMOS SWIRアレイ上のモノリシックCQD
- 量子フィルム可視/近赤外線モバイルセンサー
- HgTe CQD拡張SWIR/eSWIRアレイ
- その他
第4章 地域
- 地域のサマリー
- 促進要因と抑制要因
- 北米
- 欧州
- アジア太平洋
- その他の地域
第5章 市場-競合情勢と企業プロファイル
- 今後の見通し
- 地理的評価
- 企業プロファイル
- SWIR Vision Systems
- Emberion
- Quantum Solutions
- Qurv Technologies
- IMEC
- STMicroelectronics
- Nanoco Technologies
- Onsemi
- Ray Imaging Solutions
- New Imaging Technologies (NIT)
- Sony Semiconductor Solutions
- CSEM
- Graphenea
- Tetramer Technologies
- Samsung Semiconductor
- その他の主要参入企業のリスト
第6章 調査手法
List of Figures
- Figure 1: Quantum Dot Photonic Night Vision Sensor Array Market (by Scenario), $Million, 2025, 2028, and 2035
- Figure 2: Quantum Dot Photonic Night Vision Sensor Array Market (by Region), $Million, 2024, 2027, and 2035
- Figure 3: Quantum Dot Photonic Night Vision Sensor Array Market (by Application), $Million, 2024, 2028, and 2035
- Figure 4: Quantum Dot Photonic Night Vision Sensor Array Market (by Product), $Million, 2024, 2025, and 2035
- Figure 5: Competitive Landscape Snapshot
- Figure 6: Supply Chain Analysis
- Figure 7: Value Chain Analysis
- Figure 8: Patent Analysis (by Country), January 2021-June 2025
- Figure 9: Patent Analysis (by Company), January 2021-June 2025
- Figure 10: Impact Analysis of Market Navigating Factors, 2024-2035
- Figure 11: U.S. Quantum Dot Photonic Night Vision Sensor Array Market, $Million, 2024-2035
- Figure 12: Canada Quantum Dot Photonic Night Vision Sensor Array Market, $Million, 2024-2035
- Figure 13: Mexico Quantum Dot Photonic Night Vision Sensor Array Market, $Million, 2024-2035
- Figure 14: Germany Quantum Dot Photonic Night Vision Sensor Array Market, $Million, 2024-2035
- Figure 15: France Quantum Dot Photonic Night Vision Sensor Array Market, $Million, 2024-2035
- Figure 16: U.K. Quantum Dot Photonic Night Vision Sensor Array Market, $Million, 2024-2035
- Figure 17: Italy Quantum Dot Photonic Night Vision Sensor Array Market, $Million, 2024-2035
- Figure 18: Spain Quantum Dot Photonic Night Vision Sensor Array Market, $Million, 2024-2035
- Figure 19: Rest-of-Europe Quantum Dot Photonic Night Vision Sensor Array Market, $Million, 2024-2035
- Figure 20: China Quantum Dot Photonic Night Vision Sensor Array Market, $Million, 2024-2035
- Figure 21: Japan Quantum Dot Photonic Night Vision Sensor Array Market, $Million, 2024-2035
- Figure 22: South Korea Quantum Dot Photonic Night Vision Sensor Array Market, $Million, 2024-2035
- Figure 23: India Quantum Dot Photonic Night Vision Sensor Array Market, $Million, 2024-2035
- Figure 24: Rest-of-Asia-Pacific Quantum Dot Photonic Night Vision Sensor Array Market, $Million, 2024-2035
- Figure 25: South America Quantum Dot Photonic Night Vision Sensor Array Market, $Million, 2024-2035
- Figure 26: Middle East and Africa Quantum Dot Photonic Night Vision Sensor Array Market, $Million, 2024-2035
- Figure 27: Strategic Initiatives (by Company), 2021-2025
- Figure 28: Share of Strategic Initiatives, 2021-2025
- Figure 29: Data Triangulation
- Figure 30: Top-Down and Bottom-Up Approach
- Figure 31: Assumptions and Limitations
List of Tables
- Table 1: Market Snapshot
- Table 2: Opportunities across Region
- Table 3: Trends Overview
- Table 4: Quantum Dot Photonic Night Vision Sensor Array Market Pricing Forecast, 2024-2035
- Table 5: Application Summary (by Application)
- Table 6: Product Summary (by Product)
- Table 7: Quantum Dot Photonic Night Vision Sensor Array Market (by Region), $Million, 2024-2035
- Table 8: North America Quantum Dot Photonic Night Vision Sensor Array Market (by Application), $Million, 2024-2035
- Table 9: North America Quantum Dot Photonic Night Vision Sensor Array Market (by Product), $Million, 2024-2035
- Table 10: U.S. Quantum Dot Photonic Night Vision Sensor Array Market (by Application), $Million, 2024-2035
- Table 11: U.S. Quantum Dot Photonic Night Vision Sensor Array Market (by Product), $Million, 2024-2035
- Table 12: Canada Quantum Dot Photonic Night Vision Sensor Array Market (by Application), $Million, 2024-2035
- Table 13: Canada Quantum Dot Photonic Night Vision Sensor Array Market (by Product), $Million, 2024-2035
- Table 14: Mexico Quantum Dot Photonic Night Vision Sensor Array Market (by Application), $Million, 2024-2035
- Table 15: Mexico Quantum Dot Photonic Night Vision Sensor Array Market (by Product), $Million, 2024-2035
- Table 16: Europe Quantum Dot Photonic Night Vision Sensor Array Market (by Application), $Million, 2024-2035
- Table 17: Europe Quantum Dot Photonic Night Vision Sensor Array Market (by Product), $Million, 2024-2035
- Table 18: Germany Quantum Dot Photonic Night Vision Sensor Array Market (by Application), $Million, 2024-2035
- Table 19: Germany Quantum Dot Photonic Night Vision Sensor Array Market (by Product), $Million, 2024-2035
- Table 20: France Quantum Dot Photonic Night Vision Sensor Array Market (by Application), $Million, 2024-2035
- Table 21: France Quantum Dot Photonic Night Vision Sensor Array Market (by Product), $Million, 2024-2035
- Table 22: U.K. Quantum Dot Photonic Night Vision Sensor Array Market (by Application), $Million, 2024-2035
- Table 23: U.K. Quantum Dot Photonic Night Vision Sensor Array Market (by Product), $Million, 2024-2035
- Table 24: Italy Quantum Dot Photonic Night Vision Sensor Array Market (by Application), $Million, 2024-2035
- Table 25: Italy Quantum Dot Photonic Night Vision Sensor Array Market (by Product), $Million, 2024-2035
- Table 26: Spain Quantum Dot Photonic Night Vision Sensor Array Market (by Application), $Million, 2024-2035
- Table 27: Spain Quantum Dot Photonic Night Vision Sensor Array Market (by Product), $Million, 2024-2035
- Table 28: Rest-of-Europe Quantum Dot Photonic Night Vision Sensor Array Market (by Application), $Million, 2024-2035
- Table 29: Rest-of-Europe Quantum Dot Photonic Night Vision Sensor Array Market (by Product), $Million, 2024-2035
- Table 30: Asia-Pacific Quantum Dot Photonic Night Vision Sensor Array Market (by Application), $Million, 2024-2035
- Table 31: Asia-Pacific Quantum Dot Photonic Night Vision Sensor Array Market (by Product), $Million, 2024-2035
- Table 32: China Quantum Dot Photonic Night Vision Sensor Array Market (by Application), $Million, 2024-2035
- Table 33: China Quantum Dot Photonic Night Vision Sensor Array Market (by Product), $Million, 2024-2035
- Table 34: Japan Quantum Dot Photonic Night Vision Sensor Array Market (by Application), $Million, 2024-2035
- Table 35: Japan Quantum Dot Photonic Night Vision Sensor Array Market (by Product), $Million, 2024-2035
- Table 36: South Korea Quantum Dot Photonic Night Vision Sensor Array Market (by Application), $Million, 2024-2035
- Table 37: South Korea Quantum Dot Photonic Night Vision Sensor Array Market (by Product), $Million, 2024-2035
- Table 38: India Quantum Dot Photonic Night Vision Sensor Array Market (by Application), $Million, 2024-2035
- Table 39: India Quantum Dot Photonic Night Vision Sensor Array Market (by Product), $Million, 2024-2035
- Table 40: Rest-of-Asia-Pacific Quantum Dot Photonic Night Vision Sensor Array Market (by Application), $Million, 2024-2035
- Table 41: Rest-of-Asia-Pacific Quantum Dot Photonic Night Vision Sensor Array Market (by Product), $Million, 2024-2035
- Table 42: Rest-of-the-World Quantum Dot Photonic Night Vision Sensor Array Market (by Application), $Million, 2024-2035
- Table 43: Rest-of-the-World Quantum Dot Photonic Night Vision Sensor Array Market (by Product), $Million, 2024-2035
- Table 44: South America Quantum Dot Photonic Night Vision Sensor Array Market (by Application), $Million, 2024-2035
- Table 45: South America Quantum Dot Photonic Night Vision Sensor Array Market (by Product), $Million, 2024-2035
- Table 46: Middle East and Africa Quantum Dot Photonic Night Vision Sensor Array Market (by Application), $Million, 2024-2035
- Table 47: Middle East and Africa Quantum Dot Photonic Night Vision Sensor Array Market (by Product), $Million, 2024-2035
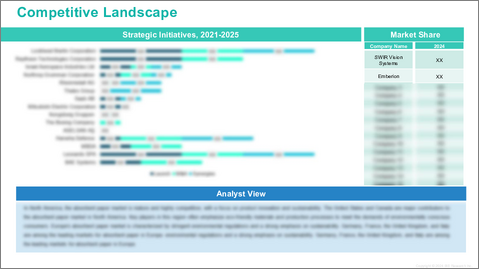
- Table 48: Market Share
Global Quantum Dot Photonic Night Vision Sensor Array Market: Industry Overview
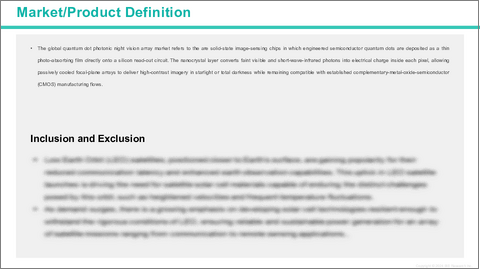
Quantum Dot Photonic Night Vision Sensor Arrays (QD-PNVSA) are solid-state image-sensing chips in which engineered semiconductor quantum dots are deposited as a thin photo-absorbing film directly onto a silicon read-out circuit. The nanocrystal layer converts faint visible and short-wave-infrared photons into electrical charge inside each pixel, allowing passively cooled focal-plane arrays to deliver high-contrast imagery in starlight or total darkness while remaining compatible with established complementary-metal-oxide-semiconductor (CMOS) manufacturing flows.
Quantum dot photonic night vision sensor array market growing with defence and security agencies seeking lighter, cheaper alternatives to indium gallium arsenide or mercury-cadmium-telluride detectors for helmet-mounted viewers, soldier sights and small unmanned platforms. Industrial automation and autonomous-mobility developers are also turning to broadband sensors that can see through smoke, haze and plastic enclosures, while hyperspectral analytics firms value quantum-dot films for their tunable band-edge and multispectral response. Because the absorbers are solution-processed at low temperature, suppliers can leverage high-volume wafer fabs and drive costs toward consumer-electronics thresholds-a powerful commercial pull.
| KEY MARKET STATISTICS | |
|---|---|
| Forecast Period | 2025 - 2035 |
| 2025 Evaluation | $141.2 Million |
| 2035 Forecast | $720.0 Million |
| CAGR | 17.69% |
The technology still faces non-trivial hurdles. Colloidal films have lower carrier mobility and photo-conversion efficiency than epitaxial III-V arrays, translating into sensitivity gaps that must be closed through ligand engineering and doping control. Lead- and mercury-based compositions raise environmental and export-compliance questions, pushing companies toward less-toxic chemistries. Long-term stability, wafer-level uniformity and screen-door artefacts created by pixel-to-pixel variation remain key reliability pain points, while entrenched suppliers of established infrared materials guard deep patent estates and trusted-foundry positions.
On the opportunity side of the quantum dot photonic night vision sensor array market, monolithic deposition unlocks wafer-level scaling, smaller pixel pitches and seamless integration with logic, paving the way for combined visible-infrared cameras in smartphones, mixed-reality headsets and advanced driver-assistance systems. Emerging heavy-metal-free quantum-dot formulations and hybrid nano-optoelectronic stacks broaden addressable wavelength windows and smooth the path into consumer markets. Government digital-night-vision modernisation programmes and climate-resilience initiatives (for example, wildfire smoke monitoring) further enlarge downstream demand.
Market Lifecycle Stage
The global quantum dot photonic night vision sensor array market is currently in the development and early adoption stage of its lifecycle. Driven by advancements in night vision array systems, increasing demand for efficient cost-effective solutions along with development of quantum photonics, this market is expanding rapidly. Innovations in ultra-sensitive NIR responsivity and move toward non-toxic, CMOS-integrable materials expected to drive the quantum dot photonic night vision sensor array market demand.
Global Quantum Dot Photonic Night Vision Sensor Array Market Segmentation:
Segmentation 1: by Application
- Defense and Security Imaging
- Industrial Inspection and Machine Vision
- Automotive/ Mobility
- Surveillance and Smart City CCTV
- Others
Defense and security imaging is one of the prominent application segments in the global quantum dot photonic night vision sensor array market.
Segmentation 2: by Product Type
- Monolithic CQD on CMOS SWIR Arrays
- Quantum Film visible/NIR Mobile Sensors
- HgTe CQD extended SWIR/ eSWIR Arrays
- Others
Segmentation 3: by Region
- North America - U.S., Canada, and Mexico
- Europe - Germany, France, U.K., Italy, Spain, and Rest-of-Europe
- Asia-Pacific - China, Japan, South Korea, India, and Rest-of-Asia-Pacific
- Rest-of-the-World - South America and Middle East and Africa
In the global quantum dot photonic night vision sensor array market, North America is anticipated to gain traction in terms of production, owing to the continuous growth and the presence of key manufacturers in the region.
Key Market Players and Competition Synopsis
The global quantum dot photonic night vision sensor array market is at initial phase of adoption with presence key players including SWIR Vision Systems, Emberion, Quantum Solutions, Qurv Technologies, IMEC, among others. These companies are early developers through advanced manufacturing techniques, extensive research and development, and strategic partnerships with end-user applications. Emerging players are focusing on sustainable and cost-effective solutions to meet the growing demand for high-performance night vision array systems in wide range of application including defense, automotive, industrial, among others. The market is characterized by intense competition driven by technological advancements, regulatory compliance, and increasing surveillance in smart cities, leading to rapid innovation and collaboration across the value chain.
Some of the prominent established names in the quantum dot photonic night vision sensor array market are:
- SWIR Vision Systems
- Emberion
- Quantum Solutions
- Qurv Technologies
- IMEC
- STMicroelectronics
- Nanoco Technologies
- onsemi
- Ray Imaging Solutions
- New Imaging Technologies (NIT)
- Sony Semiconductor Solutions
- CSEM
- Graphenea
- Tetramer Technologies
- Samsung Semiconductor
Companies that are not a part of the previously mentioned pool have been well represented across different sections of the quantum dot photonic night vision sensor array market report (wherever applicable).
Table of Contents
Executive Summary
Scope and Definition
1. Market: Industry Outlook
- 1.1 Trends: Current and Future Impact Assessment
- 1.1.1 Trends: Overview
- 1.1.2 Move Toward Non-Toxic, CMOS-Integrable Materials
- 1.1.3 Shift Toward SWIR and Broadband Capability
- 1.2 Supply Chain Overview
- 1.2.1 Value Chain Analysis
- 1.2.2 Market Map
- 1.3 Research and Development Review
- 1.3.1 Patent Filing Trend by Country and by Company
- 1.4 Regulatory Landscape
- 1.5 Market Dynamics Overview
- 1.5.1 Market Drivers
- 1.5.2 Market Restraints
- 1.5.3 Market Opportunities
2. Application
- 2.1 Application Segmentation
- 2.2 Application Summary
- 2.3 Quantum Dot Photonic Night Vision Sensor Array Market (by Application)
- 2.3.1 Defense and Security Imaging
- 2.3.2 Industrial Inspection and Machine Vision
- 2.3.3 Automotive/ Mobility
- 2.3.4 Surveillance and Smart City CCTV
- 2.3.5 Others
3. Product
- 3.1 Product Segmentation
- 3.2 Product Summary
- 3.3 Quantum Dot Photonic Night Vision Sensor Array Market (by Product Type)
- 3.3.1 Monolithic CQD on CMOS SWIR Arrays
- 3.3.2 Quantum Film visible/NIR Mobile Sensors
- 3.3.3 HgTe CQD extended SWIR/ eSWIR Arrays
- 3.3.4 Others
4. Region
- 4.1 Regional Summary
- 4.2 Drivers and Restraints
- 4.3 North America
- 4.3.1 Regional Overview
- 4.3.2 Driving Factors for Market Growth
- 4.3.3 Factors Challenging the Market
- 4.3.4 Application
- 4.3.5 Product
- 4.3.6 North America Quantum Dot Photonic Night Vision Sensor Array Market (by Country)
- 4.3.6.1 U.S.
- 4.3.6.1.1 Market by Application
- 4.3.6.1.2 Market by Product
- 4.3.6.2 Canada
- 4.3.6.2.1 Market by Application
- 4.3.6.2.2 Market by Product
- 4.3.6.3 Mexico
- 4.3.6.3.1 Market by Application
- 4.3.6.3.2 Market by Product
- 4.3.6.1 U.S.
- 4.4 Europe
- 4.4.1 Regional Overview
- 4.4.2 Driving Factors for Market Growth
- 4.4.3 Factors Challenging the Market
- 4.4.4 Application
- 4.4.5 Product
- 4.4.6 Europe Quantum Dot Photonic Night Vision Sensor Array Market (by Country)
- 4.4.6.1 Germany
- 4.4.6.1.1 Market by Application
- 4.4.6.1.2 Market by Product
- 4.4.6.2 France
- 4.4.6.2.1 Market by Application
- 4.4.6.2.2 Market by Product
- 4.4.6.3 U.K.
- 4.4.6.3.1 Market by Application
- 4.4.6.3.2 Market by Product
- 4.4.6.4 Italy
- 4.4.6.4.1 Market by Application
- 4.4.6.4.2 Market by Product
- 4.4.6.5 Spain
- 4.4.6.5.1 Market by Application
- 4.4.6.5.2 Market by Product
- 4.4.6.6 Rest-of-Europe
- 4.4.6.6.1 Market by Application
- 4.4.6.6.2 Market by Product
- 4.4.6.1 Germany
- 4.5 Asia-Pacific
- 4.5.1 Regional Overview
- 4.5.2 Driving Factors for Market Growth
- 4.5.3 Factors Challenging the Market
- 4.5.4 Application
- 4.5.5 Product
- 4.5.6 Asia-Pacific Quantum Dot Photonic Night Vision Sensor Array Market (by Country)
- 4.5.6.1 China
- 4.5.6.1.1 Market by Application
- 4.5.6.1.2 Market by Product
- 4.5.6.2 Japan
- 4.5.6.2.1 Market by Application
- 4.5.6.2.2 Market by Product
- 4.5.6.3 South Korea
- 4.5.6.3.1 Market by Application
- 4.5.6.3.2 Market by Product
- 4.5.6.4 India
- 4.5.6.4.1 Market by Application
- 4.5.6.4.2 Market by Product
- 4.5.6.5 Rest-of-Asia-Pacific
- 4.5.6.5.1 Market by Application
- 4.5.6.5.2 Market by Product
- 4.5.6.1 China
- 4.6 Rest-of-the-World
- 4.6.1 Regional Overview
- 4.6.2 Driving Factors for Market Growth
- 4.6.3 Factors Challenging the Market
- 4.6.4 Application
- 4.6.5 Product
- 4.6.6 Rest-of-the-World Quantum Dot Photonic Night Vision Sensor Array Market (by Region)
- 4.6.6.1 South America
- 4.6.6.1.1 Market by Application
- 4.6.6.1.2 Market by Product
- 4.6.6.2 Middle East and Africa
- 4.6.6.2.1 Market by Application
- 4.6.6.2.2 Market by Product
- 4.6.6.1 South America
5. Markets - Competitive Landscape & Company Profiles
- 5.1 Next Frontiers
- 5.2 Geographic Assessment
- 5.3 Company Profiles
- 5.3.1 SWIR Vision Systems
- 5.3.1.1 Overview
- 5.3.1.2 Top Products / Product Portfolio
- 5.3.1.3 Top Competitors
- 5.3.1.4 Target Customers/End-Users
- 5.3.1.5 Key Personnel
- 5.3.1.6 Analyst View
- 5.3.1.7 Market Share
- 5.3.2 Emberion
- 5.3.2.1 Overview
- 5.3.2.2 Top Products / Product Portfolio
- 5.3.2.3 Top Competitors
- 5.3.2.4 Target Customers/End-Users
- 5.3.2.5 Key Personnel
- 5.3.2.6 Analyst View
- 5.3.2.7 Market Share
- 5.3.3 Quantum Solutions
- 5.3.3.1 Overview
- 5.3.3.2 Top Products / Product Portfolio
- 5.3.3.3 Top Competitors
- 5.3.3.4 Target Customers/End-Users
- 5.3.3.5 Key Personnel
- 5.3.3.6 Analyst View
- 5.3.3.7 Market Share
- 5.3.4 Qurv Technologies
- 5.3.4.1 Overview
- 5.3.4.2 Top Products / Product Portfolio
- 5.3.4.3 Top Competitors
- 5.3.4.4 Target Customers/End-Users
- 5.3.4.5 Key Personnel
- 5.3.4.6 Analyst View
- 5.3.4.7 Market Share
- 5.3.5 IMEC
- 5.3.5.1 Overview
- 5.3.5.2 Top Products / Product Portfolio
- 5.3.5.3 Top Competitors
- 5.3.5.4 Target Customers/End-Users
- 5.3.5.5 Key Personnel
- 5.3.5.6 Analyst View
- 5.3.5.7 Market Share
- 5.3.6 STMicroelectronics
- 5.3.6.1 Overview
- 5.3.6.2 Top Products / Product Portfolio
- 5.3.6.3 Top Competitors
- 5.3.6.4 Target Customers/End-Users
- 5.3.6.5 Key Personnel
- 5.3.6.6 Analyst View
- 5.3.6.7 Market Share
- 5.3.7 Nanoco Technologies
- 5.3.7.1 Overview
- 5.3.7.2 Top Products / Product Portfolio
- 5.3.7.3 Top Competitors
- 5.3.7.4 Target Customers/End-Users
- 5.3.7.5 Key Personnel
- 5.3.7.6 Analyst View
- 5.3.7.7 Market Share
- 5.3.8 Onsemi
- 5.3.8.1 Overview
- 5.3.8.2 Top Products / Product Portfolio
- 5.3.8.3 Top Competitors
- 5.3.8.4 Target Customers/End-Users
- 5.3.8.5 Key Personnel
- 5.3.8.6 Analyst View
- 5.3.8.7 Market Share
- 5.3.9 Ray Imaging Solutions
- 5.3.9.1 Overview
- 5.3.9.2 Top Products / Product Portfolio
- 5.3.9.3 Top Competitors
- 5.3.9.4 Target Customers/End-Users
- 5.3.9.5 Key Personnel
- 5.3.9.6 Analyst View
- 5.3.9.7 Market Share
- 5.3.10 New Imaging Technologies (NIT)
- 5.3.10.1 Overview
- 5.3.10.2 Top Products / Product Portfolio
- 5.3.10.3 Top Competitors
- 5.3.10.4 Target Customers/End-Users
- 5.3.10.5 Key Personnel
- 5.3.10.6 Analyst View
- 5.3.10.7 Market Share
- 5.3.11 Sony Semiconductor Solutions
- 5.3.11.1 Overview
- 5.3.11.2 Top Products / Product Portfolio
- 5.3.11.3 Top Competitors
- 5.3.11.4 Target Customers/End-Users
- 5.3.11.5 Key Personnel
- 5.3.11.6 Analyst View
- 5.3.11.7 Market Share
- 5.3.12 CSEM
- 5.3.12.1 Overview
- 5.3.12.2 Top Products / Product Portfolio
- 5.3.12.3 Top Competitors
- 5.3.12.4 Target Customers/End-Users
- 5.3.12.5 Key Personnel
- 5.3.12.6 Analyst View
- 5.3.12.7 Market Share
- 5.3.13 Graphenea
- 5.3.13.1 Overview
- 5.3.13.2 Top Products / Product Portfolio
- 5.3.13.3 Top Competitors
- 5.3.13.4 Target Customers/End-Users
- 5.3.13.5 Key Personnel
- 5.3.13.6 Analyst View
- 5.3.13.7 Market Share
- 5.3.14 Tetramer Technologies
- 5.3.14.1 Overview
- 5.3.14.2 Top Products / Product Portfolio
- 5.3.14.3 Top Competitors
- 5.3.14.4 Target Customers/End-Users
- 5.3.14.5 Key Personnel
- 5.3.14.6 Analyst View
- 5.3.14.7 Market Share
- 5.3.15 Samsung Semiconductor
- 5.3.15.1 Overview
- 5.3.15.2 Top Products / Product Portfolio
- 5.3.15.3 Top Competitors
- 5.3.15.4 Target Customers/End-Users
- 5.3.15.5 Key Personnel
- 5.3.15.6 Analyst View
- 5.3.15.7 Market Share
- 5.3.1 SWIR Vision Systems
- 5.4 List of Other Key Players
