|
|
市場調査レポート
商品コード
1778597
水処理用活性炭市場- 世界および地域別分析:最終用途産業別、用途別、活性炭タイプ別、地域別 - 分析と予測(2025年~2035年)Activated Carbon Market for Water Treatment - A Global and Regional Analysis: Focus on Application, Product, and Regional Analysis - Analysis and Forecast, 2025-2035 |
||||||
|
|||||||
カスタマイズ可能
|
|||||||

| 水処理用活性炭市場- 世界および地域別分析:最終用途産業別、用途別、活性炭タイプ別、地域別 - 分析と予測(2025年~2035年) |
|
出版日: 2025年07月30日
発行: BIS Research
ページ情報: 英文 210 Pages
納期: 1~5営業日
|

全表示
- 概要
- 図表
- 目次
活性炭は、石炭、ヤシ殻、木材からバージン原料として、または使用済み炭素の再活性化によって製造されます。
業界のバリューチェーンは、原料の熱分解、活性化、ペレット化または粉砕、アプリケーションエンジニアリング、クローズドループ再生に及んでいます。バージン・カーボンと再活性化カーボンは相補的な役割を果たし、例えばバージン・グレードは高い初期吸着容量を提供する一方、再活性化により使用済み媒体を最大10倍まで回復させることで、廃棄物とコストを削減することができます。技術研究開発では、PFASや微量有機物用に調整された細孔径分布、蒸気効率の高い回転窯による再活性化、およびブレークスルー・サイクルを最適化するデジタル・センサーに重点を置いています。規制強化と持続可能性の目標により、バイオベースの原料や低エネルギー活性化ルートへの投資が加速しています。
| 主要市場統計 | |
|---|---|
| 予測期間 | 2025年~2035年 |
| 2025年の評価 | 32億8,490万米ドル |
| 2035年の予測 | 78億4,790万米ドル |
| CAGR | 9.1% |
水処理用活性炭市場のイントロダクション
石炭、ヤシ殻、木材、または再活性化した使用済み媒体から製造される活性炭は、市水や工業用水から溶存有機物、塩素副生成物、PFAS、医薬品、マイクロプラスチックを除去するための業界有数の吸着剤です。世界の需要は、政府が水質基準を強化し、公共事業が高度なろ過に投資するにつれて加速しています。BISリサーチは、インフラ支出の増加、再利用プロジェクト、持続可能性の義務付けが原動力となり、米国市場は2035年までにCAGR 9.1%で78億5,000万米ドルに上昇すると評価しています。
しかし、特に資本予算が限られていたり、熟練したオペレーターが不足していたりする環境では、こうしたソリューションの採用は依然として一定していません。
市場イントロダクション
活性炭は、溶存有機物、塩素副生成物、農薬、VOC、難分解性PFAS化合物を都市水や工業用水から除去できる高表面積吸着剤として機能します。粒状、粉末状、押し出し成形など、さまざまな形態に対応できるため、固定床フィルター、スラリー接触、またはハイブリッド生物活性化プロセスへの導入が可能で、低汚染物質濃度でも信頼性の高い研磨性能を発揮します。
産業への影響
ユーティリティ企業、産業界、規制当局が、飲料水や廃水から微量有機物、PFAS、医薬品、新興汚染物質を除去する費用対効果の高い高性能な方法を求めているため、水処理用活性炭市場は堅調な拡大を見せています。米国EPAの2024年PFAS最大汚染物質レベルやEU都市廃水指令のアップグレードなど、厳しい品質基準を満たさなければならないというプレッシャーが、新築と改修の両方で粒状および粉末活性炭(GACおよびPAC)システムの採用を後押ししています。炭素の活性化、細孔径の調整、触媒表面の改質の進歩により、吸着効率の向上、ベッド寿命の延長、運転コストの削減が進み、活性炭は膜や高度酸化と並ぶ魅力的なソリューションとなっています。
同時に、再活性化技術によって使用済みカーボンを10サイクルまで回復させ、バージン材料の使用量を最大70%削減し、ライフサイクルのCO2排出を低減します。カーボン・サプライヤーは、地域に再活性化ハブを建設し、バイオベースのココナッツ・シェル・グレードを導入し、カーボン・アズ・ア・サービスのレンタル・フリート提供することで、投資の勢いを強めています。世界の水インフラへの資金投入が加速し、弾力性のある循環型処理プロセスへのニーズが高まる中、活性炭市場は大きな成長を遂げ、公衆衛生を守り、水の再利用を可能にし、進化する環境規制への産業界のコンプライアンスをサポートするという重要な役割を担っています。
市場セグメンテーション
セグメンテーション1:最終用途産業別
- 自治体の水処理
- 食品・飲料
- 製薬・医療
- 鉱業・金属回収
- 化学産業
- 繊維産業
- その他
市場をリードする市水処理(最終用途産業別)
安全で清潔な飲料水に対する世界の需要の高まりを背景に、市水処理が市場の最終用途分野をリードしています。自治体では、塩素、重金属、有機汚染物質などの汚染物質を除去するために活性炭を採用するケースが増えており、これによって厳しい水質規制への準拠を確実にしています。多くの人口に高品質の水を供給する必要性から、自治体は信頼性が高く効率的なろ過技術に投資しています。
セグメンテーション2:用途別
- 液相吸着
- 気相吸着
液相吸着が市場をリード(用途別)
液相吸着は、有機化合物、塩素、溶存金属など、水中のさまざまな汚染物質を効果的に除去するため、水処理用活性炭市場の用途別セグメントをリードしてきました。この方法は非常に効率的で、さまざまな水処理プロセスに適応できるため、自治体と工業の両方の用途に適しています。安全な飲料水に対する需要の高まりと、厳しい水質基準を満たす必要性が、液相吸着の需要をさらに押し上げています。さらに、最小限のメンテナンスで高性能のろ過を提供できる活性炭の能力は、液相用途での優位性に寄与しています。この技術の費用対効果と実証済みの信頼性は、浄水分野での需要に拍車をかけています。
セグメンテーション3:活性炭タイプ別
- 粉末活性炭(PAC)
- 粒状活性炭(GAC)
- その他
粒状活性炭(GAC)が市場をリード(活性炭タイプ別)
粒状活性炭(GAC)は、その高い吸着能力と有機化合物、塩素、揮発性有機化学物質などの幅広い汚染物質を除去する能力により、水処理用活性炭市場の活性炭タイプセグメントをリードしてきました。GACの多孔質構造は、長期間にわたって効果的なろ過を可能にし、大規模な水処理システムに理想的です。自治体および工業用途の両方におけるその汎用性と、実証済みの信頼性および費用対効果により、GACは広く採用されています。さらに、GACは簡単に再生・再利用できるため、水処理プロセスに長期的な持続可能性をもたらし、市場の優位性をさらに高めています。
セグメンテーション4:地域別
- 北米
- 欧州
- アジア太平洋
- その他の地域
水処理用活性炭市場の最近の動向
- 2021年以降、この分野では顕著な統合と能力拡大が見られました。DESOTEC別Evoquaの米国再活性化資産の買収は、初の大西洋横断移動ろ過プラットフォームを構築し、KurarayはSprint Environmentalの再活性化事業を買収して東南アジアでの地位を強化し、Donau CarbonはKalpa Char(インド)を通じて上流の炭供給を確保しました。同時に、製品革新はPFAS選択的炭素と、ベッド寿命を延ばし運転コストを削減するデジタル監視ソリューションに焦点を当てています。
製品/イノベーション戦略:本調査では、炭素タイプ別(GAC、PAC、その他)、用途別(液相吸着、気相吸着)、最終用途産業別(都市水処理、食品・飲料、製薬・医療、鉱業・金属回収、化学産業、繊維産業、その他)の需要を分析しています。PFASの取り込みを促進する細孔工学の進歩を概説し、再生可能原料の動向を明らかにすることで、研究開発チームに新グレードを高成長市場セグメントに適合させるための洞察を提供します。
成長/マーケティング戦略:地域別では、アジア太平洋の大幅な数量増加、北米のPFASによる改修、欧州のサーキュラーエコノミーのインセンティブを明らかにしています。市場シェア表は、主要な既存企業と、彼らが残しているサービスのギャップを明らかにし、新興サプライヤーや技術パートナーの市場参入計画の指針となります。
競合戦略:Kuraray/Calgon、Jacobi、Haycarb、Norit、Donau、DESOTEC map capacitiesのプロファイルは、能力、再活性化の足跡、最近の買収をマッピングしているため、企業戦略家はM&Aや提携のターゲットをベンチマークすることができます。価格予測と特許出願分析は、交渉のベースラインとIPポジショニングに役立ちます。
当レポートでは、世界の水処理用活性炭市場について調査し、市場の概要とともに、最終用途産業別、用途別、活性炭タイプ別、地域別の動向、および市場に参入する企業のプロファイルなどを提供しています。
目次
エグゼクティブサマリー
第1章 市場:業界展望
- 動向:現状と将来への影響評価
- 活性炭の持続可能性と循環利用
- ろ過に関する国民の意識と普及の向上
- サプライチェーンの概要
- バリューチェーン分析
- 市場マップ
- 価格予測
- 研究開発レビュー
- 特許出願動向(特許数別、国別、企業別)
- 規制状況
- ステークホルダー分析
- 使用事例
- エンドユーザーと購入基準
- 主要な世界的出来事の影響分析
- 市場力学
- 市場の促進要因
- 市場の課題
- 市場の機会
第2章 用途
- 用途のサマリー
- 活性炭市場(エンドユーザー別)
- 市水処理
- 食品・飲料
- 医薬品・医療
- 鉱業・金属回収
- 化学産業
- 繊維産業
- その他
- 活性炭市場(用途別)
- 液相吸着
- 気相吸着
第3章 製品
- 製品のサマリー
- 水処理用活性炭市場(活性炭種類別)
- 粉末活性炭(PAC)
- 粒状活性炭(GAC)
- その他
第4章 地域
- 地域のサマリー
- 北米
- 地域概要
- 市場成長促進要因
- 市場成長抑制要因
- 用途
- 製品
- 北米(国別)
- 欧州
- 地域概要
- 市場成長促進要因
- 市場成長抑制要因
- 用途
- 製品
- 欧州(国別)
- アジア太平洋
- 地域概要
- 市場成長促進要因
- 市場成長抑制要因
- 用途
- 製品
- アジア太平洋(国別)
- その他の地域
- 地域概要
- 市場成長促進要因
- 市場成長抑制要因
- 用途
- 製品
- その他の地域
第5章 市場-競合ベンチマーキングと企業プロファイル
- KURARAY CO., LTD
- Jacobi Carbons AB (Osaka Gas Chemicals Co., Ltd.)
- Haycarb PLC
- Ingevity
- Arq, Inc
- Silcarbon Aktivkohle GmbH
- Norit
- CarboTech AC GmbH
- Donau Carbon GmbH
- Xylem Inc
- Kureha Corporation
- Desotec NV
- Carbon Activated Corporation
- Boyce Carbon
- Puragen Activated Carbons
- その他の主要企業
第6章 調査手法
List of Figures
- Figure 1: Activated Carbon Market for Water Treatment (by Scenario), $Million, 2025, 2030, and 2035
- Figure 2: Global Activated Carbon Market for Water Treatment, 2024 and 2035
- Figure 3: Top Countries, Global Activated Carbon Market for Water Treatment, $Million and Kilo Ton, 2024
- Figure 4: Global Market Snapshot, 2024
- Figure 5: Global Activated Carbon Market for Water Treatment, $Million, 2024 and 2035
- Figure 6: Activated Carbon Market for Water Treatment (by End-Use Industry), $Million, 2024, 2030, and 2035
- Figure 7: Activated Carbon Market for Water Treatment (by Application), $Million, 2024, 2030, and 2035
- Figure 8: Activated Carbon Market for Water Treatment (by Solution), $Million, 2024, 2030, and 2035
- Figure 9: Activated Carbon Market for Water Treatment Segmentation
- Figure 10: Pricing Forecast, $Million/Kilo Ton, 2024-2035
- Figure 11: Patent Analysis (by Country and Company), January 2021- December 2024
- Figure 12: Use Case 1: Heavy Metals and Organic Removal in Industrial Wastewater (Germany, 2021)
- Figure 13: Use Case 2: Reusing Rinse Water by Removing Surfactants in Automotive Manufacturing (Germany, 2022)
- Figure 14: Use Case 3: Cutting COD Peaks in Biofuel Plant Wastewater (Spain, 2021)
- Figure 15: Use Case 4: Mobile PFAS Removal for Drinking Water Supply (France, 2023)
- Figure 16: Stakeholder Analysis
- Figure 17: Global Activated Carbon Market for Water Treatment (by End-Use Industry), $Million, 2024, 2029, and 2035
- Figure 18: Global Activated Carbon Market for Water Treatment (by End-Use Industry), Kilo Tons, 2024, 2029, and 2035
- Figure 19: Global Activated Carbon Market for Water Treatment, Municipal Water Treatment, Country Wise, $Million, 2024
- Figure 20: Global Activated Carbon Market for Water Treatment, Municipal Water Treatment, Country Wise, Kilo Tons, 2024
- Figure 21: Global Activated Carbon Market for Water Treatment, Municipal Water Treatment, Value, $Million, 2024-2035
- Figure 22: Global Activated Carbon Market for Water Treatment, Municipal Water Treatment, Volume, Kilo Tons, 2024-2035
- Figure 23: Global Activated Carbon Market for Water Treatment, Food and Beverages, Value, Country Wise, $Million, 2024
- Figure 24: Global Activated Carbon Market for Water Treatment, Food and Beverages, Volume, Country Wise, Kilo Tons, 2024
- Figure 25: Global Activated Carbon Market for Water Treatment, Food and Beverages, Value, $Million, 2024-2035
- Figure 26: Global Activated Carbon Market for Water Treatment, Food and Beverages, Volume, Kilo Tons, 2024-2035
- Figure 27: Global Activated Carbon Market for Water Treatment, Pharmaceutical and Medical, Value, Country Wise, $Million, 2024
- Figure 28: Global Activated Carbon Market for Water Treatment, Pharmaceutical and Medical, Volume, Country Wise, Kilo Tons, 2024
- Figure 29: Global Carbon Market for Water Treatment, Pharmaceutical and Medical, Value, $Million, 2024-2035
- Figure 30: Global Activated Carbon Market for Water Treatment, Pharmaceutical and Medical, Volume, Kilo Tons, 2024-2035
- Figure 31: Global Activated Carbon Market for Water Treatment, Mining and Metal Recovery, Value, Country Wise, $Million, 2024
- Figure 32: Global Activated Carbon Market for Water Treatment, Mining and Metal Recovery, Volume, Country Wise, Kilo Tons, 2024
- Figure 33: Global Activated Carbon Market for Water Treatment, Mining and Metal Recovery, Value, $Million, 2024-2035
- Figure 34: Global Activated Carbon Market for Water Treatment, Mining and Metal Recovery, Volume, Kilo Tons, 2024-2035
- Figure 35: Global Activated Carbon Market for Water Treatment, Chemical Industry, Value, Country Wise, $Million, 2024
- Figure 36: Global Activated Carbon Market for Water Treatment, Chemical Industry, Volume, Country Wise, Kilo Tons, 2024
- Figure 37: Global Activated Carbon Market for Water Treatment, Chemical Industry, Value, $Million, 2024-2035
- Figure 38: Global Activated Carbon Market for Water Treatment, Chemical Industry, Volume, Kilo Tons, 2024-2035
- Figure 39: Global Activated Carbon Market for Water Treatment, Textile Industry, Value, Country Wise, $Million, 2024
- Figure 40: Global Activated Carbon Market for Water Treatment, Textile Industry, Volume, Country Wise, Kilo Tons, 2024
- Figure 41: Global Activated Carbon Market for Water Treatment, Textile Industry, Value, $Million, 2024-2035
- Figure 42: Global Carbon Market for Water Treatment, Textile Industry, Volume, Kilo Tons, 2024-2035
- Figure 43: Global Activated Carbon Market for Water Treatment, Others, Value, Country Wise, $Million, 2024
- Figure 44: Global Activated Carbon Market for Water Treatment, Others, Volume, Country Wise, Kilo Tons, 2024
- Figure 45: Global Activated Carbon Market for Water Treatment, Others, Value, $Million, 2024-2035
- Figure 46: Global Activated Carbon Market for Water Treatment, Others, Volume, Kilo Tons, 2024-2035
- Figure 47: Global Activated Carbon Market for Water Treatment, Liquid Phase Adsorption, Country Wise, $Million, 2024
- Figure 48: Global Activated Carbon Market for Water Treatment, Liquid Phase Adsorption, Country Wise, Kilo Tons, 2024
- Figure 49: Global Activated Carbon Market for Water Treatment, Liquid Phase Adsorption, Value, $Million, 2024-2035
- Figure 50: Global Activated Carbon Market for Water Treatment, Liquid Phase Adsorption, Volume, Kilo Tons, 2024-2035
- Figure 51: Global Activated Carbon Market for Water Treatment, Gas-Phase Adsorption, Value, Country Wise, $Million, 2024
- Figure 52: Global Activated Carbon Market for Water Treatment, Gas-Phase Adsorption, Volume, Country Wise, Kilo Tons, 2024
- Figure 53: Global Activated Carbon Market for Water Treatment, Gas-Phase Adsorption, Value, $Million, 2024-2035
- Figure 54: Global Activated Carbon Market for Water Treatment, Gas Phase Adsorption, Volume, Kilo Tons, 2024-2035
- Figure 55: Global Activated Carbon Market for Water Treatment Value (by Type), $Million, 2024, 2029, and 2035
- Figure 56: Global Activated Carbon Market for Water Treatment Volume (by Type), Kilo Tons, 2024, 2029, and 2035
- Figure 57: Global Activated Carbon Market for Water Treatment, Powdered Activated Carbon, Value, $Million, 2024
- Figure 58: Global Activated Carbon Market for Water Treatment, Powdered Activated Carbon, Volume, Kilo Tons, 2024
- Figure 59: Global Activated Carbon Market for Water Treatment, Powdered Activated Carbon, Value, $Million, 2024-2035
- Figure 60: Global Activated Carbon Market for Water Treatment, Powdered Activated Carbon, Volume, Kilo Tons, 2024-2035
- Figure 61: Global Activated Carbon Market for Water Treatment, Granular Activated Carbon, Value, $Million, 2024
- Figure 62: Global Activated Carbon Market for Water Treatment, Granular Activated Carbon, Volume, Kilo Tons, 2024
- Figure 63: Global Activated Carbon Market for Water Treatment, Granular Activated Carbon, Value, $Million, 2024-2035
- Figure 64: Global Activated Carbon Market for Water Treatment, Granular Activated Carbon, Volume, Kilo Tons, 2024-2035
- Figure 65: Global Activated Carbon Market for Water Treatment, Others, Value, $Million, 2024
- Figure 66: Global Activated Carbon Market for Water Treatment, Others, Volume, Kilo Tons, 2024
- Figure 67: Global Activated Carbon Market for Water Treatment, Others, Value, $Million, 2024-2035
- Figure 68: Global Activated Carbon Market for Water Treatment, Others Volume, Kilo Tons, 2024-2035
- Figure 69: U.S. Overhead Line Inspection Market, $Million, 2024-2035
- Figure 70: Canada Overhead Line Inspection Market, $Million, 2024-2035
- Figure 71: Mexico Overhead Line Inspection Market, $Million, 2024-2035
- Figure 72: Germany Activated Carbon Market for Water Treatment, $Million, 2024-2035
- Figure 73: France Activated Carbon Market for Water Treatment, $Million, 2024-2035
- Figure 74: U.K. Activated Carbon Market for Water Treatment, $Million, 2024-2035
- Figure 75: India Activated Carbon Market, $Million, 2024-2035
- Figure 76: Spain Activated Carbon Market, $Million, 2024-2035
- Figure 77: Poland Activated Carbon Market, $Million, 2024-2035
- Figure 78: Rest-of-Europe Activated Carbon Market for Water Treatment, $Million, 2024-2035
- Figure 79: China Activated Carbon Market for Water Treatment, $Million, 2024-2035
- Figure 80: Japan Activated Carbon Market for Water Treatment $Million, 2024-2035
- Figure 81: India Activated Carbon Market, $Million, 2024-2035
- Figure 82: South Korea Activated Carbon Market, $Million, 2024-2035
- Figure 83: Rest-of-Asia-Pacific Activated Carbon Market for Water Treatment, $Million, 2024-2035
- Figure 84: South America Activated Carbon Market for Water Treatment, $Million, 2024-2035
- Figure 85: Middle East and Africa Activated Carbon Market, $Million, 2024-2035
- Figure 86: Strategic Initiatives, January 2021-May 2025
- Figure 87: Data Triangulation
- Figure 88: Top-Down and Bottom-Up Approach
- Figure 89: Assumptions and Limitations
List of Tables
- Table 1: Market Snapshot
- Table 2: Competitive Landscape Snapshot
- Table 3: Trends: Current and Future Impact Assessment
- Table 4: Regulatory Landscape
- Table 5: Drivers, Challenges, and Opportunities, 2025-2035
- Table 6: Activated Carbon Market for Water Treatment (by Region), Kilo Ton, 2024-2035
- Table 7: Activated Carbon Market for Water Treatment (by Region), $Million, 2024-2035
- Table 8: North America Activated Carbon Market for Water Treatment (by End-Use Industry), Kilo Ton, 2024-2035
- Table 9: North America Activated Carbon Market for Water Treatment (by End-Use Industry), $Million, 2024-2035
- Table 10: North America Activated Carbon Market for Water Treatment (by Application), Kilo Ton, 2024-2035
- Table 11: North America Activated Carbon Market for Water Treatment (by Application), $Million, 2024-2035
- Table 12: North America Activated Carbon Market for Water Treatment (by Activated Carbon Type), Kilo Ton, 2024-2035
- Table 13: North America Activated Carbon Market for Water Treatment (by Activated Carbon Type), $Million, 2024-2035
- Table 14: U.S. Activated Carbon Market for Water Treatment (by End-Use Industry), Kilo Ton, 2024-2035
- Table 15: U.S. Activated Carbon Market for Water Treatment (by End-Use Industry), $Million, 2024-2035
- Table 16: U.S. Activated Carbon Market for Water Treatment (by Application), Kilo Ton, 2024-2035
- Table 17: U.S. Activated Carbon Market for Water Treatment (by Application), $Million, 2024-2035
- Table 18: U.S. Activated Carbon Market for Water Treatment (by Activated Carbon Type), Kilo Ton, 2024-2035
- Table 19: U.S. Activated Carbon Market for Water Treatment (by Activated Carbon Type), $Million, 2024-2035
- Table 20: Canada Activated Carbon Market for Water Treatment (by End-Use Industry), Kilo Ton, 2024-2035
- Table 21: Canada Activated Carbon Market for Water Treatment (by End-Use Industry), $Million, 2024-2035
- Table 22: Canada Activated Carbon Market for Water Treatment (by Application), Kilo Ton, 2024-2035
- Table 23: Canada Activated Carbon Market for Water Treatment (by Application), $Million, 2024-2035
- Table 24: Canada Activated Carbon Market for Water Treatment (by Activated Carbon Type), Kilo Ton, 2024-2035
- Table 25: Canada Activated Carbon Market for Water Treatment (by Activated Carbon Type), $Million, 2024-2035
- Table 26: Mexico Activated Carbon Market for Water Treatment (by End-Use Industry), Kilo Ton, 2024-2035
- Table 27: Mexico Activated Carbon Market for Water Treatment (by End-Use Industry), $Million, 2024-2035
- Table 28: Mexico Activated Carbon Market for Water Treatment (by Application), Kilo Ton, 2024-2035
- Table 29: Mexico Activated Carbon Market for Water Treatment (by Application), $Million, 2024-2035
- Table 30: Mexico Activated Carbon Market for Water Treatment (by Activated Carbon Type), Kilo Ton, 2024-2035
- Table 31: Mexico Activated Carbon Market for Water Treatment (by Activated Carbon Type), $Million, 2024-2035
- Table 32: Europe Activated Carbon Market for Water Treatment (by End-Use Industry), $Million, 2024-2035
- Table 33: Europe Activated Carbon Market for Water Treatment (by End-Use Industry), Kilo Ton, 2024-2035
- Table 34: Europe Activated Carbon Market for Water Treatment (by Application), $Million, 2024-2035
- Table 35: Europe Activated Carbon Market for Water Treatment (by Application), Kilo Ton, 2024-2035
- Table 36: Europe Activated Carbon Market for Water Treatment (by Activated Carbon Type), $Million, 2024-2035
- Table 37: Europe Activated Carbon Market for Water Treatment (by Activated Carbon Type), Kilo Ton, 2024-2035
- Table 38: Germany Activated Carbon Market for Water Treatment (by End-Use Industry), $Million, 2024-2035
- Table 39: Germany Activated Carbon Market for Water Treatment (by End-Use Industry), Kilo Ton, 2024-2035
- Table 40: Germany Activated Carbon Market for Water Treatment (by Application), $ Million, 2024-2035
- Table 41: Germany Activated Carbon Market for Water Treatment (by Application), Kilo Ton, 2024-2035
- Table 42: Germany Activated Carbon Market for Water Treatment (by Activated Carbon Type), $Million, 2024-2035
- Table 43: Germany Activated Carbon Market for Water Treatment (by Activated Carbon Type), Kilo Ton, 2024-2035
- Table 44: France Activated Carbon Market for Water Treatment (by End-Use Industry), $Million, 2024-2035
- Table 45: France Activated Carbon Market for Water Treatment (by End-Use Industry), Kilo Ton, 2024-2035
- Table 46: France Activated Carbon Market for Water Treatment (by Application), $ Million, 2024-2035
- Table 47: France Activated Carbon Market for Water Treatment (by Application), Kilo Ton, 2024-2035
- Table 48: France Activated Carbon Market for Water Treatment (by Activated Carbon Type), $Million, 2024-2035
- Table 49: France Activated Carbon Market for Water Treatment (by Activated Carbon Type), Kilo Ton, 2024-2035
- Table 50: U.K. Activated Carbon Market for Water Treatment (by End-User Industry), $Million, 2024-2035
- Table 51: U.K. Activated Carbon Market for Water Treatment (by End-User Industry), Kilo Ton,2024-2035
- Table 52: U.K. Activated Carbon Market for Water Treatment (by Application), $Million, 2024-2035
- Table 53: U.K. Activated Carbon Market for Water Treatment (by Application), Kilo Ton, 2024-2035
- Table 54: U.K. Activated Carbon Market for Water Treatment (by Activated Carbon Type), $Million, 2024-2035
- Table 55: U.K. Activated Carbon Market for Water Treatment (by Activated Carbon Type), Kilo Ton, 2024-2035
- Table 56: Italy Activated Carbon Market for Water Treatment (by End-Use Industry), $Million, 2024-2035
- Table 57: Italy Activated Carbon Market for Water Treatment (by End-Use Industry), Kilo Ton, 2024-2035
- Table 58: Italy Activated Carbon Market for Water Treatment (by Application), $Million, 2024-2035
- Table 59: Italy Activated Carbon Market for Water Treatment (by Application), Kilo Ton, 2024-2035
- Table 60: Italy Activated Carbon Market for Water Treatment (by Activated Carbon Type), $Million, 2024-2035
- Table 61: Italy Activated Carbon Market for Water Treatment (by Activated Carbon Type), Kilo Ton,2024-2035
- Table 62: Spain Activated Carbon Market for Water Treatment (by End-Use Industry), $Million, 2024-2035
- Table 63: Spain Activated Carbon Market for Water Treatment (by End-Use Industry), Kilo Ton, 2024-2035
- Table 64: Spain Activated Carbon Market for Water Treatment (by Application), $Million, 2024-2035
- Table 65: Spain Activated Carbon Market for Water Treatment (by Application), Kilo Ton, 2024-2035
- Table 66: Spain Activated Carbon Market for Water Treatment (by Activated Carbon Type), $Million, 2024-2035
- Table 67: Spain Activated Carbon Market for Water Treatment (by Activated Carbon Type), Kilo Ton, 2024-2035
- Table 68: Poland Activated Carbon Market for Water Treatment (by End-Use Industry), $Million, 2024-2035
- Table 69: Poland Activated Carbon Market for Water Treatment (by End-Use Industry), Kilo Ton, 2024-2035
- Table 70: Poland Activated Carbon Market for Water Treatment (by Application), $Million,2024-2035
- Table 71: Poland Activated Carbon Market for Water Treatment (by Application), Kilo Ton, 2024-2035
- Table 72: Poland Activated Carbon Market for Water Treatment (by Activated Carbon Type), $Million, 2024-2035
- Table 73: Poland Activated Carbon Market for Water Treatment (by Activated Carbon Type), Kilo Ton, 2024-2035
- Table 74: Rest-of-Europe Activated Carbon Market for Water Treatment (by End-Use Industry), $Million, 2024-2035
- Table 75: Rest-of-Europe Activated Carbon Market for Water Treatment (by End-Use Industry), Kilo Ton,2024-2035
- Table 76: Rest-of-Europe Activated Carbon Market for Water Treatment (by Application), $Million, 2024-2035
- Table 77: Rest-of-Europe Activated Carbon Market for Water Treatment (by Application), Kilo Ton, 2024-2035
- Table 78: Rest-of-Europe Activated Carbon Market for Water Treatment (by Activated Carbon Type), $Million, 2024-2035
- Table 79: Rest-of-Europe Activated Carbon Market for Water Treatment (by Activated Carbon Type), Kilo Ton, 2024-2035
- Table 80: Asia-Pacific Activated Carbon Market for Water Treatment (by End-Use Industry), $Million, 2024-2035
- Table 81: Asia-Pacific Activated Carbon Market for Water Treatment (by End-Use Industry), Kilo Ton, 2024-2035
- Table 82: Asia-Pacific Activated Carbon Market for Water Treatment (by Application), $Million, 2024-2035
- Table 83: Asia-Pacific Activated Carbon Market for Water Treatment (by Application), Kilo Ton, 2024-2035
- Table 84: Asia-Pacific Activated Carbon Market for Water Treatment (by Activated Carbon Type), $Million, 2024-2035
- Table 85: Asia-Pacific Activated Carbon Market for Water Treatment (by Activated Carbon Type), Kilo Ton, 2024-2035
- Table 86: China Activated Carbon Market for Water Treatment (by End-Use Industry), $Million, 2024-2035
- Table 87: China Activated Carbon Market for Water Treatment (by End-Use Industry), Kilo Ton, 2024-2035
- Table 88: China Activated Carbon Market for Water Treatment (by Application), $Million,2024-2035
- Table 89: China Activated Carbon Market for Water Treatment (by Application), Kilo Ton, 2024-2035
- Table 90: China Activated Carbon Market for Water Treatment (by Activated Carbon Type), $Million, 2024-2035
- Table 91: China Activated Carbon Market for Water Treatment (by Activated Carbon Type), Kilo Ton, 2024-2035
- Table 92: Japan Activated Carbon Market for Water Treatment (by End-Use Industry), $Million, 2024-2035
- Table 93: Japan Activated Carbon Market for Water Treatment (by End-Use Industry), Kilo Ton, 2024-2035
- Table 94: Japan Activated Carbon Market for Water Treatment (by Application), $ Million, 2024-2035
- Table 95: Japan Activated Carbon Market for Water Treatment (by Application), Kilo Ton, 2024-2035
- Table 96: Japan Activated Carbon Market for Water Treatment (by Activated Carbon Type), $Million, 2024-2035
- Table 97: Japan Activated Carbon Market for Water Treatment (by Activated Carbon Type), Kilo Ton, 2024-2035
- Table 98: India Activated Carbon Market for Water Treatment (by End-Use Industry), $Million, 2024-2035
- Table 99: India Activated Carbon Market for Water Treatment (by End-Use Industry), Kilo Ton, 2024-2035
- Table 100: India Activated Carbon Market for Water Treatment (by Application), $Million, 2024-2035
- Table 101: India Activated Carbon Market for Water Treatment (by Application), Kilo Ton, 2024-2035
- Table 102: India Activated Carbon Market for Water Treatment (by Activated Carbon Type), $Million, 2024-2035
- Table 103: India Activated Carbon Market for Water Treatment (by Activated Carbon Type), Kilo Ton,2024-2035
- Table 104: South Korea Activated Carbon Market for Water Treatment (by End-Use Industry), $Million, 2024-2035
- Table 105: South Korea Activated Carbon Market for Water Treatment (by End-Use Industry), Kilo Ton, 2024-2035
- Table 106: South Korea Activated Carbon Market for Water Treatment (by Application), $Million, 2024-2035
- Table 107: South Korea Activated Carbon Market for Water Treatment (by Application), Kilo Ton, 2024-2035
- Table 108: South Korea Activated Carbon Market for Water Treatment (by Activated Carbon Type), $Million, 2024-2035
- Table 109: South Korea Activated Carbon Market for Water Treatment (by Activated Carbon Type), Kilo Ton, 2024-2035
- Table 110: Rest-of-Asia-Pacific Activated Carbon Market for Water Treatment (by End-Use Industry), $Million, 2024-2035
- Table 111: Rest-of-Asia-Pacific Activated Carbon Market for Water Treatment (by End-Use Industry), Kilo Ton,2024-2035
- Table 112: Rest-of-Asia-Pacific Activated Carbon Market for Water Treatment (by Application), $Million, 2024-2035
- Table 113: Rest-of-Asia-Pacific Activated Carbon Market for Water Treatment (by Application), Kilo Ton, 2024-2035
- Table 114: Rest-of-Asia-Pacific Activated Carbon Market for Water Treatment (by Activated Carbon Type), $Million, 2024-2035
- Table 115: Rest-of-Asia-Pacific Activated Carbon Market for Water Treatment (by Activated Carbon Type), Kilo Ton, 2024-2035
- Table 116: Rest-of-the-World Activated Carbon Market for Water Treatment (by End-Use Industry), $Million, 2024-2035
- Table 117: Rest-of-the-World Activated Carbon Market for Water Treatment (by End-Use Industry), Kilo Ton, 2024-2035
- Table 118: Rest-of-the-World Activated Carbon Market for Water Treatment (by Application), $Million, 2024-2035
- Table 119: Rest-of-the-World Activated Carbon Market for Water Treatment (by Application), Kilo Ton, 2024-2035
- Table 120: Rest-of-the-World Activated Carbon Market for Water Treatment (by Activated Carbon Type), $Million, 2024-2035
- Table 121: Rest-of-the-World Activated Carbon Market for Water Treatment (by Activated Carbon Type), Kilo Ton, 2024-2035
- Table 122: South America Activated Carbon Market for Water Treatment (by End-Use Industry), $Million, 2024-2035
- Table 123: South America Activated Carbon Market for Water Treatment (by End-Use Industry), Kilo Ton, 2024-2035
- Table 124: South America Activated Carbon Market for Water Treatment (by Application), $Million, 2024-2035
- Table 125: South America Activated Carbon Market for Water Treatment (by Application), Kilo Ton,2024-2035
- Table 126: South America Activated Carbon Market for Water Treatment (by Activated Carbon Type), $Million, 2024-2035
- Table 127: South America Activated Carbon Market for Water Treatment (by Activated Carbon Type), Kilo Ton, 2024-2035
- Table 128: Middle East and Africa Activated Carbon Market for Water Treatment (by End-Use Industry), $Million, 2024-2035
- Table 129: Middle East and Africa Activated Carbon Market for Water Treatment (by End-Use Industry), Kilo Ton, 2024-2035
- Table 130: Middle East and Africa Activated Carbon Market for Water Treatment (by Application), $Million, 2024-2035
- Table 131: Middle East and Africa Activated Carbon Market for Water Treatment (by Application), Kilo Ton,2024-2035
- Table 132: Middle East and Africa Activated Carbon Market for Water Treatment (by Activated Carbon Type), $Million, 2024-2035
- Table 133: Middle East and Africa Activated Carbon Market for Water Treatment (by Activated Carbon Type), Kilo Ton, 2024-2035
- Table 134: Global Market Share, 2024
This report can be delivered within 1 working day.
Activated Carbon Market for Water Treatment Overview
Activated carbon is produced either as virgin material from coal, coconut shell, or wood, or via reactivation of spent carbon. The industry value chain spans raw-material pyrolysis, activation, pelletising or milling, application engineering, and closed-loop regeneration. Virgin and reactivated carbons serve complementary roles, such as virgin grades deliver high initial adsorption capacity, while reactivation reduces waste and cost by restoring exhausted media up to ten times. Technological R&D focuses on tailored pore-size distributions for PFAS and micro-organics, steam-efficient rotary-kiln reactivation, and digital sensors that optimise breakthrough cycles. Regulatory tightening and sustainability goals are accelerating investment in bio-based feedstocks and low-energy activation routes.
| KEY MARKET STATISTICS | |
|---|---|
| Forecast Period | 2025 - 2035 |
| 2025 Evaluation | $3,284.9 Million |
| 2035 Forecast | $7,847.9 Million |
| CAGR | 9.1% |
Introduction of Activated Carbon for Water Treatment Market
Activated carbon produced from coal, coconut shell, wood, or reactivated spent media is one of the industry's prominent adsorbents for removing dissolved organics, chlorine by-products, PFAS, pharmaceuticals, and micro-plastics from municipal and industrial water. Global demand is accelerating as governments tighten quality standards and utilities invest in advanced filtration. BIS Research values the market at US rising to US$7.85 billion by 2035 at a 9.1 % CAGR, driven by escalating infrastructure spend, reuse projects, and sustainability mandates.
However, adoption of these solutions remains inconsistent, particularly in environments where capital budgets are limited or there is a scarcity of skilled operators.
Market Introduction
Activated carbon functions as a high surface area adsorbent capable of removing dissolved organics, chlorine by-products, pesticides, VOCs, and persistent PFAS compounds from municipal and industrial water. Its versatility across granular, powdered, and extruded forms allows deployment in fixed-bed filters, slurry contacts, or hybrid biological-activated processes, delivering reliable polishing performance even at low contaminant concentrations.
Industrial Impact
The activated-carbon market for water treatment is experiencing robust expansion as utilities, industries, and regulators seek cost-effective, high-performance methods to remove trace organics, PFAS, pharmaceuticals, and emerging contaminants from drinking water and wastewater. Pressure to meet strict quality standards, such as the U.S. EPA's 2024 PFAS maximum-contaminant levels and the EU Urban Waste-Water Directive upgrades, drives adoption of granular and powdered activated-carbon (GAC and PAC) systems for both new builds and retrofits. Advances in carbon activation, pore-size tailoring, and catalytic surface modification are boosting adsorption efficiency, extending bed life, and reducing operational costs, making activated carbon an attractive solution alongside membranes and advanced oxidation.
At the same time, utilities and industrial users are prioritizing sustainability as reactivation technologies restore spent carbon up to ten cycles, cutting virgin-material use by up to 70 % and lowering life-cycle CO? emissions. Investment momentum is reinforced by carbon suppliers by building regional reactivation hubs, introducing bio-based coconut-shell grades, and offering carbon-as-a-service rental fleets. With global water-infrastructure funding accelerating and the need for resilient, circular treatment processes rising, the activated-carbon market is positioned for significant growth, playing a critical role in safeguarding public health, enabling water reuse, and supporting industrial compliance with evolving environmental regulations.
Market Segmentation:
Segmentation 1 : by End-Use Industry
- Municipal Water Treatment
- Food and Beverages
- Pharmaceutical and Medical
- Mining and Metal Recovery
- Chemical Industry
- Textile Industry
- Others
Municipal Water Treatment to Lead the Market (by End-Use Industry)
Municipal water treatment has been leading the end-use segment of the market, driven by the growing global demand for safe and clean drinking water. Municipalities are increasingly adopting activated carbon to remove contaminants such as chlorine, heavy metals, and organic pollutants, thereby ensuring compliance with stringent water quality regulations. The need to provide high-quality water to large populations has driven municipalities to invest in reliable and efficient filtration technologies.
Segmentation 2: by Application
- Liquid-Phase Adsorption
- Gas-Phase Adsorption
Liquid-Phase Adsorption to Lead the Market (by Application)
Liquid-phase adsorption has been leading the application segment of the activated carbon market for water treatment as it effectively removes a wide range of contaminants from water, including organic compounds, chlorine, and dissolved metals. This method is highly efficient and adaptable for various water treatment processes, making it suitable for both municipal and industrial applications. The increasing demand for safe drinking water and the need to meet stringent water quality standards have further boosted the demand for liquid-phase adsorption. Additionally, activated carbon's ability to provide high-performance filtration with minimal maintenance contributes to its dominance in liquid-phase applications. The cost-effectiveness and proven reliability of this technique spur its demand in water purification.
Segmentation 3: by Activated Carbon Type
- Powdered Activated Carbon (PAC)
- Granular Activated Carbon (GAC)
- Others
Granular Activated Carbon (GAC) to Lead the Market (by Activated Carbon Type)
Granular activated carbon (GAC) has been leading the activated carbon type segment of the activated carbon market for water treatment due to its high adsorption capacity and ability to remove a broad spectrum of contaminants, such as organic compounds, chlorine, and volatile organic chemicals. GAC's porous structure allows for effective filtration over extended periods, making it ideal for large-scale water treatment systems. Its versatility in both municipal and industrial applications, along with its proven reliability and cost-effectiveness, drives its widespread adoption. Moreover, GAC can be easily regenerated and reused, providing long-term sustainability in water treatment processes, which further enhances its market dominance.
Segmentation 4: by Region
- North America
- Europe
- Asia-Pacific
- Rest-of-the-World
Recent Developments in the Activated Carbon Market for Water Treatment
- Since 2021, the sector has seen notable consolidation and capacity expansion. DESOTEC's acquisition of Evoqua's U.S. reactivation assets created the first trans-Atlantic mobile-filtration platform, Kuraray strengthened its Southeast-Asian position by purchasing Sprint Environmental's reactivation business, and Donau Carbon secured upstream charcoal supply via Kalpa Char (India). Concurrently, product innovation focuses on PFAS-selective carbons and digital monitoring solutions that extend bed life and reduce operating costs.
How can this report add value to an organization?
Product/Innovation Strategy: The study dissects demand by carbon type (GAC, PAC, others), by application (liquid-phase adsorption, gas-phase adsorption), and end-use industry (municipal water treatment, food and beverages, pharmaceutical and medical, mining and metal recovery, chemical industry, textile industry, and others). It outlines advances in pore-engineering that enhance PFAS uptake and highlights trends in renewable feedstocks, providing R&D teams with insights to align new grades with high-growth market segments.
Growth/Marketing Strategy: Regional breakouts reveal Asia-Pacific's outsized volume growth, North America's PFAS-driven retrofits, and Europe's circular-economy incentives. Market-share tables identify key incumbents and the service gaps they leave, guiding go-to-market plans for emerging suppliers or technology partners.
Competitive Strategy: Profiles of Kuraray/Calgon, Jacobi, Haycarb, Norit, Donau, and DESOTEC map capacities, reactivation footprints, and recent acquisitions so corporate strategists can benchmark M&A or partnership targets. Pricing-forecast and patent-filing analyses inform negotiation baselines and IP positioning.
Research Methodology
Data Sources
Primary Data Sources
The primary sources involve industry experts from the global activated carbon market for water treatment and various stakeholders in the ecosystem. Respondents such as CEOs, vice presidents, marketing directors, and technology and innovation directors have been interviewed to obtain and verify both qualitative and quantitative aspects of this research study.
The key data points taken from primary sources include:
- validation and triangulation of all the numbers and graphs
- validation of report segmentation and key qualitative findings
- understanding the competitive landscape
- validation of the numbers of various markets for the market type
- percentage split of individual markets for geographical analysis
Secondary Data Sources
This research study utilizes extensive secondary research, including directories, company websites, and annual reports. It also makes use of databases, such as Hoovers, Bloomberg, Businessweek, and Factiva, to collect useful and effective information for an extensive, technical, market-oriented, and commercial study of the global market. In addition to the data sources, the study was done with the help of other data sources and websites, such as the World Economic Forum, OICA, ACEA, and IEA.
Secondary research was done to obtain crucial information about the industry's value chain, revenue models, the market's monetary chain, the total pool of key players, and the current and potential use cases and applications.
The key data points taken from secondary research include:
- segmentations and percentage shares
- data for market value
- key industry trends of the top players in the market
- qualitative insights into various aspects of the market, key trends, and emerging areas of innovation
- quantitative data for mathematical and statistical calculations
Data Triangulation
This research study involves the usage of extensive secondary sources, such as certified publications, articles from recognized authors, white papers, annual reports of companies, directories, and major databases, to collect useful and effective information for an extensive, technical, market-oriented, and commercial study of the global market.
The process of market engineering involves the calculation of the market statistics, market size estimation, market forecast, market crackdown, and data triangulation (the methodology for such quantitative data processes is explained in further sections). The primary research study has been undertaken to gather information and validate the market numbers for segmentation types and industry trends of the key players in the market.
Key Market Players and Competition Synopsis
The global activated carbon market for water treatment is increasingly shaped by vertically integrated suppliers that combine virgin carbon production with reactivation services and mobile filtration fleets. Leading companies -including Calgon Carbon, Jacobi Carbons (Osaka Gas Chemical), Haycarb PLC, Norit, Donau Carbon, DESOTEC, and CarboTech-collectively command a substantial share of global sales, while numerous regional specialists and contract reactivators serve localized needs. Competitive advantage now hinges on pairing low-carbon feedstocks (e.g., coconut-shell or biomass-based carbon) with closed-loop reactivation and on-site service models that reduce lifecycle costs and greenhouse-gas emissions for municipal and industrial end users factors that increasingly influence procurement decisions.
Some prominent names established in this market are:
- Kuraray/Calgon Carbon
- Jacobi Carbons
- Haycarb PLC
- Norit Activated Carbon
- Donau Carbon GmbH
- Desotec NV
- CarboTech AC GmbH
- Carbon Activated Corporation
- Boyce Carbon
- Silcarbon Aktivkohle
- Puragen Activated Carbons
Table of Contents
Executive Summary
Scope and Definition
1 Market: Industry Outlook
- 1.1 Trends: Current and Future Impact Assessment
- 1.1.1 Sustainability and Circular Use of Activated Carbon
- 1.1.2 Increasing Public Awareness and Adoption of Filtration
- 1.2 Supply Chain Overview
- 1.2.1 Value Chain Analysis
- 1.2.1.1 Virgin Activated Carbon
- 1.2.1.2 Reactivated Carbon
- 1.2.2 Market Map
- 1.2.3 Pricing Forecast
- 1.2.1 Value Chain Analysis
- 1.3 Research and Development Review
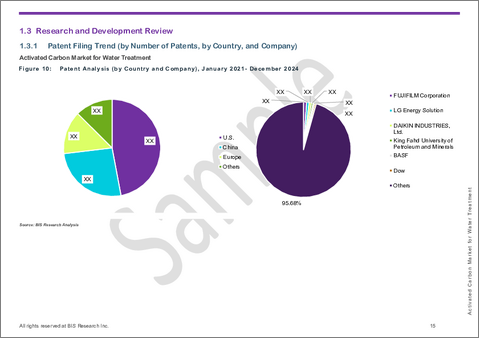
- 1.3.1 Patent Filing Trend (by Number of Patents, by Country, and Company)
- 1.4 Regulatory Landscape
- 1.5 Stakeholder Analysis
- 1.5.1 Use Case
- 1.5.2 End User and Buying Criteria
- 1.6 Impact Analysis for Key Global Events
- 1.7 Market Dynamics
- 1.7.1 Market Drivers
- 1.7.1.1 Stricter Water Quality Regulations
- 1.7.1.2 Growing Water Pollution and Demand for Clean Water
- 1.7.2 Market Challenges
- 1.7.2.1 Raw Material Supply Constraints and Cost Volatility
- 1.7.2.2 Spent Carbon Disposal and Environmental Concerns
- 1.7.3 Market Opportunities
- 1.7.3.1 Emerging Contaminant Remediation
- 1.7.3.2 Investment in Water Infrastructure and Reuse Projects
- 1.7.1 Market Drivers
2 Application
- 2.1 Application Summary
- 2.2 Activated Carbon Market (by End User)
- 2.2.1 Municipal Water Treatment
- 2.2.2 Food and Beverages
- 2.2.3 Pharmaceutical and Medical
- 2.2.4 Mining and Metal Recovery
- 2.2.5 Chemical Industry
- 2.2.6 Textile Industry
- 2.2.7 Others
- 2.3 Activated Carbon Market (by Application)
- 2.3.1 Liquid Phase Adsorption
- 2.3.2 Gas-Phase Adsorption
3 Products
- 3.1 Product Summary
- 3.2 Activated Carbon Market for Water Treatment (by Activated Carbon Type)
- 3.2.1 Powdered Activated Carbon (PAC)
- 3.2.2 Granular Activated Carbon (GAC)
- 3.2.3 Others
4 Region
- 4.1 Regional Summary
- 4.2 North America
- 4.2.1 Regional Overview
- 4.2.2 Driving Factors for Market Growth
- 4.2.3 Factors Challenging the Market
- 4.2.4 Application
- 4.2.5 Product
- 4.2.6 North America (by Country)
- 4.2.6.1 U.S.
- 4.2.6.1.1 Application
- 4.2.6.1.2 Product
- 4.2.6.2 Canada
- 4.2.6.2.1 Application
- 4.2.6.2.2 Product
- 4.2.6.3 Mexico
- 4.2.6.3.1 Application
- 4.2.6.3.2 Product
- 4.2.6.1 U.S.
- 4.3 Europe
- 4.3.1 Regional Overview
- 4.3.2 Driving Factors for Market Growth
- 4.3.3 Factors Challenging the Market
- 4.3.4 Application
- 4.3.5 Product
- 4.3.6 Europe (by Country)
- 4.3.6.1 Germany
- 4.3.6.1.1 Application
- 4.3.6.1.2 Product
- 4.3.6.2 France
- 4.3.6.2.1 Application
- 4.3.6.2.2 Product
- 4.3.6.3 U.K.
- 4.3.6.3.1 Application
- 4.3.6.3.2 Product
- 4.3.6.4 Italy
- 4.3.6.4.1 Application
- 4.3.6.4.2 Product
- 4.3.6.5 Spain
- 4.3.6.5.1 Application
- 4.3.6.5.2 Product
- 4.3.6.6 Poland
- 4.3.6.6.1 Application
- 4.3.6.6.2 Product
- 4.3.6.7 Rest-of-Europe
- 4.3.6.7.1 Application
- 4.3.6.7.2 Product
- 4.3.6.1 Germany
- 4.4 Asia-Pacific
- 4.4.1 Regional Overview
- 4.4.2 Driving Factors for Market Growth
- 4.4.3 Factors Challenging the Market
- 4.4.4 Application
- 4.4.5 Product
- 4.4.6 Asia-Pacific (by Country)
- 4.4.6.1 China
- 4.4.6.1.1 Application
- 4.4.6.1.2 Product
- 4.4.6.2 Japan
- 4.4.6.2.1 Application
- 4.4.6.2.2 Product
- 4.4.6.3 India
- 4.4.6.3.1 Application
- 4.4.6.3.2 Product
- 4.4.6.4 South Korea
- 4.4.6.4.1 Application
- 4.4.6.4.2 Product
- 4.4.6.5 Rest-of-Asia-Pacific
- 4.4.6.5.1 Application
- 4.4.6.5.2 Product
- 4.4.6.1 China
- 4.5 Rest-of-the-World
- 4.5.1 Regional Overview
- 4.5.2 Driving Factors for Market Growth
- 4.5.3 Factors Challenging the Market
- 4.5.4 Application
- 4.5.5 Product
- 4.5.6 Rest-of-the-World (by Region)
- 4.5.6.1 South America
- 4.5.6.1.1 Application
- 4.5.6.1.2 Product
- 4.5.6.2 Middle East and Africa
- 4.5.6.2.1 Application
- 4.5.6.2.2 Product
- 4.5.6.1 South America
5 Markets - Competitive Benchmarking & Company Profiles
- 5.1 KURARAY CO., LTD
- 5.1.1 Overview
- 5.1.2 Top Products/Product Portfolio
- 5.1.3 Top Competitors
- 5.1.4 Target Customers
- 5.1.5 Key Personal
- 5.1.6 Analyst View
- 5.1.7 Market Share, 2024
- 5.2 Jacobi Carbons AB (Osaka Gas Chemicals Co., Ltd.)
- 5.2.1 Overview
- 5.2.2 Top Products/Product Portfolio
- 5.2.3 Top Competitors
- 5.2.4 Target Customers
- 5.2.5 Key Personal
- 5.2.6 Analyst View
- 5.2.7 Market Share, 2024
- 5.3 Haycarb PLC
- 5.3.1 Overview
- 5.3.2 Company Financials
- 5.3.3 Top Products/Product Portfolio
- 5.3.4 Top Competitors
- 5.3.5 Target Customers
- 5.3.6 Key Personal
- 5.3.7 Analyst View
- 5.3.8 Market Share, 2024
- 5.4 Ingevity
- 5.4.1 Overview
- 5.4.2 Top Products/Product Portfolio
- 5.4.3 Top Competitors
- 5.4.4 Target Customers
- 5.4.5 Key Personal
- 5.4.6 Analyst View
- 5.4.7 Market Share, 2024
- 5.5 Arq, Inc
- 5.5.1 Overview
- 5.5.2 Top Products/Product Portfolio
- 5.5.3 Top Competitors
- 5.5.4 Target Customers
- 5.5.5 Key Personal
- 5.5.6 Analyst View
- 5.5.7 Market Share, 2024
- 5.6 Silcarbon Aktivkohle GmbH
- 5.6.1 Overview
- 5.6.2 Top Products/Product Portfolio
- 5.6.3 Top Competitors
- 5.6.4 Target Customers
- 5.6.5 Key Personal
- 5.6.6 Analyst View
- 5.6.7 Market Share, 2024
- 5.7 Norit
- 5.7.1 Overview
- 5.7.2 Top Products/Product Portfolio
- 5.7.3 Top Competitors
- 5.7.4 Target Customers
- 5.7.5 Key Personal
- 5.7.6 Analyst View
- 5.7.7 Market Share, 2024
- 5.8 CarboTech AC GmbH
- 5.8.1 Overview
- 5.8.2 Top Products/Product Portfolio
- 5.8.3 Top Competitors
- 5.8.4 Target Customers
- 5.8.5 Key Personal
- 5.8.6 Analyst View
- 5.8.7 Market Share, 2024
- 5.9 Donau Carbon GmbH
- 5.9.1 Overview
- 5.9.2 Top Products/Product Portfolio
- 5.9.3 Top Competitors
- 5.9.4 Target Customers
- 5.9.5 Key Personal
- 5.9.6 Analyst View
- 5.9.7 Market Share, 2024
- 5.1 Xylem Inc
- 5.10.1 Overview
- 5.10.2 Top Products/Product Portfolio
- 5.10.3 Top Competitors
- 5.10.4 Target Customers
- 5.10.5 Key Personal
- 5.10.6 Analyst View
- 5.10.7 Market Share, 2024
- 5.11 Kureha Corporation
- 5.11.1 Overview
- 5.11.2 Top Products/Product Portfolio
- 5.11.3 Top Competitors
- 5.11.4 Target Customers
- 5.11.5 Key Personal
- 5.11.6 Analyst View
- 5.11.7 Market Share, 2024
- 5.12 Desotec NV
- 5.12.1 Overview
- 5.12.2 Top Products/Product Portfolio
- 5.12.3 Top Competitors
- 5.12.4 Target Customers
- 5.12.5 Key Personal
- 5.12.6 Analyst View
- 5.12.7 Market Share, 2024
- 5.13 Carbon Activated Corporation
- 5.13.1 Overview
- 5.13.2 Top Products/Product Portfolio
- 5.13.3 Top Competitors
- 5.13.4 Target Customers
- 5.13.5 Key Personal
- 5.13.6 Analyst View
- 5.13.7 Market Share, 2024
- 5.14 Boyce Carbon
- 5.14.1 Overview
- 5.14.2 Top Products/Product Portfolio
- 5.14.3 Top Competitors
- 5.14.4 Target Customers
- 5.14.5 Key Personal
- 5.14.6 Analyst View
- 5.14.7 Market Share, 2024
- 5.15 Puragen Activated Carbons
- 5.15.1 Overview
- 5.15.2 Top Products/Product Portfolio
- 5.15.3 Top Competitors
- 5.15.4 Target Customers
- 5.15.5 Key Personal
- 5.15.6 Analyst View
- 5.15.7 Market Share, 2024
- 5.16 Other Key Companies
6 Research Methodology
- 6.1 Data Sources
- 6.1.1 Primary Data Sources
- 6.1.2 Secondary Data Sources
- 6.1.3 Data Triangulation
- 6.2 Market Estimation and Forecast

