|
|
市場調査レポート
商品コード
1774228
フローサイトメトリー市場 - 世界および地域別分析:オファリングタイプ別、方法別、用途別、エンドユーザー別、地域別 - 分析と予測(2025年~2035年)Flow Cytometry Market - A Global and Regional Analysis: Focus on Offering, Application, Methods, End User, and Regional Analysis - Analysis and Forecast, 2025-2035 |
||||||
|
|||||||
カスタマイズ可能
|
|||||||

| フローサイトメトリー市場 - 世界および地域別分析:オファリングタイプ別、方法別、用途別、エンドユーザー別、地域別 - 分析と予測(2025年~2035年) |
|
出版日: 2025年07月23日
発行: BIS Research
ページ情報: 英文 184 Pages
納期: 1~5営業日
|

全表示
- 概要
- 図表
- 目次
世界のフローサイトメトリーの市場規模は、2024年に33億9,250万米ドルとなり、堅調な成長軌道にあります。
同市場は、2035年には73億7,190万米ドルに達すると予測され、2025年から2035年にかけて7.40%のCAGRで拡大すると予測されています。フローサイトメトリーは、臨床診断、医薬品開発、研究開発において、複数のパラメータに基づいて細胞を分析・選別する能力を持ち、重要な役割を果たしています。
| 主要市場統計 | |
|---|---|
| 予測期間 | 2025年~2035年 |
| 2025年の評価 | 36億1,110万米ドル |
| 2035年の予測 | 73億7,190万米ドル |
| CAGR | 7.4% |
市場イントロダクション
フローサイトメトリーは、懸濁液中の個々の細胞のマルチパラメトリー分析を可能にする強力な分析技術であり、研究、臨床診断、バイオ医薬品開発で広く利用されています。その用途は免疫表現型解析、細胞周期解析、バイオマーカー検出など多岐にわたり、腫瘍学、免疫学、感染症研究などの需要を牽引しています。スペクトルフローサイトメトリーやハイスループットシステムの進歩に伴い、個別化医療や細胞治療における採用の増加、精密な細胞解析のための洗練された試薬やソフトウェアの使用の拡大に支えられ、市場は大きく成長する見込みです。
地域セグメンテーション
- 北米
- 米国
- カナダ
- 欧州
- 英国
- ドイツ
- フランス
- イタリア
- スペイン
- 欧州全域
- アジア太平洋
- 中国
- 日本
- インド
- 韓国
- オーストラリア
- タイ
- シンガポール
- その他
- ラテンアメリカ
- ブラジル
- メキシコ
- アルゼンチン
- その他
- 中東・アフリカ
フローサイトメトリー市場の地域別分析では、北米が市場シェアで首位、次いで欧州、アジア太平洋、ラテンアメリカ、中東・アフリカと、多様な状況が明らかになっています。北米は2024年の市場規模が14億9,710万米ドルで、高度なヘルスケアインフラ、最先端研究ツールの急速な導入、臨床診断における有利な償還政策、がん有病率の増加などの要因によって、予測期間を通じて優位性を維持すると予測されています。2024年の市場規模が9億2,830万米ドルである欧州は、強力な研究インフラ、確立されたバイオテクノロジー拠点(ドイツ、英国、フランス、オランダ)、血液学・免疫学における臨床的有用性の高まりに後押しされ、着実な成長が見込まれます。アジア太平洋地域は、2025年から2035年にかけてCAGR 9.04%で最も急成長する地域となる見込みであり、ライフサイエンス研究の著しい進歩、ヘルスケア投資の増加、精密診断に対する需要の高まりがその要因となっています。ラテンアメリカと中東・アフリカ地域も、ヘルスケアインフラの改善とライフサイエンス研究への投資の増加により、有望な成長機会を示すと期待されています。この地域分析は、フローサイトメトリー市場の世界の広がりと可能性を強調するものであり、各地域はその全体的な成長軌道に独自に寄与しています。
フローサイトメトリー市場の最近の動向
- 2025年5月、Cytek BiosciencesはCytek Aurora Evoを発売しました。Cytek Aurora Evoは、同社のフラッグシップであるAuroraシステムの機能をさらに強化した先進的なフルスペクトルフローサイトメーターです。
- 2025年5月、Becton, Dickinson and Companyは、高度なスペクトルとリアルタイムの細胞イメージング技術を組み合わせた世界初の細胞分析装置を発売しました。この技術革新により、研究者はフローサイトメトリーの簡便性とスループットを向上させ、より多くの用途でより深い細胞洞察を得ることができます。
- 2025年3月、Danaher社傘下のBeckman Coulter Life Sciencesは、スペクトルフローサイトメトリーを変革する業界初のモジュール式ソリューションであるCytoFLEX mosaic Spectral Detection Moduleを発表しました。
- 2025年2月、Becton, Dickinson and Companyは、戦略的焦点を絞り、株主価値を高めるため、バイオサイエンスおよび診断ソリューション事業を分離する計画を発表。分離後の"新BD"は、革新、成長、的を絞った投資に焦点を当てた純粋なメドテック企業となり、分離された部門は独立したライフサイエンスのリーダーとして運営されます。
- 2025年1月、Bio-Rad LaboratoriesはTrailBlazer TagとStarBright Dye Label Kitsを発売し、フローサイトメトリーや蛍光ウエスタンブロット用の抗体を簡単に標識する方法を提供します。
製品/イノベーション戦略:フローサイトメトリー市場分析により、研究および臨床ニーズの発展に関する洞察が得られるため、企業は、高パラメーター分析、スペクトル機能、臨床診断のための合理化されたワークフローなど、特定の要件に対応するフローサイトメトリー装置、試薬、ソフトウェアソリューションをカスタマイズして開発することができます。
成長/マーケティング戦略:このレポートは、学術研究、免疫腫瘍学、感染症診断などの主要セグメントや特定の地域機会に合わせたターゲットマーケティング戦略を実施し、顧客エンゲージメントを向上させ、普及を加速させる組織を支援します。
競合戦略:企業は、装置の拡張性、使いやすさ、試薬の互換性、アフターセールス・サポート、細胞治療やイムノフェノタイピングのような特殊用途など、対象地域のエンドユーザーから特に評価されている特徴を強調することで、フローサイトメトリー製品を差別化することができます。
世界のフローサイトメトリー市場は、Becton, Dickinson and Company、Danaher Corporation(Beckman Coulter, Inc.)、Thermo Fisher Scientific Inc.の3社が独占しており、それぞれが臨床診断や高度な生物医学研究の業界ベンチマークとなる装置、試薬、消耗品の包括的ポートフォリオを提供しています。Bio-Rad Laboratoriesは、高分解能フローサイトメトリーソリューションと革新的な試薬に特化し、免疫研究と腫瘍診断における主要企業としての地位を確固たるものにしています。Cytek Biosciences, Inc.は、Cytek Auroraのような費用対効果の高い高パラメータシステムで、特に高度なスペクトルアプリケーションで急速に市場シェアを獲得しており、手ごわい競合相手として台頭してきています。Agilent Technologies, Inc.やSony Biotechnology, Inc.などの地域の企業は、スペクトルフローサイトメトリーやカスタマイズされた細胞分析ツールなど、特殊なニッチ分野で技術革新を続けています。成長を持続させるためには、市場のリーダーは、精密医療と個別化診断の進化するニーズに対応するために、継続的な製品革新、試薬ポートフォリオの拡大、戦略的協力関係の構築に注力しなければなりません。
当レポートでは、世界のフローサイトメトリー市場について調査し、市場の概要とともに、オファリングタイプ別、方法別、用途別、エンドユーザー別、地域別の動向、および市場に参入する企業のプロファイルなどを提供しています。
目次
エグゼクティブサマリー
第1章 市場:業界展望
- 世界のフローサイトメトリー市場、市場規模(米ドル)、2024年~2035年
- 規制状況/コンプライアンス
- 米国
- 欧州
- 日本
- その他の地域
第2章 市場:業界見通し
- 市場力学
- 動向、促進要因、課題、機会:現状と将来の影響評価、2024年~2035年
- 動向
- フローサイトメトリーにおける継続的な技術革新
- フローサイトメトリー企業間のコラボレーション、戦略的パートナーシップ、アライアンスの増加
- 市場力学
- 市場促進要因
- 市場抑制要因
- 市場機会
第3章 オファリングタイプ
- オファリングタイプのサマリー
- 成長シェアマトリックス
- 機器
- 試薬と消耗品
- ソフトウェア
第4章 方法
- 方法のサマリー
- 成長シェアマトリックス
- 細胞ベースフローサイトメトリー
- ビーズベースフローサイトメトリー
第5章 用途
- 用途のサマリー
- 成長シェアマトリックス
- 臨床応用
- 調査申請
- 産業
第6章 エンドユーザー
- エンドユーザーのサマリー
- 成長シェアマトリックス
- 製薬およびバイオテクノロジー企業
- 病院および臨床検査室
- 学術研究機関
- その他
第7章 地域
- 地域のサマリー
- 成長シェアマトリックス
- 北米
- 欧州
- アジア太平洋
- ラテンアメリカ
- 中東・アフリカ
第8章 市場-競合ベンチマーキングと企業プロファイル
- 企業別製品ベンチマーク
- 競合情勢
- 企業プロファイル
- Agilent Technologies, Inc.
- Becton, Dickinson and Company
- Bio-Rad Laboratories, Inc.
- Cytek Biosciences, Inc.
- Danaher Corporation (Beckman Coulter)
- Sony Biotechnology Inc.
- Thermo Fisher Scientific Inc.
- Sysmex Corporation
- Merck KGaA
- Miltenyi Biotec
- Stratedigm, Inc.
- Cell Signaling Technology Inc.
- STEMCELL Technologies
- Bio-Techne
- Revvity (BioLegend, Inc)
第9章 調査手法
List of Figures
- Figure 1: Flow Cytometry Market (by Scenario), $Million, 2025 2030, and 2035
- Figure 2: Global Market Snapshot, 2024
- Figure 3: Global Flow Cytometry Market, $Million, 2024 and 2035
- Figure 4: Flow Cytometry Market (by Offering), $Million, 2024, 2030, and 2035
- Figure 5: Flow Cytometry Market (by Application), $Million, 2024, 2030, and 2035
- Figure 6: Flow Cytometry Market (by Technology), $Million, 2024, 2030, and 2035
- Figure 7: Flow Cytometry Market (by End User), $Million, 2024, 2030, and 2035
- Figure 8: Global Flow Cytometry Market Segmentation
- Figure 9: Global Flow Cytometry Market, Market Size ($Million), 2024-2035
- Figure 10: Incidence of Cancer (by Region), Million, 2022, 2025, 2030, 2040, and 2050
- Figure 11: Key Drivers for Flow Cytometry's Role in Regenerative Medicine:
- Figure 12: Healthcare R&D Spending, $Billion, 2020-2023
- Figure 13: Key Applications in Infectious Disease Diagnostics
- Figure 14: Global Flow Cytometry Market (by Offering Type), $Million, 2024, 2030, and 2035
- Figure 15: Growth-Share Analysis for Global Flow Cytometry Market (by Offering), 2024-2035
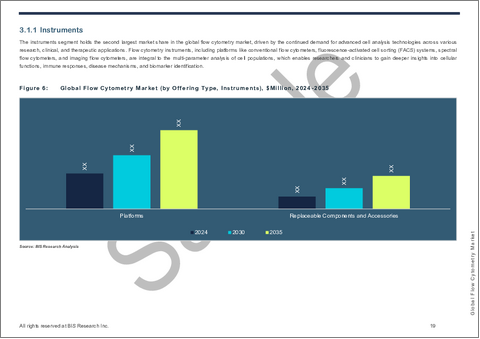
- Figure 16: Global Flow Cytometry Market (by Offering Type, Instruments), $Million, 2024-2035
- Figure 17: Global Flow Cytometry Market (by Offering Type, Platforms), $Million, 2024-2035
- Figure 18: Global Flow Cytometry Market (by Platform, Conventional Flow Cytometers), $Million, 2024-2035
- Figure 19: Global Sorting FACS Flow Cytometers Market, Value, $Million, 2024-2035
- Figure 20: Global Sorting FACS Flow Cytometers Market, Volume, Units, 2024-2035
- Figure 21: Global Non-Sorting FACS Flow Cytometers Market, Value, $Million, 2024-2035
- Figure 22: Global Non-Sorting FACS Flow Cytometers Market, Volume, Units, 2024-2035
- Figure 23: Global Sorting Imaging Flow Cytometers Market, Value, $Million, 2024-2035
- Figure 24: Global Sorting Imaging Flow Cytometers Market, Volume, Units, 2024-2035
- Figure 25: Global Non-Sorting Imaging Flow Cytometers Market, Value $Million, 2024-2035
- Figure 26: Global Non-Sorting Imaging Flow Cytometers Market, Volume Units, 2024-2035
- Figure 27: Global Sorting Spectral Flow Cytometers Market, Value $Million, 2024-2035
- Figure 28: Global Sorting Spectral Flow Cytometers Market, Volume Units, 2024-2035
- Figure 29: Global Non-Sorting Spectral Flow Cytometers Market, Value, $Million, 2024-2035
- Figure 30: Global Non-Sorting Spectral Flow Cytometers Market, Volume, Units, 2024-2035
- Figure 31: Global Flow Cytometry Market (by Platform, Others), $Million, 2024-2035
- Figure 32: Global Flow Cytometry Market (by Instruments, Replaceable Components and Accessories), $Million, 2024-2035
- Figure 33: Global Flow Cytometry Market (by Offering Type, Reagents and Consumables), $Million, 2024, 2030, and 2035
- Figure 34: Global Flow Cytometry Market (by Reagents and Consumables, Antibodies), $Million, 2024-2035
- Figure 35: Global Flow Cytometry Market (by Reagents and Consumables, Fluorescent Dye), $Million, 2024-2035
- Figure 36: Global Flow Cytometry Market (by Reagents and Consumables, Beads), $Million, 2024-2035
- Figure 37: Global Flow Cytometry Market (by Reagents and Consumables, Others), $Million, 2024-2035
- Figure 38: Global Flow Cytometry Market (by Offering Type, Software), $Million, 2024-2035
- Figure 39: Global Flow Cytometry Market (by Method), $Million, 2024, 2030, and 2035
- Figure 40: Growth-Share Analysis for Global Flow Cytometry Market (by Method), 2024-2035
- Figure 41: Global Flow Cytometry Market (by Method, Cell-Based Flow Cytometry), $Million, 2024-2035
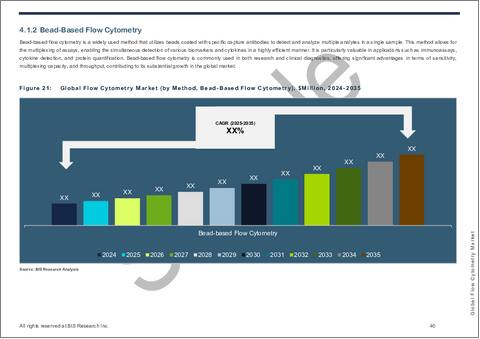
- Figure 42: Global Flow Cytometry Market (by Method, Bead-Based Flow Cytometry), $Million, 2024-2035
- Figure 43: Global Flow Cytometry Market (by Application), $Million, 2024, 2030, and 2035
- Figure 44: Growth-Share Analysis for Global Flow Cytometry Market (by Application), 2024-2035
- Figure 45: Global Flow Cytometry Market (by Application, Clinical Application), $Million, 2024-2035
- Figure 46: Global Flow Cytometry Market (by Clinical Application, Cancer (Solid Tumor)), $Million, 2024-2035
- Figure 47: Global Flow Cytometry Market (by Clinical Application, Hematology), $Million, 2024-2035
- Figure 48: Global Flow Cytometry Market (by Clinical Application, Autoimmune Diseases), $Million, 2024-2035
- Figure 49: Global Flow Cytometry Market (by Clinical Application, Organ Transplantation), $Million, 2024-2035
- Figure 50: Global Flow Cytometry Market (by Clinical Application, Others), $Million, 2024-2035
- Figure 51: Global Flow Cytometry Market (by Application, Research Application), $Million, 2024, 2030, and 2035
- Figure 52: Global Flow Cytometry Market (by Research Application, Drug Discovery), $Million, 2024-2035
- Figure 53: Global Flow Cytometry Market (by Research Application, Biomarker Detection), $Million, 2024-2035
- Figure 54: Global Flow Cytometry Market (by Research Application, In-Vitro Toxicology Testing), $Million, 2024-2035
- Figure 55: Global Flow Cytometry Market (by Research Application, Stem Cell Research), $Million, 2024-2035
- Figure 56: Global Flow Cytometry Market (by Research Application, Cell Cycle Analysis), $Million, 2024-2035
- Figure 57: Global Flow Cytometry Market (by Research Application, Cell Viability), $Million, 2024-2035
- Figure 58: Global Flow Cytometry Market (by Research Application, Cell Apoptosis), $Million, 2024-2035
- Figure 59: Global Flow Cytometry Market (by Research Application, Others), $Million, 2024-2035
- Figure 60: Global Flow Cytometry Market (by Application, Industrial), $Million, 2024, 2030, and 2035
- Figure 61: Global Flow Cytometry Market (by Industrial, Food and Beverages), $Million, 2024-2035
- Figure 62: Global Flow Cytometry Market (by Industrial, Water Treatment), $Million, 2024-2035
- Figure 63: Global Flow Cytometry Market (by Industrial, Microbiology Testing), $Million, 2024-2035
- Figure 64: Global Flow Cytometry Market (by Industrial, Cosmetics and Personal Care Industry), $Million, 2024-2035
- Figure 65: Global Flow Cytometry Market (by Industrial, Agriculture and Fermentation Industry), $Million, 2024-2035
- Figure 66: Global Flow Cytometry Market (by Industrial, Other Industries), $Million, 2024-2035
- Figure 67: Global Flow Cytometry Market (by End User), $Million, 2024, 2030, and 2035
- Figure 68: Growth-Share Analysis for Global Flow Cytometry Market (by End User), 2024-2035
- Figure 69: Global Flow Cytometry Market (by End User, Pharmaceutical and Biotechnology Companies), $Million, 2024-2035
- Figure 70: Global Flow Cytometry Market (by End User, Hospitals and Clinical Testing Laboratories), $Million, 2024-2035
- Figure 71: Global Flow Cytometry Market (by End User, Academic and Research Institutes), $Million, 2024-2035
- Figure 72: Global Flow Cytometry Market (by End User, Other Industries), $Million, 2024-2035
- Figure 73: Growth-Share Analysis for Global Flow Cytometry Market (by Region), 2024-2035
- Figure 74: North America Flow Cytometry Market, $Million, 2024-2035
- Figure 75: U.S. Flow Cytometry Market, $Million, 2024-2035
- Figure 76: Canada Flow Cytometry Market, $Million, 2024-2035
- Figure 77: Europe Flow Cytometry Market, $Million, 2024-2035
- Figure 78: U.K. Flow Cytometry Market, $Million, 2024-2035
- Figure 79: Germany Flow Cytometry Market, $Million, 2024-2035
- Figure 80: France Flow Cytometry Market, $Million, 2024-2035
- Figure 81: Italy. Flow Cytometry Market, $Million, 2024-2035
- Figure 82: Spain Flow Cytometry Market, $Million, 2024-2035
- Figure 83: Rest-of-Europe Flow Cytometry Market, $Million, 2024-2035
- Figure 84: Asia-Pacific Flow Cytometry Market, $Million, 2024-2035
- Figure 85: China Flow Cytometry Market, $Million, 2024-2035
- Figure 86: Japan Flow Cytometry Market, $Million, 2024-2035
- Figure 87: India Flow Cytometry Market, $Million, 2024-2035
- Figure 88: South Korea Flow Cytometry Market, $Million, 2024-2035
- Figure 89: Australia Flow Cytometry Market, $Million, 2024-2035
- Figure 90: Thailand Flow Cytometry Market, $Million, 2024-2035
- Figure 91: Singapore Flow Cytometry Market, $Million, 2024-2035
- Figure 92: Rest of Asia-Pacific Flow Cytometry Market, $Million, 2024-2035
- Figure 93: Latin America Flow Cytometry Market, $Million, 2024-2035
- Figure 94: Brazil Flow Cytometry Market, $Million, 2024-2035
- Figure 95: Mexico Flow Cytometry Market, $Million, 2024-2035
- Figure 96: Argentina Flow Cytometry Market, $Million, 2024-2035
- Figure 97: Rest-of-Latin America Flow Cytometry Market, $Million, 2024-2035
- Figure 98: Middle East and Africa Flow Cytometry Market, $Million, 2024-2035
- Figure 99: Global Flow Cytometry Market, Product Benchmarking (by Company)
- Figure 100: Share of Key Strategies and Developments in Global Flow Cytometry Market, January 2020-May 2025
- Figure 101: Key Strategies and Developments in Global Flow Cytometry Market by Company, January 2020-May 2025
- Figure 102: Global Flow Cytometry Market: Company Position Analysis (2024)
- Figure 103: Global Flow Cytometry Market: Company Share Analysis (2024)
- Figure 104: Data Triangulation
- Figure 105: Top-Down and Bottom-Up Approach
- Figure 106: Assumptions and Limitations
List of Tables
- Table 1: Market Snapshot
- Table 2: Recent Technological Innovations in Flow Cytometry
- Table 3: Recent Strategic Activities Among Flow Cytometry Players
- Table 4: Flow Cytometry Instruments and Reagents in Regenerative Medicine
- Table 5: Price Comparison of Flow Cytometers
- Table 6: Key Flow Cytometry Platforms
- Table 7: Global Fluorescence Activated Cell Sorting (FACS) Flow Cytometry Market, Value, $Million, 2024-2035
- Table 8: Global Fluorescence Activated Cell Sorting (FACS) Flow Cytometry Market, Volume, Units, 2024-2035
- Table 9: Key Sorting FACS Flow Cytometers in the Market
- Table 10: Key Non-Sorting FACS Flow Cytometers in the Market
- Table 11: Global Imaging Flow Cytometers Market, Value, $Million, 2024-2035
- Table 12: Global Imaging Flow Cytometers Market, Volume, Units, 2024-2035
- Table 13: Key Sorting Imaging Flow Cytometers in the Market
- Table 14: Key Non-Sorting Imaging Flow Cytometers in the Market
- Table 15: Global Spectral Flow Cytometers Market, Value, $Million, 2024-2035
- Table 16: Global Spectral Flow Cytometers Market, Volume, Units, 2024-2035
- Table 17: Key Sorting Spectral Flow Cytometers in the Market
- Table 18: Key Non-Sorting Spectral Flow Cytometers in the Market
- Table 19: Key Flow Cytometer Software
- Table 20: Industrial Application Products in Flow Cytometry
- Table 21: Global Flow Cytometry Market (by Region), $Million, 2024-2035
- Table 22: Major Grants Supporting Flow Cytometry Innovation and Access (North America and Global)
- Table 23: North America Flow Cytometry Market (by Country), $Million, 2024-2035
- Table 24: Europe Flow Cytometry Market (by Country), $Million, 2024-2035
- Table 25: Asia-Pacific Flow Cytometry Market (by Country), $Million, 2024-2035
- Table 26: Latin America Flow Cytometry Market (By Country), $Million, 2024-2035
This report can be delivered within 1 working day.
Introduction of Flow Cytometry Market
The global flow cytometry market, valued at $3,392.5 million in 2024, is on a robust growth trajectory and is anticipated to reach $7,371.9 million by 2035. This market is expected to expand at a compound annual growth rate (CAGR) of 7.40% between 2025 and 2035. Flow cytometry plays a crucial role in clinical diagnostics, drug development, and research applications, with its ability to analyze and sort cells based on multiple parameters.
| KEY MARKET STATISTICS | |
|---|---|
| Forecast Period | 2025 - 2035 |
| 2025 Evaluation | $3,611.1 Million |
| 2035 Forecast | $7,371.9 Million |
| CAGR | 7.4% |
Market Introduction
Flow cytometry is a powerful analytical technology enabling multiparametric analysis of individual cells in suspension, widely used in research, clinical diagnostics, and biopharmaceutical development. Its applications span immunophenotyping, cell cycle analysis, and biomarker detection, driving demand across oncology, immunology, and infectious disease research. With advancements in spectral flow cytometry and high-throughput systems, the market is poised for significant growth, supported by increasing adoption in personalized medicine and cell therapy, and the expanding use of sophisticated reagents and software for precise cell analysis.
Regional Segmentation:
- North America
- U.S.
- Canada
- Europe
- U.K.
- Germany
- France
- Italy
- Spain
- Rest-of-Erope
- Asia-Pacific
- China
- Japan
- India
- South Korea
- Australia
- Thailand
- Singapore
- Rest-of-Asia-Pacific
- Latin America
- Brazil
- Mexico
- Argentina
- Rest-of-Latin America
- Middle East & Africa
The regional analysis of the flow cytometry market reveals a diversified landscape, with North America leading in market share, followed by Europe, Asia-Pacific, Latin America, and the Middle East & Africa. North America, with a market value of $1,497.1 million in 2024, is anticipated to maintain its dominance throughout the forecast period, driven by factors such as advanced healthcare infrastructure, rapid adoption of cutting-edge research tools, favorable reimbursement policies in clinical diagnostics., and increasing prevalence of cancer. Europe, with a market value of $928.3 million in 2024, is expected to witness steady growth propelled by strong research infrastructure, established biotech hubs (Germany, the U.K., France, and the Netherlands), and the increasing clinical utility in hematology and immunology.. Asia-Pacific is expected to emerge as the fastest-growing region with a CAGR of 9.04% from 2025 to 2035, fueled by significant advancements in life sciences research, increasing healthcare investments, and a growing demand for precision diagnostics. Latin America and the Middle East & Africa regions are also expected to show promising growth opportunities, driven by improving healthcare infrastructure and a rising investments in life sciences research. This regional analysis underscores the global scope and potential of the flow cytometry market, with each region contributing uniquely to its overall growth trajectory.
Recent Developments in the Flow Cytometry Market
- In May 2025, Cytek Biosciences launched the Cytek Aurora Evo, an advanced full-spectrum flow cytometer that builds upon the capabilities of its flagship Aurora system.
- In May 2025, Becton, Dickinson and Company launched the world's first cell analyzer combining advanced spectral and real-time cell imaging technologies. This innovation enables researchers to gain deeper cellular insights across more applications, with enhanced ease and higher throughput in flow cytometry.
- In March 2025, Beckman Coulter Life Sciences, a Danaher company, introduced the CytoFLEX mosaic Spectral Detection Module-the industry's first modular solution transforming spectral flow cytometry.
- In February 2025, Becton, Dickinson and Company announced plans to spin off its Biosciences and Diagnostic Solutions business to sharpen strategic focus and enhance shareholder value. Post-separation, "New BD" will be a pure-play MedTech company focused on innovation, growth, and targeted investments, while the spun-off unit will operate as a standalone life sciences leader.
- In January 2025, Bio-Rad Laboratories launched its TrailBlazer Tag and StarBright Dye Label Kits, providing an easy way to label antibodies for flow cytometry and fluorescent western blot applications.
How can this report add value to an organization?
Product/Innovation Strategy: The flow cytometry market analysis provides insights into evolving research and clinical needs, enabling organizations to develop customized flow cytometry instruments, reagents, and software solutions that address specific requirements such as high-parameter analysis, spectral capabilities, or streamlined workflows for clinical diagnostics.
Growth/Marketing Strategy: The report helps organizations implement targeted marketing strategies tailored to key segments such as academic research, immuno-oncology, or infectious disease diagnostics and specific regional opportunities, improving customer engagement and accelerating adoption.
Competitive Strategy: Organizations can differentiate their flow cytometry offerings by emphasizing features particularly valued by end-users in target regions, such as instrument scalability, ease of use, reagent compatibility, after-sales support, or specialized applications like cell therapy or immunophenotyping.
Methodology
Key Considerations and Assumptions in Market Engineering and Validation
- The base year considered for the calculation of the market size is 2024. A historical year analysis has been done for the period FY2021-FY2023. The market size has been estimated for FY2024 and projected for the period FY2025-FY2035.
- The scope of this report has been carefully derived based on interactions with experts in different companies worldwide.
- The market contribution of flow cytometry anticipated to be launched in the future has been calculated based on the historical analysis of the solutions.
- Revenues of the companies have been referenced from their annual reports for FY2023 and FY2024. For private companies, revenues have been estimated based on factors such as inputs obtained from primary research, funding history, market collaborations, and operational history.
- The market has been mapped based on the available flow cytometry products. This report has considered and profiled all the key companies with significant offerings in this field.
- The report excludes repair and maintenance services, other flow cytometry-related services, and refurbished instruments from the market sizing and forecast analysis, focusing purely on new product sales and innovations.
Primary Research:
The primary sources involve industry experts in flow cytometry, including the market players offering products and services. Resources such as CEOs, vice presidents, marketing directors, and salespersons have been interviewed to obtain and verify both qualitative and quantitative aspects of this research study.
The key data points taken from the primary sources include:
- Validation and triangulation of all the numbers and graphs
- Validation of the report's segmentation and key qualitative findings
- Understanding the competitive landscape and business model
- Current and proposed production values of a product by market players
- Percentage split of individual markets for regional analysis
Secondary Research
Open Sources
- Certified publications, articles from recognized authors, white papers, directories, and major databases, among others
- Annual reports, SEC filings, and investor presentations of the leading market players
- Company websites and detailed study of their product portfolio
- Gold standard magazines, journals, white papers, press releases, and news articles
- Paid databases
The key data points taken from the secondary sources include:
- Segmentations and percentage shares
- Data for market value
- Key industry trends of the top players of the market
- Qualitative insights into various aspects of the market, key trends, and emerging areas of innovation
- Quantitative data for mathematical and statistical calculations
Key Market Players and Competition Synopsis
The global flow cytometry market is dominated by Becton, Dickinson and Company, Danaher Corporation (Beckman Coulter, Inc.), and Thermo Fisher Scientific Inc., each offering comprehensive portfolios of instruments, reagents, and consumables that set industry benchmarks for clinical diagnostics and advanced biomedical research. Bio-Rad Laboratories, Inc. specializes in high-resolution flow cytometry solutions and innovative reagents, solidifying its position as a key player in immune research and oncology diagnostics. Cytek Biosciences, Inc., with its cost-effective, high-parameter systems like the Cytek Aurora, is rapidly capturing market share, particularly in advanced spectral applications, and emerging as a formidable competitor. Regional players such as Agilent Technologies, Inc. and Sony Biotechnology, Inc. continue to innovate in specialized niches, including spectral flow cytometry and customized cell analysis tools. To sustain growth, market leaders must focus on continuous product innovation, expanding reagent portfolios, and forging strategic collaborations to address the evolving needs of precision medicine and personalized diagnostics.
Some prominent names established in flow cytometry market are:
Becton, Dickinson and Company (BD)
Danaher Corporation (Beckman Coulter, Inc.)
Thermo Fisher Scientific Inc.
Bio-Rad Laboratories, Inc.
Cytek Biosciences
Agilent Technologies, Inc.
Sony Biotechnology, Inc.
Table of Contents
Executive Summary
Scope and Definition
1 Market: Industry Outlook
- 1.1 Global Flow Cytometry Market, Market Size (US$), 2024-2035
- 1.1.1 Overview
- 1.1.2 Key Findings
- 1.2 Regulatory Landscape/Compliance
- 1.2.1 U.S.
- 1.2.2 Europe
- 1.2.3 Japan
- 1.2.4 Rest-of-the-World
2 Market: Industry Outlook
- 2.1 Market Dynamics
- 2.1.1 Trends, Drivers, Challenges, and Opportunities: Current and Future Impact Assessment, 2024-2035
- 2.2 Trends
- 2.2.1 Continuous Technological Innovations in Flow Cytometry
- 2.2.2 Increasing Collaborations, Strategic Partnerships, and Alliances among Flow Cytometry Players
- 2.3 Market Dynamics
- 2.3.1 Market Drivers
- 2.3.1.1 Rising Cancer Prevalence and the Growing Demand for Advanced Diagnostic Testing
- 2.3.1.2 Growing Use of Flow Cytometry in Regenerative Medicine
- 2.3.1.3 Growing Healthcare R&D Spending Fuels Adoption of Flow Cytometry Technologies
- 2.3.2 Market Restraints
- 2.3.2.1 High Cost of Acquisition
- 2.3.3 Market Opportunities
- 2.3.3.1 Increased Use in Clinical Applications and Infectious Disease Diagnostics
- 2.3.1 Market Drivers
3 Offering Type
- 3.1 Offering Type Summary
- 3.2 Growth-Share Matrix
- 3.2.1 Instruments
- 3.2.1.1 Platforms
- 3.2.1.1.1 Conventional Flow Cytometers (Non-Sorting)
- 3.2.1.1.2 Fluorescence Activated Cell Sorting (FACS)
- 3.2.1.1.3 Imaging Flow Cytometers
- 3.2.1.1.4 Spectral Flow Cytometers
- 3.2.1.1.5 Others
- 3.2.1.2 Replaceable Components and Accessories
- 3.2.1.1 Platforms
- 3.2.2 Reagents and Consumables
- 3.2.2.1 Antibodies
- 3.2.2.2 Fluorescent Dye
- 3.2.2.3 Beads
- 3.2.2.4 Others
- 3.2.3 Software
- 3.2.1 Instruments
4 Method
- 4.1 Method Summary
- 4.2 Growth-Share Matrix
- 4.2.1 Cell-Based Flow Cytometry
- 4.2.2 Bead-Based Flow Cytometry
5 Application
- 5.1 Application Summary
- 5.2 Growth-Share Matrix
- 5.2.1 Clinical Application
- 5.2.1.1 Cancer (Solid Tumor)
- 5.2.1.2 Hematology
- 5.2.1.3 Autoimmune Diseases
- 5.2.1.4 Organ Transplantation
- 5.2.1.5 Others
- 5.2.2 Research Application
- 5.2.2.1 Drug Discovery
- 5.2.2.2 Biomarker Detection
- 5.2.2.3 In-Vitro Toxicology Testing
- 5.2.2.4 Stem Cell Research
- 5.2.2.5 Cell Cycle Analysis
- 5.2.2.6 Cell Viability
- 5.2.2.7 Cell Apoptosis
- 5.2.2.8 Others
- 5.2.3 Industrial
- 5.2.3.1 Food and Beverages
- 5.2.3.2 Water Treatment
- 5.2.3.3 Microbiology Testing
- 5.2.3.4 Cosmetics and Personal Care Industry
- 5.2.3.5 Agriculture and Fermentation Industry
- 5.2.3.6 Other Industries
- 5.2.1 Clinical Application
6 End User
- 6.1 End User Summary
- 6.2 Growth-Share Matrix
- 6.2.1 Pharmaceutical and Biotechnology Companies
- 6.2.2 Hospitals and Clinical Testing Laboratories
- 6.2.3 Academic and Research Institutes
- 6.2.4 Other Industries
7 Region
- 7.1 Regional Summary
- 7.2 Growth-Share Matrix
- 7.2.1 North America
- 7.2.1.1 Regional Overview
- 7.2.1.2 Driving Factors for Market Growth
- 7.2.1.3 Factors Challenging the Market
- 7.2.1.4 Funding Initiatives & Grants
- 7.2.1.5 By Country
- 7.2.1.5.1 U.S.
- 7.2.1.5.2 Canada
- 7.2.2 Europe
- 7.2.2.1 Regional Overview
- 7.2.2.2 Driving Factors for Market Growth
- 7.2.2.3 Factors Challenging the Market
- 7.2.2.4 Funding Initiatives and Grants
- 7.2.2.5 By Country
- 7.2.2.6 U.K.
- 7.2.2.7 Germany
- 7.2.2.8 France
- 7.2.2.9 Italy
- 7.2.2.10 Spain
- 7.2.2.11 Rest-of-Europe
- 7.2.3 Asia-Pacific
- 7.2.3.1 Regional Overview
- 7.2.3.2 Driving Factors for Market Growth
- 7.2.3.3 Factors Challenging the Market
- 7.2.3.4 By Country
- 7.2.3.5 China
- 7.2.3.6 Japan
- 7.2.3.7 India
- 7.2.3.8 South Korea
- 7.2.3.9 Australia
- 7.2.3.10 Thailand
- 7.2.3.11 Singapore
- 7.2.3.12 Rest-of-the-Asia-Pacific
- 7.2.4 Latin America
- 7.2.4.1 Regional Overview
- 7.2.4.2 Driving Factors for Market Growth
- 7.2.4.3 Factors Challenging the Market
- 7.2.4.4 By Country
- 7.2.4.5 Brazil
- 7.2.4.6 Mexico
- 7.2.4.7 Argentina
- 7.2.4.8 Rest-of-Latin America
- 7.2.5 Middle East and Africa
- 7.2.5.1 Regional Overview
- 7.2.5.2 Driving Factors for Market Growth
- 7.2.5.3 Factors Challenging the Market
- 7.2.1 North America
8 Markets - Competitive Benchmarking & Company Profiles
- 8.1 Product Benchmarking By Company
- 8.2 Competitive Landscape
- 8.2.1 Key Strategies and Developments by Company
- 8.2.1.1 Product Launch
- 8.2.1.2 Partnerships
- 8.2.1.3 Funding, Business Expansion, and Corporate Restructuring
- 8.2.1.4 Regulatory Activities
- 8.2.1.5 Merger and Acquisitions
- 8.2.2 Company Position Analysis in Flow Cytometry Market
- 8.2.3 Company Share Analysis in Flow Cytometry Market
- 8.2.1 Key Strategies and Developments by Company
- 8.3 Company Profiles
- 8.3.1 Agilent Technologies, Inc.
- 8.3.1.1 Overview
- 8.3.1.2 Top Products/Product Portfolio
- 8.3.1.3 Top Competitors
- 8.3.1.4 Key Strategic Developments
- 8.3.1.5 Analyst View
- 8.3.1.6 Financial Analysis
- 8.3.2 Becton, Dickinson and Company
- 8.3.2.1 Overview
- 8.3.2.2 Top Products/Product Portfolio
- 8.3.2.3 Top Competitors
- 8.3.2.4 Key Strategic Developments
- 8.3.2.5 Analyst View
- 8.3.2.6 Financial Analysis
- 8.3.3 Bio-Rad Laboratories, Inc.
- 8.3.3.1 Overview
- 8.3.3.2 Top Products/Product Portfolio
- 8.3.3.3 Top Competitors
- 8.3.3.4 Key Strategic Developments
- 8.3.3.5 Analyst View
- 8.3.3.6 Financial Analysis
- 8.3.4 Cytek Biosciences, Inc.
- 8.3.4.1 Overview
- 8.3.4.2 Top Products/Product Portfolio
- 8.3.4.3 Top Competitors
- 8.3.4.4 Key Strategic Developments
- 8.3.4.5 Analyst View
- 8.3.4.6 Key Personal
- 8.3.5 Danaher Corporation (Beckman Coulter)
- 8.3.5.1 Overview
- 8.3.5.2 Top Products/Product Portfolio
- 8.3.5.3 Top Competitors
- 8.3.5.4 Key Strategic Developments
- 8.3.5.5 Analyst View
- 8.3.5.6 Financial Analysis
- 8.3.6 Sony Biotechnology Inc.
- 8.3.6.1 Overview
- 8.3.6.2 Top Products/Product Portfolio
- 8.3.6.3 Top Competitors
- 8.3.6.4 Key Strategic Developments
- 8.3.6.5 Analyst View
- 8.3.7 Thermo Fisher Scientific Inc.
- 8.3.7.1 Overview
- 8.3.7.2 Top Products/Product Portfolio
- 8.3.7.3 Top Competitors
- 8.3.7.4 Key Strategic Developments
- 8.3.7.5 Analyst View
- 8.3.7.6 Financial Analysis
- 8.3.8 Sysmex Corporation
- 8.3.8.1 Overview
- 8.3.8.2 Top Products/Product Portfolio
- 8.3.8.3 Top Competitors
- 8.3.8.4 Key Strategic Developments
- 8.3.8.5 Analyst View
- 8.3.8.6 Financial Analysis
- 8.3.9 Merck KGaA
- 8.3.9.1 Overview
- 8.3.9.2 Top Products/Product Portfolio
- 8.3.9.3 Top Competitors
- 8.3.9.4 Target Customers
- 8.3.9.5 Key Personal
- 8.3.9.6 Analyst View
- 8.3.9.7 Financial Analysis
- 8.3.10 Miltenyi Biotec
- 8.3.10.1 Overview
- 8.3.10.2 Top Products/Product Portfolio
- 8.3.10.3 Top Competitors
- 8.3.10.4 Target Customers
- 8.3.10.5 Key Personal
- 8.3.10.6 Analyst View
- 8.3.10.7 Financial Analysis
- 8.3.11 Stratedigm, Inc.
- 8.3.11.1 Overview
- 8.3.11.2 Top Products/Product Portfolio
- 8.3.11.3 Top Competitors
- 8.3.11.4 Target Customers
- 8.3.11.5 Key Personal
- 8.3.11.6 Analyst View
- 8.3.12 Cell Signaling Technology Inc.
- 8.3.12.1 Overview
- 8.3.12.2 Top Products/Product Portfolio
- 8.3.12.3 Top Competitors
- 8.3.12.4 Target Customers
- 8.3.12.5 Key Personal
- 8.3.12.6 Analyst View
- 8.3.13 STEMCELL Technologies
- 8.3.13.1 Overview
- 8.3.13.2 Top Products/Product Portfolio
- 8.3.13.3 Top Competitors
- 8.3.13.4 Target Customers
- 8.3.13.5 Key Personal
- 8.3.13.6 Analyst View
- 8.3.14 Bio-Techne
- 8.3.14.1 Overview
- 8.3.14.2 Top Products/Product Portfolio
- 8.3.14.3 Top Competitors
- 8.3.14.4 Target Customers
- 8.3.14.5 Key Personal
- 8.3.14.6 Analyst View
- 8.3.14.7 Financial Analysis
- 8.3.15 Revvity (BioLegend, Inc)
- 8.3.15.1 Overview
- 8.3.15.2 Top Products/Product Portfolio
- 8.3.15.3 Top Competitors
- 8.3.15.4 Target Customers
- 8.3.15.5 Key Personal
- 8.3.15.6 Analyst View
- 8.3.15.7 Financial Analysis
- 8.3.1 Agilent Technologies, Inc.
9 Research Methodology
- 9.1 Data Sources
- 9.1.1 Primary Data Sources
- 9.1.2 Secondary Data Sources
- 9.1.3 Data Triangulation
- 9.2 Market Estimation and Forecast
