|
|
市場調査レポート
商品コード
1700013
欧州のスマート農業市場:用途別、ハードウェア別、ソフトウェア別、国別 - 分析と予測(2024年~2034年)Europe Smart Farming Market: Focus on Application, Hardware, Software, and Country - Analysis and Forecast, 2024-2034 |
||||||
|
|||||||
カスタマイズ可能
|
|||||||

| 欧州のスマート農業市場:用途別、ハードウェア別、ソフトウェア別、国別 - 分析と予測(2024年~2034年) |
|
出版日: 2025年04月10日
発行: BIS Research
ページ情報: 英文 112 Pages
納期: 1~5営業日
|

全表示
- 概要
- 図表
- 目次
欧州のスマート農業の市場規模は、2024年の39億8,000万米ドルから2034年には221億9,000万米ドルに達し、予測期間の2024年~2034年のCAGRは18.73%になると予測されています。
欧州のスマート農業市場は、最先端技術の利用が拡大し、環境に優しい農法に注目が集まっていることから、大幅な拡大が見込まれています。食料需要の増加、効果的な資源管理の必要性、IoT、AI、ロボット工学を農業経営に取り入れることなどが、この拡大の主な促進要因となっています。伝統的な農法は、データ主導の意思決定と精密農業のアプローチによって変革されつつあります。さらに、この地域が環境への影響を最小限に抑えながら生産量を増やすことに専念していることは、政府の強力なイニシアチブとスマート農業技術への投資によって実証されています。このような環境の変化は、農業革新と持続可能性に対する欧州のコミットメントを示しています。
| 主要市場統計 | |
|---|---|
| 予測期間 | 2024年~2034年 |
| 2024年の評価 | 39億8,000万米ドル |
| 2034年の予測 | 221億9,000万米ドル |
| CAGR | 18.73% |
持続可能な農法への需要と最先端技術の受け入れ拡大が、欧州のスマート農業市場を牽引しています。農業生産高と作業効率を高めるために、スマート農業はロボット工学、人工知能(AI)、モノのインターネット(IoT)、データ分析を活用しています。欧州各地の農家は、食糧需要の増大と資源管理の最大化の必要性に対応し、リアルタイムのモニタリング、予測分析、自動意思決定を可能にする精密農法を採用しています。
農業経営が環境に与える影響を軽減することを目的としたさまざまな法律、助成金、研究プロジェクトを通じて、この地域の政府は農業のデジタル変革を積極的に推進しています。また、アグリテック企業の増加や農業イノベーションへの投資も、市場の成長を加速させています。
作物モニタリング、動物管理、温室自動化、農場管理ソフトウェアは、欧州におけるスマート農業の主な用途の一部です。農家がドローン、センサー、GPS技術を使って作物の状態、天候パターン、土壌の健康状態に関する重要な情報を収集した結果、収量と資源効率が向上しました。
欧州のスマート農業市場は、持続可能性と食糧安全保障が高い優先順位を与えられている限り成長し続けると予想されます。これは、より弾力的で技術的に高度な農業部門を作るのに役立つとみられています。
当レポートは、欧州スマート農業市場の包括的な製品/イノベーション戦略を提供し、市場参入、技術採用、持続可能な成長の機会を特定します。当レポートは、企業が環境基準を満たし、競合優位性を獲得し、様々な産業における環境に優しいソリューションの需要増を活用するのに役立つ、実用的な考察を提供しています。
当レポートは、欧州のスマート農業市場に特化して設計された包括的な成長・マーケティング戦略を提供します。特化した市場セグメントを特定し、競争優位性を確立し、市場シェアと財務業績の最適化を目指した創造的なマーケティング・イニシアティブを実施するための的を絞ったアプローチを提示しています。これらの戦略的提言を活用することで、企業は市場での存在感を高め、新たな展望をつかみ、収益拡大を効率的に推進することができます。
欧州のスマート農業市場に合わせた強力な競争戦略を構築します。市場ライバルを評価し、際立つための方法を提案し、競争力を維持するための指針を提供します。これらの戦略的指示に従うことで、企業は市場競争に直面しても効果的なポジションを確立し、持続的な繁栄と収益性を確保することができます。
スマート農業市場でプロファイルされている企業は、主要な専門家から収集した情報に基づいて選択されており、企業のカバレッジ、製品ポートフォリオ、市場浸透度を分析しています。
目次
エグゼクティブサマリー
第1章 市場:業界展望
- 動向:現状と将来への影響評価
- 5G:スマート農業の未来
- LoRa広域ネットワーク(LoRaWAN)
- サプライチェーンの概要
- バリューチェーン分析
- 価格分析
- 規制状況
- 研究開発レビュー
- 特許出願動向(国別・企業別)
- スタートアップの情勢
- 2023年のエコシステムにおける主要スタートアップ
- 2023年の資金調達分析
- ステークホルダー分析
- 使用事例
- エンドユーザーと購入基準
- 主要な世界的出来事の影響分析
- 市場力学の概要
- 市場の促進要因
- 市場の課題
- 市場の機会
第2章 地域
- 地域サマリー
- 欧州
- 地域概要
- 市場成長促進要因
- 市場成長抑制要因
- ドイツ
- フランス
- 英国
- イタリア
- オランダ
- スペイン
- ギリシャ
- スイス
- ウクライナ
- ベルギー
- その他
第3章 市場-競合ベンチマーキングと企業プロファイル
- 今後の見通し
- 地理的評価
- 企業プロファイル
- CNH Industrial N.V.
- Hexagon AB
- BASF
- Connecterra B.V.
- Signify Holding
- Nedap N.V.
- GEA Group Aktiengesellschaft
- AKVA group ASA
- AquaManager
第4章 調査手法
List of Figures
- Figure 1: Europe Smart Farming Market (by Scenario), $Million, 2024, 2028, and 2034
- Figure 2: Smart Farming Market (by Region), $Million, 2024, 2028, and 2034
- Figure 3: Europe Smart Farming Market (by Application), $Million, 2024, 2028, and 2034
- Figure 4: Europe Smart Farming Market (by Product Type), $Million, 2024, 2028, and 2034
- Figure 5: Europe Smart Farming Market (by Software Type), $Million, 2024, 2028, and 2034
- Figure 6: Europe Smart Farming Market (by Hardware Type), $Million, 2024, 2028, and 2034
- Figure 7: Key Events
- Figure 8: Applications of 5G in Smart Farming Operations
- Figure 9: Patent Filed (by Country), January 2021-July 2024
- Figure 10: Patent Filed, by Company, January 2021-July 2024
- Figure 11: Funding (by Region), $Million, 2023
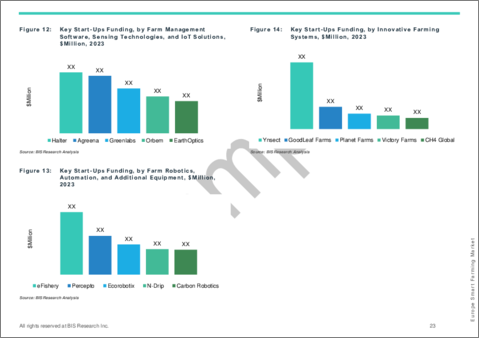
- Figure 12: Key Start-Ups Funding, by Farm Management Software, Sensing Technologies, and IoT Solutions, $Million, 2023
- Figure 13: Key Start-Ups Funding, by Farm Robotics, Automation, and Additional Equipment, $Million, 2023
- Figure 14: Key Start-Ups Funding, by Innovative Farming Systems, $Million, 2023
- Figure 15: Title: Enhancing Crop Yield with Precision Agriculture and IoT
- Figure 16: Impact Analysis of Europe Smart Farming Market Navigating Factors, 2024-2034
- Figure 17: Share of Freshwater Withdrawal (by Sector), 2023
- Figure 18: Germany Smart Farming Market, $Million, 2023-2034
- Figure 19: France Smart Farming Market, $Million, 2023-2034
- Figure 20: U.K. Smart Farming Market, $Million, 2023-2034
- Figure 21: Italy Smart Farming Market, $Million, 2023-2034
- Figure 22: Netherlands Smart Farming Market, $Million, 2023-2034
- Figure 23: Spain Smart Farming Market, $Million, 2023-2034
- Figure 24: Greece Smart Farming Market, $Million, 2023-2034
- Figure 25: Switzerland Smart Farming Market, $Million, 2023-2034
- Figure 26: Ukraine Smart Farming Market, $Million, 2023-2034
- Figure 27: Belgium Smart Farming Market, $Million, 2023-2034
- Figure 28: Rest-of-Europe Smart Farming Market, $Million, 2023-2034
- Figure 29: Strategic Initiatives, 2021-2024
- Figure 30: Market Share Analysis, 2023
- Figure 31: Share of Strategic Initiatives, 2021-2024
- Figure 32: Data Triangulation
- Figure 33: Top-Down and Bottom-Up Approach
- Figure 34: Assumptions and Limitations
List of Tables
- Table 1: Market Snapshot
- Table 2: Opportunities across Region
- Table 3: Competitive Landscape Snapshot
- Table 4: Smart Farming Market (by Region), $Million, 2023-2034
- Table 5: Smart Farming Market (by Region), Thousand Units, 2023-2034
- Table 6: Europe Smart Farming Market (by Application), $Million, 2023-2034
- Table 7: Europe Smart Farming Market (by Product), $Million, 2023-2034
- Table 8: Europe Smart Farming Market (by Hardware), $Million, 2023-2034
- Table 9: Europe Smart Farming Market (by Hardware), Thousand Units, 2023-2034
- Table 10: Europe Smart Farming Market (by Software), $Million, 2023-2034
- Table 11: Germany Smart Farming Market (by Application), $Million, 2023-2034
- Table 12: Germany Smart Farming Market (by Product), $Million, 2023-2034
- Table 13: Germany Smart Farming Market (by Hardware), $Million, 2023-2034
- Table 14: Germany Smart Farming Market (by Hardware), Thousand Units, 2023-2034
- Table 15: Germany Smart Farming Market (by Software), $Million, 2023-2034
- Table 16: France Smart Farming Market (by Application), $Million, 2023-2034
- Table 17: France Smart Farming Market (by Product), $Million, 2023-2034
- Table 18: France Smart Farming Market (by Hardware), $Million, 2023-2034
- Table 19: France Smart Farming Market (by Hardware), Thousand Units, 2023-2034
- Table 20: France Smart Farming Market (by Software), $Million, 2023-2034
- Table 21: U.K. Smart Farming Market (by Application), $Million, 2023-2034
- Table 22: U.K. Smart Farming Market (by Product), $Million, 2023-2034
- Table 23: U.K. Smart Farming Market (by Hardware), $Million, 2023-2034
- Table 24: U.K. Smart Farming Market (by Hardware), Thousand Units, 2023-2034
- Table 25: U.K. Smart Farming Market (by Software), $Million, 2023-2034
- Table 26: Italy Smart Farming Market (by Application), $Million, 2023-2034
- Table 27: Italy Smart Farming Market (by Product), $Million, 2023-2034
- Table 28: Italy Smart Farming Market (by Hardware), $Million, 2023-2034
- Table 29: Italy Smart Farming Market (by Hardware), Thousand Units, 2023-2034
- Table 30: Italy Smart Farming Market (by Software), $Million, 2023-2034
- Table 31: Netherlands Smart Farming Market (by Application), $Million, 2023-2034
- Table 32: Netherlands Smart Farming Market (by Product), $Million, 2023-2034
- Table 33: Netherlands Smart Farming Market (by Hardware), $Million, 2023-2034
- Table 34: Netherlands Smart Farming Market (by Hardware), Thousand Units, 2023-2034
- Table 35: Netherlands Smart Farming Market (by Software), $Million, 2023-2034
- Table 36: Spain Smart Farming Market (by Application), $Million, 2023-2034
- Table 37: Spain Smart Farming Market (by Product), $Million, 2023-2034
- Table 38: Spain Smart Farming Market (by Hardware), $Million, 2023-2034
- Table 39: Spain Smart Farming Market (by Hardware), Thousand Units, 2023-2034
- Table 40: Spain Smart Farming Market (by Software), $Million, 2023-2034
- Table 41: Greece Smart Farming Market (by Application), $Million, 2023-2034
- Table 42: Greece Smart Farming Market (by Product), $Million, 2023-2034
- Table 43: Greece Smart Farming Market (by Hardware), $Million, 2023-2034
- Table 44: Greece Smart Farming Market (by Hardware), Thousand Units, 2023-2034
- Table 45: Greece Smart Farming Market (by Software), $Million, 2023-2034
- Table 46: Switzerland Smart Farming Market (by Application), $Million, 2023-2034
- Table 47: Switzerland Smart Farming Market (by Product), $Million, 2023-2034
- Table 48: Switzerland Smart Farming Market (by Hardware), $Million, 2023-2034
- Table 49: Switzerland Smart Farming Market (by Hardware), Thousand Units, 2023-2034
- Table 50: Switzerland Smart Farming Market (by Software), $Million, 2023-2034
- Table 51: Ukraine Smart Farming Market (by Application), $Million, 2023-2034
- Table 52: Ukraine Smart Farming Market (by Product), $Million, 2023-2034
- Table 53: Ukraine Smart Farming Market (by Hardware), $Million, 2023-2034
- Table 54: Ukraine Smart Farming Market (by Hardware), Thousand Units, 2023-2034
- Table 55: Ukraine Smart Farming Market (by Software), $Million, 2023-2034
- Table 56: Belgium Smart Farming Market (by Application), $Million, 2023-2034
- Table 57: Belgium Smart Farming Market (by Product), $Million, 2023-2034
- Table 58: Belgium Smart Farming Market (by Hardware), $Million, 2023-2034
- Table 59: Belgium Smart Farming Market (by Hardware), Thousand Units, 2023-2034
- Table 60: Belgium Smart Farming Market (by Software), $Million, 2023-2034
- Table 61: Rest-of-Europe Smart Farming Market (by Application), $Million, 2023-2034
- Table 62: Rest-of-Europe Smart Farming Market (by Product), $Million, 2023-2034
- Table 63: Rest-of-Europe Smart Farming Market (by Hardware), $Million, 2023-2034
- Table 64: Rest-of-Europe Smart Farming Market (by Hardware), Thousand Units, 2023-2034
- Table 65: Rest-of-Europe Smart Farming Market (by Software), $Million, 2023-2034
Introduction to Europe Smart Farming Market
The Europe smart farming market is projected to reach $22.19 billion by 2034 from $3.98 billion in 2024, growing at a CAGR of 18.73% during the forecast period 2024-2034. Europe smart farming market is expected to increase significantly due to the growing use of cutting-edge technologies and a focus on environmentally friendly farming methods. The growing demand for food, the requirement for effective resource management, and the incorporation of IoT, AI, and robotics into farming operations are some of the main drivers of this expansion. Traditional agricultural practices are being revolutionised by data-driven decision-making and precision farming approaches. Additionally, the region's dedication to increasing output while minimising environmental effect is demonstrated by the strong government initiatives and investments in smart agricultural technologies. This changing environment demonstrates Europe's commitment to agricultural innovation and sustainability.
Market Introduction
| KEY MARKET STATISTICS | |
|---|---|
| Forecast Period | 2024 - 2034 |
| 2024 Evaluation | $3.98 Billion |
| 2034 Forecast | $22.19 Billion |
| CAGR | 18.73% |
The demand for sustainable agricultural methods and the growing acceptance of cutting-edge technologies are driving the market for smart farming in Europe. In order to increase agricultural output and operational efficiency, smart farming makes use of robotics, artificial intelligence (AI), the Internet of Things (IoT), and data analytics. Farmers around Europe are adopting precision farming methods that allow for real-time monitoring, predictive analytics, and automated decision-making in response to the growing demand for food and the need to maximise resource management.
Through a variety of laws, grants, and research projects targeted at lessening the environmental impact of farming operations, governments in the area are aggressively promoting the digital transformation of agriculture. The market's growth is also being accelerated by the rise in agritech firms and investments in agricultural innovation.
Crop monitoring, animal management, greenhouse automation, and farm management software are some of the main uses of smart farming in Europe. Improved yields and resource efficiency are the results of farmers using drones, sensors, and GPS technology to gather important information on crop conditions, weather patterns, and soil health.
The European smart farming market is anticipated to keep growing as long as sustainability and food security are given high priority. This will help create a more resilient and technologically advanced agricultural sector.
Market Segmentation:
Segmentation 1: by Application
- Precision Farming or Precision Agriculture
- Precision Irrigation
- Yield Monitoring and Crop Scouting or Forecasting
- Precision Planting
- Precision Spraying
- Precision Fertilization
- Farm Management
- Other
- Livestock Monitoring and Management
- Milk Harvesting
- Animal Health Monitoring and Comfort
- Feeding Management
- Livestock Tracking
- Other
- Aquaculture
- Feed Management
- Aquatic Species Tracking and Navigation
- Water Quality Management
- Other
- Others
Segmentation 2: by Product Type
- Hardware
- Displays/Yield Monitors
- Flow and Application Rate Control Valves
- Farm Computers, and Mobile Devices and Laptops
- Agricultural Sensors
- Guidance and Steering Systems
- Other
- Software
- Farm Operation Management
- Hardware Control Application
- Data and Predictive Analytics
Segmentation 3: by Country
- Germany
- U.K.
- France
- Italy
- Netherlands
- Spain
- Greece
- Switzerland
- Ukraine
- Belgium
- Rest-of-Europe
How can this report add value to an organization?
Product/Innovation Strategy: This report provides a comprehensive product/innovation strategy for the Europe smart farming market, identifying opportunities for market entry, technology adoption, and sustainable growth. It offers actionable insights, helping organizations to meet environmental standards, gain a competitive edge, and capitalize on the increasing demand for eco-friendly solutions in various industries.
Growth/Marketing Strategy: This report offers a comprehensive growth and marketing strategy designed specifically for the Europe smart farming market. It presents a targeted approach to identifying specialized market segments, establishing a competitive advantage, and implementing creative marketing initiatives aimed at optimizing market share and financial performance. By harnessing these strategic recommendations, organizations can elevate their market presence, seize emerging prospects, and efficiently propel revenue expansion.
Competitive Strategy: This report crafts a strong competitive strategy tailored to the Europe smart farming market. It evaluates market rivals, suggests methods to stand out, and offers guidance for maintaining a competitive edge. By adhering to these strategic directives, companies can position themselves effectively in the face of market competition, ensuring sustained prosperity and profitability.
Key Market Players and Competition Synopsis
The companies that are profiled in the smart farming market have been selected based on input gathered from primary experts and analyzing company coverage, product portfolio, and market penetration.
Some of the prominent names in this market are:
- CNH Industrial N.V.
- Hexagon AB
- BASF
- Connecterra B.V.
- Signify Holding
- Nedap N.V.
- GEA Group Aktiengesellschaft
- AKVA group ASA
- AquaManager
Table of Contents
Executive Summary
Scope and Definition
1 Market: Industry Outlook
- 1.1 Trends: Current and Future Impact Assessment
- 1.1.1 5G: The Future of Smart Farming
- 1.1.2 LoRa Wide Area Network (LoRaWAN)
- 1.2 Supply Chain Overview
- 1.2.1 Value Chain Analysis
- 1.2.2 Pricing Analysis
- 1.3 Regulatory Landscape
- 1.4 Research and Development Review
- 1.4.1 Patent Filing Trend (by Country and Company)
- 1.5 Start-Up Landscape
- 1.5.1 Key Start-Ups in Ecosystem, 2023
- 1.5.1.1 Farm Management Software, Sensing Technologies, and IoT Solutions
- 1.5.1.2 Farm Robotics, Automation, and Additional Equipment
- 1.5.1.3 Innovative Farming Systems
- 1.5.2 Funding Analysis, 2023
- 1.5.1 Key Start-Ups in Ecosystem, 2023
- 1.6 Stakeholder Analysis
- 1.6.1 Use Case
- 1.6.2 End User and Buying Criteria
- 1.7 Impact Analysis for Key Global Events
- 1.8 Market Dynamics Overview
- 1.8.1 Market Drivers
- 1.8.1.1 Increasing Need for Sustainable Agricultural Practices
- 1.8.1.2 Growing Adoption of Precision Agriculture
- 1.8.2 Market Challenges
- 1.8.2.1 Lack of Technical Expertise among Farmers
- 1.8.2.2 Rising Concern over Data Security with Increasing Cyber Attacks
- 1.8.3 Market Opportunities
- 1.8.3.1 Increasing Investment in Agriculture Technology Start-Ups
- 1.8.3.2 Securing the Agriculture Value Chain with Blockchain
- 1.8.1 Market Drivers
2 Regions
- 2.1 Regional Summary
- 2.2 Europe
- 2.2.1 Regional Overview
- 2.2.2 Driving Factors for Market Growth
- 2.2.3 Factors Challenging the Market
- 2.2.3.1 Application
- 2.2.3.2 Product
- 2.2.4 Germany
- 2.2.4.1 Application
- 2.2.4.2 Product
- 2.2.5 France
- 2.2.5.1 Application
- 2.2.5.2 Product
- 2.2.6 U.K.
- 2.2.6.1 Application
- 2.2.6.2 Product
- 2.2.7 Italy
- 2.2.7.1 Application
- 2.2.7.2 Product
- 2.2.8 Netherlands
- 2.2.8.1 Application
- 2.2.8.2 Product
- 2.2.9 Spain
- 2.2.9.1 Application
- 2.2.9.2 Product
- 2.2.10 Greece
- 2.2.10.1 Application
- 2.2.10.2 Product
- 2.2.11 Switzerland
- 2.2.11.1 Application
- 2.2.11.2 Product
- 2.2.12 Ukraine
- 2.2.12.1 Application
- 2.2.12.2 Product
- 2.2.13 Belgium
- 2.2.13.1 Application
- 2.2.13.2 Product
- 2.2.14 Rest-of-Europe
- 2.2.14.1 Application
- 2.2.14.2 Product
3 Markets - Competitive Benchmarking & Company Profiles
- 3.1 Next Frontiers
- 3.2 Geographic Assessment
- 3.3 Company Profiles
- 3.3.1 CNH Industrial N.V.
- 3.3.1.1 Overview
- 3.3.1.2 Top Products/Product Portfolio
- 3.3.1.3 Top Competitors
- 3.3.1.4 Target Customers
- 3.3.1.5 Key Personnel
- 3.3.1.6 Analyst View
- 3.3.2 Hexagon AB
- 3.3.2.1 Overview
- 3.3.2.2 Top Products/Product Portfolio
- 3.3.2.3 Top Competitors
- 3.3.2.4 Target Customers
- 3.3.2.5 Key Personnel
- 3.3.2.6 Analyst View
- 3.3.3 BASF
- 3.3.3.1 Overview
- 3.3.3.2 Top Products/Product Portfolio
- 3.3.3.3 Top Competitors
- 3.3.3.4 Target Customers
- 3.3.3.5 Key Personnel
- 3.3.3.6 Analyst View
- 3.3.4 Connecterra B.V.
- 3.3.4.1 Overview
- 3.3.4.2 Top Products/Product Portfolio
- 3.3.4.3 Top Competitors
- 3.3.4.4 Target Customers
- 3.3.4.5 Key Personnel
- 3.3.4.6 Analyst View
- 3.3.5 Signify Holding
- 3.3.5.1 Overview
- 3.3.5.2 Top Products/Product Portfolio
- 3.3.5.3 Top Competitors
- 3.3.5.4 Target Customers
- 3.3.5.5 Key Personnel
- 3.3.5.6 Analyst View
- 3.3.6 Nedap N.V.
- 3.3.6.1 Overview
- 3.3.6.2 Top Products/Product Portfolio
- 3.3.6.3 Top Competitors
- 3.3.6.4 Target Customers
- 3.3.6.5 Key Personnel
- 3.3.6.6 Analyst View
- 3.3.7 GEA Group Aktiengesellschaft
- 3.3.7.1 Overview
- 3.3.7.2 Top Products/Product Portfolio
- 3.3.7.3 Top Competitors
- 3.3.7.4 Target Customers
- 3.3.7.5 Key Personnel
- 3.3.7.6 Analyst View
- 3.3.8 AKVA group ASA
- 3.3.8.1 Overview
- 3.3.8.2 Top Products/Product Portfolio
- 3.3.8.3 Top Competitors
- 3.3.8.4 Target Customers
- 3.3.8.5 Key Personnel
- 3.3.8.6 Analyst View
- 3.3.9 AquaManager
- 3.3.9.1 Overview
- 3.3.9.2 Top Products/Product Portfolio
- 3.3.9.3 Top Competitors
- 3.3.9.4 Target Customers
- 3.3.9.5 Key Personnel
- 3.3.9.6 Analyst View
- 3.3.1 CNH Industrial N.V.
4 Research Methodology
- 4.1 Data Sources
- 4.1.1 Primary Data Sources
- 4.1.2 Secondary Data Sources
- 4.1.3 Data Triangulation
- 4.2 Market Estimation and Forecast

