|
|
市場調査レポート
商品コード
1667210
空間ゲノミクスおよびトランスクリプトミクスの世界市場:製品タイプ・サンプルタイプ・ワークフロー・用途・エンドユーザー・地域別の分析・予測 (2024-2034年)Spatial Genomics and Transcriptomics Market - A Global and Regional Analysis: Focus on Product Type, Sample Type, Workflow, Application, End User, and Region - Analysis and Forecast, 2024-2034 |
||||||
|
|||||||
カスタマイズ可能
|
|||||||

| 空間ゲノミクスおよびトランスクリプトミクスの世界市場:製品タイプ・サンプルタイプ・ワークフロー・用途・エンドユーザー・地域別の分析・予測 (2024-2034年) |
|
出版日: 2025年03月04日
発行: BIS Research
ページ情報: 英文 115 Pages
納期: 1~5営業日
|

全表示
- 概要
- 図表
- 目次
世界の空間ゲノミクスおよびトランスクリプトミクスの市場規模は、2023年の5億7,390万米ドルから、予測期間中は12.54%のCAGRで推移し、2034年には21億5,860万米ドルに急増すると予測されています。
同市場は、創薬や市場開拓のための空間オミクス利用の増加、シーケンシング技術の進歩、高分解能シングルセル解析の需要増加、癌や神経疾患などの複雑な疾患の有病率の上昇などが主な要因となって、著しい成長を遂げています。さらに、個別化医療や精密オンコロジーにおける空間ゲノミクスの応用が増加しており、研究者や臨床医が分子レベルでの疾患メカニズムに関するより正確な洞察を求めていることから、市場の拡大が見込まれています。
| 主要市場統計 | |
|---|---|
| 予測期間 | 2024-2034年 |
| 2024年評価 | 6億6,230万米ドル |
| 2034年予測 | 21億5,860万米ドル |
| CAGR | 12.54% |
世界の空間ゲノミクスおよびトランスクリプトミクスの市場は、政府機関や民間機関によるゲノミクス研究への投資拡大や、バイオテクノロジー企業と学術機関の共同研究によって大きな成長を遂げており、空間解析技術の採用を加速させています。空間トランスクリプトミクスへの投資が増加し続ける中、この分野は大きな成長と画期的なブレークスルーをもたらす位置付けにあります。継続的な財政支援は、間違いなく空間的遺伝子発現解析のさらなる進歩を促進し、研究パラダイムを再構築し、精密医療の境界を再定義する可能性を強めるでしょう
製品タイプ別では、キットおよびアッセイのセグメントが優位に:
製品タイプ別に見ると、キットおよびアッセイのセグメントが2023年に最大のシェアを占め、予測期間中は12.27%のCAGRで推移し、2034年には11億1,620万米ドルに達すると予測されています。この優位性は、サンプル調製、染色、検出のための重要な試薬やツールを提供し、空間分析ワークフローにおいて不可欠な役割を担っていることに起因しています。単一細胞解析、組織プロファイリング、創薬などの用途で、これらの製品は腫瘍、免疫、神経などの研究分野で不可欠なものとなっています。さらに、多くの研究機関や製薬会社が、カスタマイズされた分析、データ解釈、バイオマーカー探索のためのアウトソーシングサービスをますます利用するようになっているため、サービス分野も牽引力を増しています。このような強固な製品提供とサービス能力の拡大が相まって、空間ゲノミクスおよびトランスクリプトミクス市場全体の成長が今後数年間で促進されると予想されています。
サンプルタイプ別では、新鮮凍結組織のセグメントが優位に:
サンプルタイプ別に見ると、新鮮凍結組織のセグメントが2023年に最大のシェアを占め、予測期間中は12.40%のCAGRで推移し、2034年には11億3,180万米ドルに達すると予測されています。新鮮凍結組織は、分子の完全性を保つために採取後すぐに凍結される生体組織です。このセグメントの成長は、主に臨床研究や診断用途のために、組織を無傷の形態、タンパク質、DNA、RNAで保存する必要性がある点に起因しています。新鮮凍結組織は構造的完全性を維持し、研究実験に不可欠な最適な透過条件を提供します。
ワークフロー別では、空間イメージングのセグメントが優位に:
ワークフロー別では、空間イメージングのセグメントが2023年に最大のシェアを占め、予測期間中はCAGR 12.29%で推移し、2034年には10億9,570万米ドルに達すると予測されています。空間イメージングによって、本来の組織環境内での遺伝物質 (DNA) と遺伝子[除去]RNA) の空間的組織の探査が可能になります。このセグメントは、イメージング技術、マスサイトメトリー、マススペクトロメトリーにおけるイノベーションに牽引され、大きな成長を経験しています。さらに、AIと機械学習 (ML) の進歩により、画像再構成の精度と効率がさらに向上し、リアルタイムの空間イメージングがますます現実的になっています。大規模なデータセットと適応学習アルゴリズムを活用することで、AIとMLは既存の限界に対処し、より高い精度とスピードで画像処理と解釈を強化します。
セグメンテーション1:製品タイプ別
- キットおよびアッセイ
- サンプル調製キット
- サンプル濃縮キット
- 機器
- スライドスキャナー
- 顕微鏡
- マスサイトメトリー
- ソフトウェア
- サービス
セグメンテーション2:サンプルタイプ別
- 新鮮凍結組織
- 固定凍結組織
- ホルマリン固定パラフィン包埋 (FFPE) 組織
- 培養細胞
セグメンテーション3:ワークフロー別
- 空間イメージング
- レーザーキャプチャーマイクロダイセクション (LCM)
- 免疫組織化学 (IHC)
- 蛍光in-situハイブリダイゼーション (FISH)
- 顕微鏡検査
- バーコード
- その他
- 空間シーケンシング
- 次世代シーケンシング(NGS)
- 生体内転写
- 蛍光in-situシーケンシング(FISSEQ)
- マイクロトミーシーケンシング
- その他
- 空間解析
- データ可視化ツール
- データ解析ツール
セグメンテーション4:用途別
- 診断
- 癌診断
- 神経疾患診断
- 免疫疾患診断
- その他
- トランスレーショナルリサーチ
- 創薬・開発
- 単一細胞分析
- 細胞生物
- その他
セグメンテーション5:エンドユーザー別
- 学術機関および研究機関
- バイオ医薬品・バイオテクノロジー企業
- 受託研究機関
- その他
地域別セグメンテーション
- 北米
- 米国
- カナダ
- 欧州
- ドイツ
- 英国
- フランス
- イタリア
- スペイン
- その他
- アジア太平洋
- 中国
- 日本
- インド
- オーストラリア
- シンガポール
- その他
- ラテンアメリカ
- ブラジル
- メキシコ
- その他
- 中東・アフリカ
当レポートでは、世界の空間ゲノミクスおよびトランスクリプトミクスの市場を調査し、主要動向、市場影響因子の分析、法規制環境、市場規模の推移・予測、各種区分・地域/主要国別の詳細分析、競合情勢、主要企業のプロファイルなどをまとめています。
目次
エグゼクティブサマリー
範囲と定義
第1章 世界の空間ゲノミクスおよびトランスクリプトミクスの市場:概要
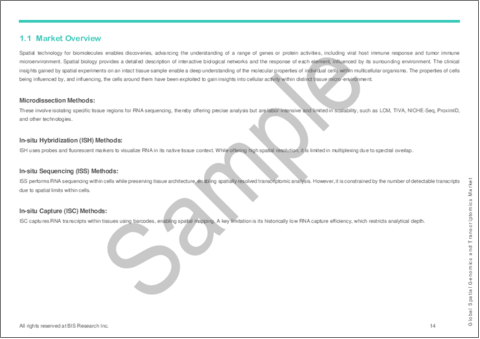
- 市場概要
- 規制の枠組み
- 米国
- EU
- 日本
- 中国
- 特許分析
- 特許出願動向 (国別)
- 特許出願動向 (年別)
- サプライチェーン分析
- バリューチェーン分析
- 市場力学の概要
- 市場促進要因
- 市場抑制要因
- 市場機会
第2章 世界の空間ゲノミクスおよびトランスクリプトミクスの市場:製品別
- キットとアッセイ
- サンプル調製キット
- サンプルエンリッチメントキット
- 機器
- スライドスキャナ
- 顕微鏡検査
- マスサイトメトリー
- ソフトウェア
- サービス
第3章 世界の空間ゲノミクスおよびトランスクリプトミクスの市場:サンプルタイプ別
- 新鮮凍結組織
- 固定凍結組織
- ホルマリン固定パラフィン包埋 (FFPE) 組織
- 培養細胞
第4章 世界の空間ゲノミクスおよびトランスクリプトミクスの市場:ワークフロー別
- 空間イメージング
- レーザーキャプチャーマイクロダイセクション (LCM)
- 免疫組織化学 (IHC)
- 蛍光in-situハイブリダイゼーション (FISH) 培養細胞
- 顕微鏡検査
- バーコード
- その他
- 空間シーケンシング
- 次世代シーケンシング (NGS)
- 生体内転写
- 蛍光インサイチュシーケンシング(FISSEQ)
- ミクロトミーシーケンシング
- その他
- 空間分析
- データ視覚化ツール
- データ分析ツール
第5章 世界の空間ゲノミクスおよびトランスクリプトミクスの市場:用途別
- 診断
- 癌診断
- 神経診断
- 免疫診断
- その他の診断
- 医薬品の発見と開発
- トランスレーショナルリサーチ
- 単一細胞解析
- 細胞生物学
- その他
第6章 世界の空間ゲノミクスおよびトランスクリプトミクスの市場:エンドユーザー別
- 学術機関および研究機関
- バイオ医薬品およびバイオテクノロジー企業
- CRO
- その他
第7章 世界の空間ゲノミクスおよびトランスクリプトミクスの市場:地域別
- 北米
- 欧州
- アジア太平洋
- ラテンアメリカ
- 中東・アフリカ
- 地域概要
- 市場成長の原動力
- 市場課題
第8章 競合考察と企業プロファイル
- 主要戦略と開発
- 企業プロファイル
- 10x Genomics.
- Akoya Biosciences, Inc.
- Bruker Corporation
- Bio-Techne.
- BioSpyder, Inc.
- Flagship Biosciences, Inc.
- Illumina, Inc.
- Miltenyi Biotec
- MGI Tech Co., Ltd.
- RareCyte, Inc.
- Revvity, Inc.
- S2 Genomics, Inc.
- Standard BioTools
- TissueGnostics GmbH
- Vizgen Inc.
第9章 調査手法
List of Figures
- Figure 1: Global Spatial Genomics and Transcriptomics Market, $Million, 2024, 2028, and 2034
- Figure 2: Global Spatial Genomics and Transcriptomics Market (by Region), $Million, 2023, 2028, and 2034
- Figure 3: Global Spatial Genomics and Transcriptomics Market (by Product Type), $Million, 2023, 2028, and 2034
- Figure 4: Global Spatial Genomics and Transcriptomics Market (by Workflow), $Million, 2023, 2028, and 2034
- Figure 5: Global Spatial Genomics and Transcriptomics Market (by Application), $Million, 2023, 2028, and 2034
- Figure 6: Number of Patents in Spatial Genomics and Transcriptomics Market (by Country), January 2021-December 2024
- Figure 7: Number of Patents in Spatial Genomics and Transcriptomics Market (by Year), January 2021-December 2024
- Figure 8: Supply Chain Analysis: Global Spatial Genomics and Transcriptomics Market
- Figure 9: Global Spatial Genomics and Transcriptomics Market, Value Chain Analysis
- Figure 10: Advances in Spatial Transcriptomics
- Figure 11: North America Spatial Genomics and Transcriptomics Market, $Million, 2022-2034
- Figure 12: U.S. Spatial Genomics and Transcriptomics Market, $Million, 2022-2034
- Figure 13: Canada Spatial Genomics and Transcriptomics Market, $Million, 2022-2034
- Figure 14: Europe Spatial Genomics and Transcriptomics Market, $Million, 2022-2034
- Figure 15: Germany Spatial Genomics and Transcriptomics Market, $Million, 2022-2034
- Figure 16: U.K. Spatial Genomics and Transcriptomics Market, $Million, 2022-2034
- Figure 17: France Spatial Genomics and Transcriptomics Market, $Million, 2022-2034
- Figure 18: Italy Spatial Genomics and Transcriptomics Market, $Million, 2022-2034
- Figure 19: Spain Spatial Genomics and Transcriptomics Market, $Million, 2022-2034
- Figure 20: Rest-of-Europe Spatial Genomics and Transcriptomics Market, $Million, 2022-2034
- Figure 21: Asia Pacific Spatial Genomics and Transcriptomics Market, $Million, 2022-2034
- Figure 22: China Spatial Genomics and Transcriptomics Market, $Million, 2022-2034
- Figure 23: Japan Spatial Genomics and Transcriptomics Market, $Million, 2022-2034
- Figure 24: India Spatial Genomics and Transcriptomics Market, $Million, 2022-2034
- Figure 25: Australia Spatial Genomics and Transcriptomics Market, 2022-2034
- Figure 26: Singapore Spatial Genomics and Transcriptomics Market, $Million, 2022-2034
- Figure 27: Rest-of-Asia-Pacific Spatial Genomics and Transcriptomics Market, $Million, 2022-2034
- Figure 28: Latin America Spatial Genomics and Transcriptomics Market, $Million, 2022-2034
- Figure 29: Brazil Spatial Genomics and Transcriptomics Market, $Million, 2022-2034
- Figure 30: Mexico Spatial Genomics and Transcriptomics Market, $Million, 2022-2034
- Figure 31: Rest-of-Latin America Spatial Genomics and Transcriptomics Market, $Million, 2022-2034
- Figure 32: Middle East and Africa Spatial Genomics and Transcriptomics Market, $Million, 2022-2034
- Figure 33: Synergistic Activities, January 2020- December 2024
- Figure 34: Funding and Expansion, January 2020-December 2024
- Figure 35: Product Launches (by Company), January 2021-September 2024
- Figure 36: Data Triangulation
- Figure 37: Top-Down and Bottom-Up Approach
- Figure 38: Assumptions and Limitations
List of Tables
- Table 1: Market Snapshot
- Table 2: Global Spatial Genomics and Transcriptomics Market Opportunities
- Table 3: Impact Analysis of Market Navigating Factors, 2022-2034
- Table 4: Recent Funding in Spatial Genomics and Transcriptomics Market
- Table 5: Cost Associated with Spatial Genomics and Transcriptomics Instruments
- Table 6: Global Spatial Genomics and Transcriptomics Market (by Product Type), $Million, 2022-2034
- Table 7: Global Spatial Genomics and Transcriptomics Market (by Kits and Assays), $Million, 2022-2034
- Table 8: Global Spatial Genomics and Transcriptomics Market (by Instruments), $Million, 2022-2034
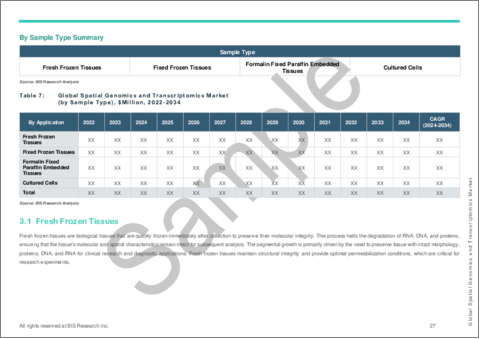
- Table 9: Global Spatial Genomics and Transcriptomics Market (by Sample Type), $Million, 2022-2034
- Table 10: Global Spatial Genomics and Transcriptomics Market (by Workflow), $Million, 2022-2034
- Table 11: Global Spatial Genomics and Transcriptomics Market (by Spatial Imaging), $Million, 2022-2034
- Table 12: Global Spatial Genomics and Transcriptomics Market (by Spatial Sequencing), $Million, 2022-2034
- Table 13: Global Spatial Genomics and Transcriptomics Market (by Spatial Analysis), $Million, 2022-2034
- Table 14: Global Spatial Genomics and Transcriptomics Market (by Application), $Million, 2022-2034
- Table 15: Global Spatial Genomics and Transcriptomics Market (by Diagnostic), $Million, 2022-2034
- Table 16: Global Spatial Genomics and Transcriptomics Market (by End User), $Million, 2022-2034
- Table 17: Mergers and Acquisitions (by Company), January 2020-December 2024
- Table 18: Funding Activities Share (by Company), January 2020-December 2024
Introduction of Spatial Genomics and Transcriptomics
The global spatial genomics and transcriptomics market, initially valued at $573.9 million in 2023, is set to witness substantial growth, projected to surge to $2,158.6 million by 2034, marking a remarkable compound annual growth rate (CAGR) of 12.54% over the period from 2024 to 2034. The market has been experiencing significant growth, primarily fuelled by the increasing use of spatial omics for drug discovery and development, advancements in sequencing technologies, increasing demand for high-resolution single-cell analysis, and the rising prevalence of complex diseases such as cancer and neurological disorders. Moreover, the increasing applications of spatial genomics in personalized medicine and precision oncology are expected to expand the market as researchers and clinicians seek more accurate insights into disease mechanisms at the molecular level.
Market Introduction
| KEY MARKET STATISTICS | |
|---|---|
| Forecast Period | 2024 - 2034 |
| 2024 Evaluation | $662.3 Million |
| 2034 Forecast | $2,158.6 Million |
| CAGR | 12.54% |
The global spatial genomics and transcriptomics market has been experiencing significant growth, fueled by growing investments in genomics research by government and private organizations and collaborations between biotech firms and academic institutions, and is accelerating the adoption of spatial analysis techniques. As investment in spatial transcriptomics continues to rise, the field is positioned for significant growth and transformative breakthroughs. The ongoing financial support will undoubtedly catalyze further advancements in spatial gene expression analysis, reinforcing its potential to reshape research paradigms and redefine the boundaries of precision medicine. For instance, in 2024, Moleculent AB secured $26 million in a Series A financing round led by ARCH Venture Partners and co-led by Eir Ventures. The company's innovative functional biology platform enables the detection and profiling of cell interactions directly within their native tissue environments. Therefore, such financial support supports technological innovations and expands spatial transcriptomics applications in various research domains.
Industrial Impact
The spatial genomics and transcriptomics market has significantly influenced the healthcare landscape, driven by key players such as 10x Genomics, Illumina, Inc., and Akoya Biosciences, Inc. These companies are at the forefront, providing cutting-edge platforms for spatially resolved genomic and transcriptomic profiling.
Moreover, the market has been further shaped by strategic collaborations, mergers, and R&D investments, which enable companies to expand their global presence and introduce innovative solutions. With the increasing focus on understanding tissue architecture and disease mechanisms, the competitive landscape of the spatial genomics and transcriptomics market is dynamic, with innovation and customer-centric approaches driving differentiation and growth.
Market Segmentation for Spatial Genomics and Transcriptomics Market:
Segmentation 1: by Product Type
- Kits and Assays
- Sample Preparation Kits
- Sample Enrichment Kits
- Instrument
- Slide Scanner
- Microscopy
- Mass Cytometry
- Software
- Services
Kits and Assays Segment to Dominate the Spatial Genomics and Transcriptomics Market (by Product Type)
Based on product type, the global spatial genomics and transcriptomics market was led by the kits and assays segment, which accounted for the largest share in 2023 and is expected to reach $1,116.2 million by 2034, registering a CAGR of 12.27% during the forecast period 2024-2034. This dominance can be attributed to their essential role in spatial analysis workflows, providing critical reagents and tools for sample preparation, staining, and detection. With applications spanning single-cell analysis, tissue profiling, and drug discovery, these products have become indispensable across research areas such as oncology, immunology, and neuroscience. Additionally, the services segment has gained traction, as many institutions and pharmaceutical companies increasingly rely on outsourcing services for customized analysis, data interpretation, and biomarker discovery. This combination of robust product offerings and expanding service capabilities is expected to propel the overall growth of the spatial genomics and transcriptomics market in the coming years.
Segmentation 2: by Sample Type
- Fresh Frozen Tissues
- Fixed Frozen Tissues
- Formalin Fixed Paraffin Embedded (FFPE) Tissues
- Cultured Cells
Fresh Frozen Tissues Segment to Dominate the Spatial Genomics and Transcriptomics Market (by Sample Type)
Based on sample type, the global spatial genomics and transcriptomics market was led by the fresh frozen tissues segment, which accounted for the largest share in 2023 and is expected to reach $1,131.8 million by 2034, registering a CAGR of 12.40% during the forecast period 2024-2034. Fresh frozen tissues are biological tissues that are frozen immediately after collection to preserve their molecular integrity. The segmental growth is primarily driven by the need to preserve tissue with intact morphology, proteins, DNA, and RNA for clinical research and diagnostic applications. Fresh frozen tissues maintain structural integrity and provide optimal permeabilization conditions, which are critical for research experiments. Leading companies such as 10x Genomics and Akoya Biosciences, Inc. offer advanced imaging technologies and solutions tailored for fresh frozen tissue types, further accelerating market expansion.
Segmentation 3: by Workflow
- Spatial Imaging
- Laser Capture Microdissection (LCM)
- Immunohistochemistry (IHC)
- Fluorescent In-Situ Hybridization (FISH)
- Microscopy
- Barcodes
- Other
- Spatial Sequencing
- Next-Generation Sequencing (NGS)
- In-Vivo Transcription
- Fluorescent In-Situ Sequencing (FISSEQ)
- Microtomy Sequencing
- Other
- Spatial Analysis
- Data Visualization Tools
- Data Analysis Tools
Spatial Imaging Segment to Dominate the Spatial Genomics and Transcriptomics Market (by Workflow)
Based on workflow, spatial imaging accounted for the largest share in 2023 and is expected to reach $1,095.7 million by 2034, registering a CAGR of 12.29% during the forecast period 2024-2034. Spatial imaging enables the exploration of the spatial organization of genetic material (DNA) and gene [removed]RNA) within their native tissue environment. The segment has experienced significant growth, driven by innovations in imaging technologies, mass cytometry, and mass spectrometry. Additionally, advancements in artificial intelligence (AI) and machine learning (ML) have further improved the accuracy and efficiency of image reconstruction, making real-time spatial imaging increasingly viable. By harnessing large datasets and adaptive learning algorithms, AI and ML address existing limitations, enhancing image processing and interpretation with greater precision and speed.
Segmentation 4: by Application
- Diagnostics
- Cancer Diagnostics
- Neurology Diagnostics
- Immunology Diagnostics
- Other Diagnostics
- Translation Research
- Drug Discovery and Development
- Single Cell Analysis
- Cell Biology
- Other
Drug Discovery and Development Segment to Dominate the Spatial Genomics and Transcriptomics Market (by Application)
Based on application, the drug discovery and development segment accounted for the largest share in 2023 and is expected to reach $688.4 million by 2034, registering a CAGR of 12.47% during the forecast period 2024-2034. The segment is majorly driven by the adoption of spatial technologies in identifying novel drug targets, understanding disease pathways, and optimizing preclinical studies through spatial insights into tissue microenvironments. Further, the growth of the market can be attributed to the high throughput techniques required for the discovery of therapeutic targets for drug development. Moreover, the advent of spatial biology, including gene expression microarray and high-throughput RNA-sequencing in clinical and drug research, has also furthered the market's growth.
Segmentation 5: by End User
- Academic Institutes and Research Institutes
- Biopharmaceutical and Biotechnology Companies
- Contract Research Organization
- Others
Academic Institutes and Research Institutes Segment to Dominate the Spatial Genomics and Transcriptomics Market (by End User)
Based on end user, academic institutes and research institutes accounted for the largest share in 2023 and are expected to reach $925.4 million by 2034, registering a CAGR of 12.47% during the forecast period 2024-2034. Academic and research institutions are among the primary end users of the spatial genomics and transcriptomics market. Research organizations constitute integral facilities for companies as well as independent academic research facilities. In the research laboratories, potential biomarkers are identified, and drugs are developed while acquiring targets through spatial analysis. In addition to this, research organizations are also responsible for exploring new opportunities for advancing gene expression analysis and capabilities.
Segmentation :6 by Region
- North America
- U.S.
- Canada
- Europe
- Germany
- U.K.
- France
- Italy
- Spain
- Rest-of-Europe
- Asia-Pacific
- China
- Japan
- India
- Australia
- Singapore
- Rest-of-Asia-Pacific
- Latin America
- Brazil
- Mexico
- Rest-of-Latin America
- Middle East and Africa
In the spatial genomics and transcriptomics market in 2023, the North America region dominated the global market, and it is expected to hold its dominance throughout the forecast period 2024-2034. This can be attributed to several key factors, including various technological innovations, drug discovery, and increasing research activities. In North America, several established spatial biology companies are focusing on expanding their portfolio in spatial genomics and transcriptomics instruments and kits. They are collaborating with service providers and pharmaceutical giants to co-market sequencing solutions with their complementary precision medicine solutions. Moreover, the availability of investors and venture capitalists capable of investing in the development of precision drugs and providing funds to start-ups in spatial biology has been furthering the market's growth.
Recent Developments in the Spatial Genomics and Transcriptomics Market
- In July 2024, Illumina, Inc. announced the acquisition of Fluent BioSciences, a developer of innovative single-cell analysis technology. Fluent BioSciences has developed a unique single-cell analysis technology that eliminates the need for complex and expensive instrumentation and microfluidic consumables. This acquisition aligns with Illumina's broader strategy to advance its multiomics capabilities, particularly in single-cell research.
- In May 2024, 10x Genomics launched a 5,000-plex gene panel for its Xenium platform, enabling researchers to analyze thousands of genes simultaneously in situ. The expanded gene panel offers unprecedented depth and detail, accelerating discoveries in tissue biology and disease mechanisms.
- In January 2024, Akoya Biosciences, Inc. and Thermo Fisher Scientific announced a license and distribution agreement to deliver a spatial multiomics workflow. This collaboration combines Thermo Fisher's ViewRNA technology with Akoya's spatial biology solutions, enabling rapid, whole-slide imaging of RNA and protein biomarkers.
Demand - Drivers, Challenges, and Opportunities
Market Drivers:
Increasing Use of Spatial Omics for Drug Discovery and Development: The field of drug discovery and development is undergoing a transformative shift with the growing integration of spatial omics technologies, which are enabling a deeper and more accurate understanding of disease biology, therapeutic targets, and biomarkers of disease and therapeutic response. Traditional drug development heavily relied on bulk tissue samples, which often provided limited insights due to their inability to capture the heterogeneous nature of disease pathology. With the advent of spatial omics, including techniques such as digital spatial profiling (DSP), research scientists can now perform high-resolution, in situ analysis of RNA, DNA, and protein expression, offering unprecedented spatial context to the molecular landscape of disease tissues.
Market Challenges:
Lack of Skilled Professionals: A significant restraint in adopting and expanding spatial genomics and transcriptomics technologies is the lack of a skilled workforce. Clinical genomics laboratories, critical for implementing these advanced techniques, are already facing acute staff shortages, particularly in the U.S. As per an article titled ' Exploring current challenges in the technologist workforce of clinical genomics laboratories,' published in 2023, while medical technologists play a vital role in laboratory operations, the specialized nature of spatial genomics and transcriptomics demands expertise in both molecular biology and bioinformatics. This dual proficiency is not commonly available, further exacerbating workforce challenges.
Market Opportunities:
Integration of Artificial Intelligence in Spatial Genomics and Transcriptomics: The spatial genomics and transcriptomics market presents a significant opportunity driven by advancements in computational tools designed to enhance and impute spatial gene expression. These tools, leveraging cutting-edge artificial intelligence (AI) and deep learning technologies, are transforming data resolution and accuracy, addressing critical technical challenges in spatial transcriptomics (ST) analysis.
How can this report add value to an organization?
Product/Innovation Strategy: The global spatial genomics and transcriptomics market has been extensively segmented based on various categories, such as product type, sample type, workflow, application, end user, and region.
Growth/Marketing Strategy: Mergers, acquisitions, and product launches accounted for the maximum number of key developments.
Competitive Strategy: The global spatial genomics and transcriptomics market has numerous established players with product portfolios. Key players in the global spatial genomics and transcriptomics market analyzed and profiled in the study involve established players offering products for spatial genomics and transcriptomics.
Methodology
Key Considerations and Assumptions in Market Engineering and Validation
- The base year considered for the calculation of the market size is 2023. A historical year analysis has been done for the period FY2020-FY2022. The market size has been estimated for FY2023 and projected for the period FY2024-FY2034.
- The scope of this report has been carefully derived based on interactions with experts in different companies across the world. This report provides a market study of upstream and downstream products of the spatial genomics and transcriptomics market.
- The market size was estimated and validated using both bottom-up and top-down analyses. The market size for each product type and end user was estimated for the bottom-up approach. These were further added to cumulate the global spatial genomics and transcriptomics market size.
- The top-down analysis was conducted to determine the market contributions of various segments defined in the scope.
- The market has been mapped based on the available spatial genomics and transcriptomics. This report has considered and profiled all the key companies with significant offerings in this field.
- The base currency considered for the market analysis is US$. Currencies other than the US$ have been converted to the US$ for all statistical calculations, considering the average conversion rate for that particular year.
Primary Research:
The primary sources involve industry experts in spatial genomics and transcriptomics, including the market players offering products and services. Resources such as CEOs, vice presidents, marketing directors, and technology and innovation directors have been interviewed to obtain and verify both qualitative and quantitative aspects of this research study.
The key data points taken from the primary sources include:
- validation and triangulation of all the numbers and graphs
- validation of the report's segmentation and key qualitative findings
- understanding the competitive landscape and business model
- current and proposed production values of a product by market players
- validation of the numbers of the different segments of the market in focus
- percentage split of individual markets for regional analysis
Secondary Research
Open Sources
- Certified publications, articles from recognized authors, white papers, directories, and major databases, among others
- Annual reports, SEC filings, and investor presentations of the leading market players
- Company websites and detailed study of their product portfolio
- Gold standard magazines, journals, white papers, press releases, and news articles
- Paid databases
The key data points taken from the secondary sources include:
- segmentations and percentage shares
- data for market value
- key industry trends of the top players of the market
- qualitative insights into various aspects of the market, key trends, and emerging areas of innovation
- quantitative data for mathematical and statistical calculations
Key Market Players and Competition Synopsis
The companies profiled have been selected based on inputs gathered from primary experts, who have analyzed company coverage, product portfolio, and market penetration.
Some prominent names established in this market are:
- 10x Genomics.
- Bruker Corporation
- Akoya Biosciences, Inc
- Bio-Techne.
Table of Contents
Executive Summary
Scope and Definition
1 Global Spatial Genomics and Transcriptomics Market: Overview
- 1.1 Market Overview
- 1.2 Regulatory Framework
- 1.2.1 U.S.
- 1.2.1.1 Regulatory Requirements for Products Intended as Medical Devices
- 1.2.1.2 Regulatory Requirements for Research Use Only (RUO) Products
- 1.2.2 European Union (EU)
- 1.2.2.1 Regulatory Requirements for Products Intended as Medical Devices
- 1.2.2.1.1 EU Medical Device Regulation
- 1.2.2.1.2 EU In Vitro Diagnostic Regulation
- 1.2.2.2 Regulatory Requirements for Sequencing Labs in the EU
- 1.2.2.1 Regulatory Requirements for Products Intended as Medical Devices
- 1.2.3 Japan
- 1.2.3.1 Regulatory Requirements for Products Intended as Medical Devices
- 1.2.3.2 Regulatory Requirements in Japan
- 1.2.4 China
- 1.2.4.1 Regulatory Requirements for Products Intended as Medical Devices
- 1.2.1 U.S.
- 1.3 Patent Analysis
- 1.3.1 Patent Filing Trend (by Country)
- 1.3.2 Patent Filing Trend (by Year)
- 1.3.3 Global Spatial Genomics and Transcriptomics Market, Supply Chain Analysis
- 1.3.4 Global Spatial Genomics and Transcriptomics Market, Value Chain Analysis
- 1.4 Market Dynamics Overview
- 1.4.1 Market Drivers
- 1.4.1.1 Increasing Use of Spatial Omics for Drug Discovery and Development
- 1.4.1.2 Technological Advancements in Sequencing
- 1.4.1.3 Increasing Research Funding in Spatial Transcriptomics
- 1.4.2 Market Restraints
- 1.4.2.1 High Capital Requirement Hampering the Global Reach
- 1.4.2.2 Lack of Skilled Professionals
- 1.4.3 Market Opportunities
- 1.4.3.1 Integration of Artificial Intelligence in Spatial Genomics and Transcriptomics
- 1.4.1 Market Drivers
2 Global Spatial Genomics and Transcriptomics Market (by Product), $Million, 2022-2034
- 2.1 Kits and Assays
- 2.1.1 Sample Preparation Kits
- 2.1.2 Sample Enrichment Kits
- 2.2 Instrument
- 2.2.1 Slide Scanner
- 2.2.2 Microscopy
- 2.2.3 Mass Cytometry
- 2.3 Software
- 2.4 Services
3 Global Spatial Genomics and Transcriptomics Market (by Sample Type), $Million, 2022-2034
- 3.1 Fresh Frozen Tissues
- 3.2 Fixed Frozen Tissues
- 3.3 Formalin Fixed Paraffin Embedded (FFPE) Tissues
- 3.4 Cultured Cells
4 Global Spatial Genomics and Transcriptomics Market (by Workflow), $Million, 2022-2034
- 4.1 Spatial Imaging
- 4.1.1 Laser Capture Microdissection (LCM)
- 4.1.2 Immunohistochemistry (IHC)
- 4.1.3 Fluorescent In-Situ Hybridization (FISH) Cultured Cell
- 4.1.4 Microscopy
- 4.1.5 Barcodes
- 4.1.6 Other
- 4.2 Spatial Sequencing
- 4.2.1 Next-Generation Sequencing (NGS)
- 4.2.2 In-Vivo Transcription
- 4.2.3 Fluorescent In-Situ Sequencing (FISSEQ)
- 4.2.4 Microtomy Sequencing
- 4.2.5 Others
- 4.3 Spatial Analysis
- 4.3.1 Data Visualization Tools
- 4.3.2 Data Analysis Tools
5 Global Spatial Genomics and Transcriptomics Market (by Application), $Million, 2022-2034
- 5.1 Diagnostics
- 5.1.1 Cancer Diagnostics
- 5.1.2 Neurology Diagnostics
- 5.1.3 Immunology Diagnostics
- 5.1.4 Other Diagnostics
- 5.2 Drug Discovery and Development
- 5.3 Translational Research
- 5.4 Single Cell Analysis
- 5.5 Cell Biology
- 5.6 Other
6 Global Spatial Genomics and Transcriptomics Market (by End User), $Million, 2022-2034
- 6.1 Academic Institutes and Research Institutes
- 6.2 Biopharmaceutical and Biotechnology Companies
- 6.3 Contract Research Organization
- 6.4 Other End Users
7 Global Spatial Genomics and Transcriptomics Market (By Region), $Million, 2022-2034
- 7.1 North America
- 7.1.1 Regional Overview
- 7.1.2 Driving Factors for Market Growth
- 7.1.3 Factors Challenging the Market
- 7.1.3.1 U.S.
- 7.1.3.2 Canada
- 7.2 Europe
- 7.2.1 Regional Overview
- 7.2.2 Driving Factors for Market Growth
- 7.2.3 Factors Challenging the Market
- 7.2.3.1 Germany
- 7.2.3.2 U.K.
- 7.2.3.3 France
- 7.2.3.4 Italy
- 7.2.3.5 Spain
- 7.2.3.6 Rest-of-Europe
- 7.3 Asia-Pacific
- 7.3.1 Regional Overview
- 7.3.2 Driving Factors for Market Growth
- 7.3.3 Factors Challenging the Market
- 7.3.3.1 China
- 7.3.3.2 Japan
- 7.3.3.3 India
- 7.3.3.4 Australia
- 7.3.3.5 Singapore
- 7.3.3.6 Rest-of-Asia-Pacific
- 7.4 Latin America
- 7.4.1 Regional Overview
- 7.4.2 Driving Factors for Market Growth
- 7.4.3 Factors Challenging the Market
- 7.4.3.1 Brazil
- 7.4.3.2 Mexico
- 7.4.3.3 Rest-of-Latin America
- 7.5 Middle East and Africa
- 7.5.1 Regional Overview
- 7.5.2 Driving Factors for Market Growth
- 7.5.3 Factors Challenging the Market
8 Competitive Insights and Company Profiles
- 8.1 Key Strategies and Development
- 8.1.1 Synergistic Activities
- 8.1.2 Funding and Expansion
- 8.1.3 Mergers and Acquisitions
- 8.1.4 Funding Activities
- 8.1.5 Service/Product Launches
- 8.2 Company Profiles
- 8.2.1 10x Genomics.
- 8.2.1.1 Overview
- 8.2.1.2 Top Products
- 8.2.1.3 Top Competitors
- 8.2.1.4 Target Customers/End Users
- 8.2.1.5 Analyst View
- 8.2.2 Akoya Biosciences, Inc.
- 8.2.2.1 Overview
- 8.2.2.2 Top Products
- 8.2.2.3 Top Competitors
- 8.2.2.4 Target Customers/End Users
- 8.2.2.5 Analyst View
- 8.2.3 Bruker Corporation
- 8.2.3.1 Overview
- 8.2.3.2 Top Products
- 8.2.3.3 Top Competitors
- 8.2.3.4 Target Customers/End Users
- 8.2.3.5 Analyst View
- 8.2.4 Bio-Techne.
- 8.2.4.1 Overview
- 8.2.4.2 Products Offered
- 8.2.4.3 Top Competitors
- 8.2.4.4 Target Customers/End Users
- 8.2.4.5 Analyst View
- 8.2.5 BioSpyder, Inc.
- 8.2.5.1 Overview
- 8.2.5.2 Top Products
- 8.2.5.3 Top Competitors
- 8.2.5.4 Target Customers/End Users
- 8.2.5.5 Analyst View
- 8.2.6 Flagship Biosciences, Inc.
- 8.2.6.1 Overview
- 8.2.6.2 Products Offered
- 8.2.6.3 Top Competitors
- 8.2.6.4 Target Customers/End Users
- 8.2.6.5 Analyst View
- 8.2.7 Illumina, Inc.
- 8.2.7.1 Overview
- 8.2.7.2 Top Products
- 8.2.7.3 Top Competitors
- 8.2.7.4 Target Customers/End Users
- 8.2.7.5 Analyst View
- 8.2.8 Miltenyi Biotec
- 8.2.8.1 Overview
- 8.2.8.2 Products Offered
- 8.2.8.3 Top Competitors
- 8.2.8.4 Target Customers/End Users
- 8.2.8.5 Analyst View
- 8.2.9 MGI Tech Co., Ltd.
- 8.2.9.1 Overview
- 8.2.9.2 Top Products
- 8.2.9.3 Top Competitors
- 8.2.9.4 Target Customers/End Users
- 8.2.9.5 Analyst View
- 8.2.10 RareCyte, Inc.
- 8.2.10.1 Overview
- 8.2.10.2 Products Offered
- 8.2.10.3 Top Competitors
- 8.2.10.4 Target Customers/End Users
- 8.2.10.5 Analyst View
- 8.2.11 Revvity, Inc.
- 8.2.11.1 Overview
- 8.2.11.2 Top Products and Services
- 8.2.11.3 Top Competitors
- 8.2.11.4 Analyst View
- 8.2.12 S2 Genomics, Inc.
- 8.2.12.1 Overview
- 8.2.12.2 Top Products
- 8.2.12.3 Top Competitors
- 8.2.12.4 Target Customers/End Users
- 8.2.12.5 Analyst View
- 8.2.13 Standard BioTools
- 8.2.13.1 Overview
- 8.2.13.2 Product Offered
- 8.2.13.3 Top Competitors
- 8.2.13.4 Target Customers/End Users
- 8.2.13.5 Analyst View
- 8.2.14 TissueGnostics GmbH
- 8.2.14.1 Overview
- 8.2.14.2 Top Products
- 8.2.14.3 Top Competitors
- 8.2.14.4 Target Customers/End Users
- 8.2.14.5 Analyst View
- 8.2.15 Vizgen Inc.
- 8.2.15.1 Overview
- 8.2.15.2 Services Offered
- 8.2.15.3 Top Competitors
- 8.2.15.4 Target Customers/End Users
- 8.2.15.5 Analyst View
- 8.2.1 10x Genomics.
9 Research Methodology
- 9.1 Data Sources
- 9.1.1 Primary Data Sources
- 9.1.2 Secondary Data Sources
- 9.1.3 Data Triangulation
- 9.2 Market Estimation and Forecast
