|
|
市場調査レポート
商品コード
1566312
EUのグリーンディール - 欧州/他国へのスマート農業市場への影響分析 - 世界および地域別分析:貿易への影響、持続可能な開発目標、国別分析 (2020~2024年)EU Green Deal - Impact Analysis on Europe/Other Countries Smart Agriculture Market - A Regional and Global Analysis: Focus on Trade Impact, Sustainable Development Goals, and Country - Analysis, 2020-2024 |
||||||
|
|||||||
カスタマイズ可能
|
|||||||

| EUのグリーンディール - 欧州/他国へのスマート農業市場への影響分析 - 世界および地域別分析:貿易への影響、持続可能な開発目標、国別分析 (2020~2024年) |
|
出版日: 2024年10月09日
発行: BIS Research
ページ情報: 英文 99 Pages
納期: 1~5営業日
|

全表示
- 概要
- 図表
- 目次
スマート農業の市場は、EUのグリーンディールや、持続可能で回復力のある農法の必要性を強調する世界の気候変動対策に後押しされ、大きな成長を遂げようとしています。
精密農業、IoT、ドローン、AIなどの先進技術を統合することで、スマート農業は環境への影響を最小限に抑えながら生産性と効率を高めます。この市場は、温室効果ガス排出量の削減と生物多様性の損失の回復というEUの目標を支える上で極めて重要です。スマート農業は、資源利用を最適化するだけでなく、水効率の高い灌漑、家畜管理の改善、耐気候性作物の採用を通じて、気候変動への耐性を促進します。収量を向上させ、持続可能な農法を推進することで、食糧・栄養不安に対処する上で重要な役割を果たしています。世界銀行などの機関による投資の増加は、世界の農業食糧システムを変革し、気候変動目標に合致させ、経済成長と農村開発を促進する上で、この分野が非常に重要であることを示しています。
EUのグリーンディールの実施は、スマート農業市場に大きな影響を与え、大幅な産業成長とイノベーションを促進しています。持続可能性と気候変動への耐性が優先されるグリーンディールは、精密農業、IoT、AIを含む先進農業技術への強い需要を生み出しています。この持続可能な実践への移行は、生産性を高め、環境への影響を低減し、資源効率を改善するスマート農業ソリューションの採用を加速させています。こうした技術の開発と展開に携わる業界は、投資拡大と市場拡大を経験する可能性が高いです。また、温室効果ガス排出量の削減と生物多様性の推進に重点を置くグリーンディールは、スマート農業をこれらの目標を達成するための重要なセクターとして位置付けています。そのため、この市場では、研究、開発、気候変動に対応した農法の導入が活発化し、経済成長と、より持続可能な農業への移行が世界中で促進されると予想されています。
当レポートでは、世界のスマート農業市場とEUのグリーンディールの影響を調査し、EUのグリーンディールの概要、それらがもたらす課題と機会、スマート農業の主要国別の分析などをまとめています。
対象国
- 米国
- カナダ
- メキシコ
- ブラジル
- チリ
- ペルー
- 南アフリカ
- サウジアラビア
- U.A.E.
- エジプト
- トルコ
- イスラエル
- 韓国
- ベトナム
- 中国
- 日本
- シンガポール
- オーストラリア
- ニュージーランド
主要企業:
- Bayer Crop Sciences
- Nestle S.A.
- Yara
- BASF SE
- Trimble Inc.
目次
エグゼクティブサマリー
第1章 市場
- EUのグリーンディールの概要
- 概要
- 市場の定義
- 農場から食卓までの戦略:行動計画
- 欧州連合の食糧生産:自給率の分析
- ダイナミクス
- 農業のためのグリーンディール:2030年に向けた目標
- 高い持続可能性基準が世界貿易に与える影響
- EUのグリーンディールがEUにおける農薬使用に与える影響
- 農業におけるEUのグリーンディールの実施に向けた企業シナリオ
- EUのグリーンディールの実施に関する分析
- 有機情勢への影響
- 温室効果ガス排出への影響:農業部門別
- 持続可能な開発目標が欧州に与える影響
- EU
- 非EU地域
- 収益性分析:さまざまな農場規模におけるスマート農業の導入
- 大規模農場におけるデジタル技術の導入
- 中規模農場におけるデジタル技術の導入
- 小規模農場におけるデジタル技術の導入
- 農場全体の収益性分析
第2章 国
- EUから農産物や資材を輸入している国:影響分析
- 米国
- カナダ
- メキシコ
- ブラジル
- チリ
- ペルー
- 南アフリカ
- サウジアラビア
- UAE
- エジプト
- トルコ
- イスラエル
- 韓国
- ベトナム
- 中国
- 日本
- シンガポール
- オーストラリア
- ニュージーランド
- 総論・提言
- 推奨事項
- EUのグリーンディールの将来のロードマップ
第3章 調査手法
List of Figures
- Figure 1: Age Groups of Agriculture Labors and Farm Managers in Europe, 2020
- Figure 2: Benefits for Smart Agriculture Companies if EU Green Deal is Implemented on a Larger Scale
- Figure 3: Amount of Pesticide Used if EU Green Deal is Implemented on a Larger Scale, Million Kilograms, 2020-2030
- Figure 4: EU SDG Index Score, 2020-2023
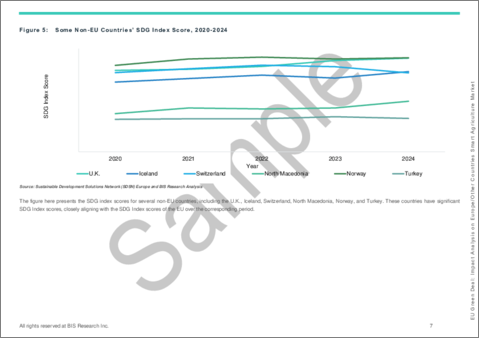
- Figure 5: Some Non-EU Countries' SDG Index Score, 2020-2024
- Figure 6: EU Green Deal: Impact Analysis on Europe/Other Countries Smart Agriculture Market Coverage
- Figure 7: Elements of the EU Green Deal
- Figure 8: Goals of the EU Green Deal in the Agriculture Sector
- Figure 9: EU's Farm-to-Fork Strategy
- Figure 10: EU Per Capita Meat Consumption, Kilograms, 2011-2031
- Figure 11: EU Self-Sufficiency Rates for Animal Products (2020-2022 Average) and Fish (2020-2021 Average)
- Figure 12: EU Self-Sufficiency Rate for Plant Products (2020-2022 Average)
- Figure 13: EU Self-Sufficiency Rates for Fruits and Vegetables (2020-2022 Average)
- Figure 14: Status of the EU Green Deal 2030 Targets for Agriculture, 2023
- Figure 15: Pesticides Used in the Agriculture in the EU, Tons, 2022
- Figure 16: Amount of Pesticide Used if EU Green Deal is Implemented, Million Kilograms, 2020-2030
- Figure 17: Agricultural Production in the EU, Million Tons, 2020-2022
- Figure 18: European Union SDG Index Score, 2019-2023
- Figure 19: Some Non-European Union Countries' SDG Index Score, 2023
- Figure 20: Total Agricultural Area Dedicated to Organic Farming in the EU (by Country), Thousand Hectares, 2022
- Figure 21: Benefits of Agri-Voltaics
- Figure 22: Ways to Implement Circular Economy in the EU
- Figure 23: Future Roadmap for EU Green Deal Implementation
- Figure 24: Data Triangulation
List of Tables
- Table 1: Timeline of EU Green Deal, 2020-2024
- Table 2: Factors Considered in the Green Deal Impact Analysis Studies on Agriculture, February 2022
- Table 3: Global Trade Impact of Various Farm-to-Fork Strategy Targets, 2022
- Table 4: Companies Implementing EU Green Deal in Agriculture
- Table 5: Dedicated Organic Farming Area in EU, 2020 and 2023
- Table 6: Actual and Projected EU Agricultural Emissions 2005-2030
- Table 7: SDG Index Scores and Rankings in the EU (by Country), 2024
- Table 8: Main Categories of Farm Sizes
- Table 9: Smart Farming Application Adoption (by Farm Segment)
- Table 10: Profitability Analysis for Maize Cultivation across Different Farm Sizes in Bangladesh, 2020
- Table 11: Agricultural Trade Agreements between the EU and the U.S.
- Table 12: Challenges and Opportunities for Smart Farming Service Providers in the U.S.
- Table 13: Agricultural Trade Agreements between the EU and Canada
- Table 14: Challenges and Opportunities for Smart Farming Service Providers in Canada
- Table 15: Agricultural Trade Agreements between the EU and Mexico
- Table 16: Challenges and Opportunities for Smart Farming Service Providers in Mexico
- Table 17: Challenges and Opportunities for Smart Farming Service Providers in Brazil
- Table 18: Challenges and Opportunities for Smart Farming Service Providers in Chile
- Table 19: Challenges and Opportunities for Smart Farming Service Providers in Peru
- Table 20: Agricultural Trade Agreements between the EU and South Africa
- Table 21: Challenges and Opportunities for Smart Farming Service Providers in South Africa
- Table 22: Challenges and Opportunities for Smart Farming Service Providers in Saudi Arabia
- Table 23: Challenges and Opportunities for Smart Farming Service Providers in the U.A.E
- Table 24: Agricultural Trade Agreements between the EU and Egypt
- Table 25: Challenges and Opportunities for Smart Farming Service Providers in Egypt
- Table 26: Challenges and Opportunities for Smart Farming Service Providers in Turkey
- Table 27: Challenges and Opportunities for Smart Farming Service Providers in Israel
- Table 28: Challenges and Opportunities for Smart Farming Service Providers in South Korea
- Table 29: Challenges and Opportunities for Smart Farming Service Providers in Vietnam
- Table 30: Challenges and Opportunities for Smart Farming Service Providers in China
- Table 31: Challenges and Opportunities for Smart Farming Service Providers in Japan
- Table 32: Agricultural Trade Agreements between the EU and Singapore
- Table 33: Challenges and Opportunities for Smart Farming Service Providers in Singapore
- Table 34: Challenges and Opportunities for Smart Farming Service Providers in Australia
- Table 35: Challenges and Opportunities for Smart Farming Service Providers in New Zealand
Introduction to the EU Green Deal
The European Union's Green Deal is a bold initiative aimed at achieving a climate-neutral and sustainable Europe by 2050. Central to this vision are the Farm-to-Fork (F2F) and Biodiversity strategies, which seek to create a food system that benefits the environment, enhances food security, and ensures fair economic returns. Key targets include reducing greenhouse gas emissions by 55%, cutting chemical pesticide use by 50%, and increasing organic farming to 25% of agricultural land by 2030. The EU is also integrating sustainability into its trade policies, introducing mirror clauses that require imported agricultural products to meet EU production standards. While these measures could impact low-income developing countries, the EU is committed to balancing its internal goals with global sustainable development, ensuring its leadership in promoting sustainable practices worldwide.
Market Introduction
The smart agriculture market is poised for significant growth, driven by the European Union Green Deal and global climate initiatives that emphasize the need for sustainable and resilient farming practices. By integrating advanced technologies such as precision farming, IoT, drones, and AI, smart agriculture enhances productivity and efficiency while minimizing environmental impact. This market is critical in supporting the EU's goals of reducing greenhouse gas emissions and reversing biodiversity loss. Smart agriculture not only optimizes resource use but also promotes climate resilience through water-efficient irrigation, improved livestock management, and the adoption of climate-resistant crops. It plays a vital role in addressing food and nutrition insecurity by improving yields and promoting sustainable farming practices. The increasing investment by entities such as the World Bank underscores the sector's importance in transforming the global agrifood system, aligning with climate goals, and fostering economic growth and rural development.
Industrial Impact
The implementation of the EU Green Deal is set to impact the smart agriculture market significantly, driving substantial industrial growth and innovation. By prioritizing sustainability and climate resilience, the Green Deal creates a strong demand for advanced agricultural technologies, including precision farming, IoT, and AI. This shift toward sustainable practices accelerates the adoption of smart agriculture solutions that enhance productivity, reduce environmental impact, and improve resource efficiency. Industries involved in the development and deployment of these technologies are likely to experience increased investment and market expansion. Furthermore, the Green Deal's emphasis on reducing greenhouse gas emissions and promoting biodiversity positions smart agriculture as a key sector in achieving these goals. As a result, the market is expected to see heightened activity in research, development, and the implementation of climate-smart practices, driving both economic growth and the transition to a more sustainable agricultural industry across the globe.
Countries Considered:
- U.S.
- Canada
- Mexico
- Brazil
- Chile
- Peru
- South Africa
- Saudi Arabia
- U.A.E.
- Egypt
- Turkey
- Israel
- South Korea
- Vietnam
- China
- Japan
- Singapore
- Australia
- New Zealand
Recent developments of the EU Green Deal:
- In January 2024, Trimble launched the Connected Climate Exchange, a groundbreaking carbon marketplace designed to support the European Union's Green Deal by advancing sustainability in the agriculture sector. This platform bridges the gap between farmers, agronomists, and businesses, facilitating the aggregation and verification of data across the agricultural supply chain. By integrating with existing farm management tools, Trimble ensures that sustainability efforts are both scalable and measurable, thereby contributing significantly to the EU's broader goals of achieving climate neutrality by 2050.
- In November 2023, the EU and Canada established a Green Alliance to strengthen cooperation on climate action, environmental protection, and green technology. This partnership will accelerate the adoption of climate-resilient practices, nature-based solutions, and innovative technologies in Canada, enhancing agricultural sustainability.
- In April 2023, the World Bank approved a $345 million loan to support China's Green Agricultural and Rural Revitalization Program, enhancing sustainability in Hubei and Hunan provinces, alongside a US$4.1 billion commitment from the Chinese government.
How can this report add value to an organization?
Innovation Strategy: This offers insights into various methods and practices that align with the EU Green Deal's sustainability objectives. By gaining a comprehensive understanding of the smart agriculture market and evaluating the challenges and opportunities presented by the EU Green Deal, stakeholders in the leading countries importing agricultural goods from the EU can assess the potential impact on their respective nations and organizations.
Growth/Marketing Strategy: The smart agriculture market has witnessed significant advancements driven by key players through product launches, innovations, business expansions, and strategic collaborations. Companies are increasingly forming partnerships, collaborations, and joint ventures with major EU-based firms to meet EU standards, expand their operations, and reach a wider customer base. For instance, in April 2023, the Swiss company PLNTZ announced the cultivation of 15 hectares of EU-certified hemp varieties in Austria, aimed at extracting flowers, CBD, and other fibers.
Competitive Strategy: The report provides an analysis and profiling of key countries within the smart agriculture market that import agricultural products from the EU. Additionally, it thoroughly examines the challenges and opportunities in these countries, enabling readers to understand how market players compare, thereby presenting a clear view of the competitive landscape.
Research Methodology
Factors
- The scope of this report focuses on the EU Green Deal and its implementation in Europe and other countries' smart agriculture markets.
- The base currency considered for the market analysis is US$. Currencies other than the US$ have been converted to the US$ for all statistical calculations, considering the average conversion rate for that particular year.
- The currency conversion rate has been taken from the historical exchange rate of the FxTop website.
- Nearly all the recent developments from January 2021 to August 2024 have been considered in this research study.
- The information rendered in the report is a result of in-depth primary interviews, surveys, and secondary analysis.
- Where relevant information was not available, proxy indicators and extrapolation were employed.
- Technologies currently used are expected to persist, with no major breakthroughs.
Secondary Research
This research study of the EU Green Deal involves extensive secondary research, directories, company websites, and annual reports. It also makes use of databases, such as ITU, Hoovers, Bloomberg, Businessweek, and Factiva, to collect useful and effective information for an extensive, technical, market-oriented study.
Some of the prominent names in this market are:
- Bayer Crop Sciences
- Nestle S.A.
- Yara
- BASF SE
- Trimble Inc.
Table of Contents
Executive Summary
1 Markets
- 1.1 EU Green Deal Overview
- 1.1.1 European Union Green Deal: An Introduction
- 1.1.2 Market Definition
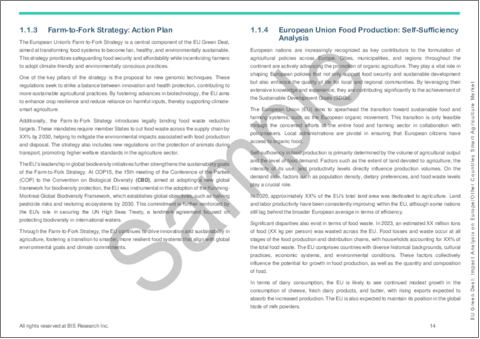
- 1.1.3 Farm-to-Fork Strategy: Action Plan
- 1.1.3.1 Building a Food Chain that Benefits Consumers, Producers, Climate, and the Environment
- 1.1.3.1.1 Sustainable Food Production
- 1.1.3.1.1.1 New Business Model
- 1.1.3.1.1.2 Integrated Pest Management (IPM)
- 1.1.3.1.1.3 Nutrient Losses
- 1.1.3.1.1.4 Antimicrobial Resistance (AMR)
- 1.1.3.1.1.5 Organic Food Market
- 1.1.3.1.1.6 Eco-Schemes
- 1.1.3.1.1.7 Sustainable Fish and Seafood Cultivation
- 1.1.3.1.2 Ensuring Food Security
- 1.1.3.1.3 Encouraging Sustainable Food Processing, Retail, Wholesale, and Hospitality Services
- 1.1.3.1.4 Fostering Transition to a Sustainable Diet and Encouraging the Consumption of Sustainable Food
- 1.1.3.1.5 Minimizing Food Loss and Waste
- 1.1.3.1.6 Preventing Food Fraud along the Food Supply Chain
- 1.1.3.1.1 Sustainable Food Production
- 1.1.3.2 Making the Transition Possible
- 1.1.3.2.1 Investments, Technology, Research, and Innovation
- 1.1.3.2.2 Consultancy Services, Knowledge Exchange, and Skills
- 1.1.3.3 Promoting the Transition Globally
- 1.1.3.1 Building a Food Chain that Benefits Consumers, Producers, Climate, and the Environment
- 1.1.4 European Union Food Production: Self-Sufficiency Analysis
- 1.1.4.1 High Self-Sufficiency in Animal Products
- 1.1.4.2 Varying Self-Sufficiency in Arable Crops
- 1.1.4.3 Self-Sufficiency in Fruit and Vegetables
- 1.2 Dynamics
- 1.2.1 Green Deal for Agriculture: Targets for 2030
- 1.2.1.1 Research Studies by Agriculture Institutions
- 1.2.2 Global Trade Impacts of High Sustainability Standards
- 1.2.3 Impact of EU Green Deal on Pesticide Usage in the EU
- 1.2.4 Corporate Scenario for the Implementation of the EU Green Deal in Agriculture
- 1.2.4.1 Companies Implementing EU Green Deal Policies
- 1.2.4.2 Investment Landscape for the Implementation of the EU Green Deal
- 1.2.1 Green Deal for Agriculture: Targets for 2030
- 1.3 Implementation Analysis of EU Green Deal
- 1.3.1 Impact on Organic Farming Landscape
- 1.3.2 Impact on GHG Emissions by the Agriculture Sector
- 1.4 Impact of Sustainable Development Goals in Europe
- 1.4.1 European Union
- 1.4.1.1 Role of Smart Farming Service Providers in the EU
- 1.4.2 Non-EU Regions
- 1.4.2.1 Role of Smart Farming Service Providers in the Non-EU Countries
- 1.4.1 European Union
- 1.5 Profitability Analysis: Smart Farming Adoption across Different Farm Sizes
- 1.5.1 Digital Technology Adoption in Large Farms
- 1.5.2 Digital Technology Adoption in Medium Size Farms
- 1.5.3 Digital Technology Adoption in Small Farms
- 1.5.4 Profitability Analysis across Farms
2 Countries
- 2.1 Countries Importing Agricultural Produce and Inputs from the European Union: Impact Analysis
- 2.1.1 U.S.
- 2.1.1.1 Challenges and Opportunities for Smart Farming Service Providers in the U.S.
- 2.1.2 Canada
- 2.1.2.1 Challenges and Opportunities for Smart Farming Service Providers in Canada
- 2.1.3 Mexico
- 2.1.3.1 Challenges and Opportunities for Smart Farming Service Providers in Mexico
- 2.1.4 Brazil
- 2.1.4.1 Challenges and Opportunities for Smart Farming Service Providers in Brazil
- 2.1.5 Chile
- 2.1.5.1 Challenges and Opportunities for Smart Farming Service Providers in Chile
- 2.1.6 Peru
- 2.1.6.1 Challenges and Opportunities for Smart Farming Service Providers in Peru
- 2.1.7 South Africa
- 2.1.7.1 Challenges and Opportunities for Smart Farming Service Providers in South Africa
- 2.1.8 Saudi Arabia
- 2.1.8.1 Challenges and Opportunities for Smart Farming Service Providers in Saudi Arabia
- 2.1.9 U.A.E.
- 2.1.9.1 Challenges and Opportunities for Smart Farming Service Providers in the U.A.E.
- 2.1.10 Egypt
- 2.1.10.1 Challenges and Opportunities for Smart Farming Service Providers in Egypt
- 2.1.11 Turkey
- 2.1.11.1 Challenges and Opportunities for Smart Farming Service Providers in Turkey
- 2.1.12 Israel
- 2.1.12.1 Challenges and Opportunities for Smart Farming Service Providers in Israel
- 2.1.13 South Korea
- 2.1.13.1 Challenges and Opportunities for Smart Farming Service Providers in South Korea
- 2.1.14 Vietnam
- 2.1.14.1 Challenges and Opportunities for Smart Farming Service Providers in Vietnam
- 2.1.15 China
- 2.1.15.1 Challenges and Opportunities for Smart Farming Service Providers in China
- 2.1.16 Japan
- 2.1.16.1 Challenges and Opportunities for Smart Farming Service Providers in Japan
- 2.1.17 Singapore
- 2.1.17.1 Challenges and Opportunities for Smart Farming Service Providers in Singapore
- 2.1.18 Australia
- 2.1.18.1 Challenges and Opportunities for Smart Farming Service Providers in Australia
- 2.1.19 New Zealand
- 2.1.19.1 Challenges and Opportunities for Smart Farming Service Providers in New Zealand
- 2.1.1 U.S.
- 2.2 Conclusion and Recommendations
- 2.2.1 Recommendations
- 2.2.1.1 Emphasis on the EU Organic Action Plan
- 2.2.1.2 Integration of Agri-Voltaics
- 2.2.1.3 Foster Circular Economy
- 2.2.1.4 Implementing Long Range Wide Area Network (LoRaWAN) in Agriculture Systems
- 2.2.1 Recommendations
- 2.3 Future Roadmap for EU Green Deal
3 Research Methodology
- 3.1 Data Sources
- 3.1.1 Primary Data Sources
- 3.1.2 Secondary Data Sources
- 3.1.3 Data Triangulation
