|
|
市場調査レポート
商品コード
1524903
ATaaS(Agriculture Technology-as-a-Service )市場- 世界および地域別分析:用途別、サービスタイプ別、価格別、地域別 - 分析と予測(2024年~2034年)Agriculture Technology-as-a-Service Market - A Global and Regional Analysis: Focus on Application, Service Type, Pricing, and Region - Analysis and Forecast, 2024-2034 |
||||||
|
|||||||
カスタマイズ可能
|
|||||||

| ATaaS(Agriculture Technology-as-a-Service )市場- 世界および地域別分析:用途別、サービスタイプ別、価格別、地域別 - 分析と予測(2024年~2034年) |
|
出版日: 2024年08月02日
発行: BIS Research
ページ情報: 英文 127 Pages
納期: 1~5営業日
|

全表示
- 概要
- 図表
- 目次
ATaaS(農業技術のサービス化)の市場規模は、2023年に42億130万米ドルとなりました。
同市場は、2034年には178億1,880万米ドルに達し、2024年から2034年の予測期間中に13.93%の堅調なCAGRで拡大すると予測されています。同市場成長の主な促進要因の1つは、農業経営の生産性と持続可能性を向上させる費用対効果に優れた拡張可能なソリューションへのニーズが高まっていることです。このモデルにより、農家は多額の先行投資をすることなく先進技術にアクセスすることができます。
| 主要市場統計 | |
|---|---|
| 予測期間 | 2024年~2034年 |
| 2024年評価 | 48億3,710万米ドル |
| 2034年予測 | 178億1,880万米ドル |
| CAGR | 13.93% |
農業技術のサービス化市場は、他の産業におけるサービスとしてのソフトウェア(SaaS)やサービスとしての機器(EaaS)モデルの成功を反映し、農業慣行の近代化において急速に重要な要素になりつつあります。農業技術のサービス化は、農家やアグリビジネスが多額の先行投資を必要とせずに最先端の農業技術にアクセスできるようにする、サブスクリプション・ベースのモデルを提供します。このアプローチには、精密農業機器、データ分析プラットフォーム、自動化機械など、幅広い先進ツールやサービスが含まれ、これらが一体となって作業効率と生産性を向上させる。この枠組みの中でIoT機器やAI主導のソリューションを利用することで、リアルタイムのモニタリングやデータ主導の意思決定が可能になり、より正確で効果的な農作業が促進されます。
農業技術のサービス化市場の拡大は、資源不足や作物収量の増加といった世界の農業課題に対応するため、持続可能でコスト効率の高い農業ソリューションへのニーズが高まっていることが主な要因となっています。このモデルは拡張性と柔軟性を備えているため、あらゆる規模の農場が利用できます。政府や業界のリーダーたちは農業技術のサービス化の価値を認識しており、農業における技術統合を促進することを目的としたさまざまな取り組みや補助金を通じて、その導入を支援しています。その結果、農業技術のサービス化市場は、農業セクターを変革する上で極めて重要な役割を果たすことになり、農家が経営を最適化することを可能にすると同時に、環境の持続可能性を高め、世界の食料安全保障に貢献することになります。
当レポートでは、世界の農業技術のサービス化市場について調査し、市場の概要とともに、用途別、サービスタイプ別、価格別、地域別の動向、および市場に参入する企業のプロファイルなどを提供しています。
目次
エグゼクティブサマリー
第1章 市場:業界の展望
- 動向:現在および将来の影響評価
- サプライチェーンの概要
- 研究開発レビュー
- 規制状況
- ステークホルダー分析
- 市場力学の概要
第2章 用途
- 用途のセグメンテーション
- 用途の概要
- 農業技術のサービス化市場(用途別)
第3章 製品
- 製品セグメンテーション
- 製品概要
- 農業技術のサービス化市場(サービスタイプ別)
- 農業技術のサービス化市場(価格別)
第4章 地域
- 地域別概要
- 北米
- 欧州
- アジア太平洋
- その他の地域
第5章 市場-競合ベンチマーキングと企業プロファイル
- 今後の見通し
- 地理的評価
- 企業プロファイル
- AGRIVI
- IBM Corporation
- Microsoft
- AIRBUS
- BASF SE
- Hexagon AB
- Cropin Technology Solutions Private Limited
- TOPCON CORPORATION
- Deere & Company
- 365FarmNet GmbH
- Trimble Inc.
- KUBOTA Corporation
- VALMONT INDUSTRIES, INC.
- Ag Leader Technology
- Farmers Edge Inc.
- Ceres Imaging
- EM3 Agriservices
- スタートアップ企業一覧
第6章 調査手法
List of Figures
- Figure 1: Agriculture Technology-as-a-Service Market (by Region), $Million, 2023, 2026, and 2034
- Figure 2: Pricing Analysis for Agriculture Technology-as-a-Service Market (by Global and Region), $/Hectare, 2023, 2026, and 2034
- Figure 3: Agriculture Technology-as-a-Service Market (by Application), $Million, 2023, 2026, and 2034
- Figure 4: Global Agriculture Technology-as-a-Service Market (by Service Type), $Million, 2023, 2026, and 2034
- Figure 5: Global Agriculture Technology-as-a-Service Market (by Pricing), $Million, 2023, 2026, and 2034
- Figure 6: Key Events
- Figure 7: Global Gross Agricultural Production Value, $Trillion, 2020-2022
- Figure 8: Share of Freshwater Withdrawal (by Sector), 2023
- Figure 9: Average Pricing Scenario, Equipment-as-a-Service (EaaS), $ Per Hectare, 2022
- Figure 10: Break-Even Analysis
- Figure 11: Mathematical Representation
- Figure 12: Patent Filed (by Country), January 2020-December 2023
- Figure 13: Patent Filed (by Company), January 2020-December 2023
- Figure 14: Impact Analysis of Global Agriculture Technology-as-a-Service Market Navigating Factors, 2024-2034
- Figure 15: U.S. Agriculture Technology-as-a-Service Market, $Million, 2023-2034
- Figure 16: Canada Agriculture Technology-as-a-Service Market, $Million, 2023-2034
- Figure 17: Mexico Agriculture Technology-as-a-Service Market, $Million, 2023-2034
- Figure 18: Germany Agriculture Technology-as-a-Service Market, $Million, 2023-2034
- Figure 19: France Agriculture Technology-as-a-Service Market, $Million, 2023-2034
- Figure 20: U.K. Agriculture Technology-as-a-Service Market, $Million, 2023-2034
- Figure 21: Italy Agriculture Technology-as-a-Service Market, $Million, 2023-2034
- Figure 22: Rest-of-Europe Agriculture Technology-as-a-Service Market, $Million, 2023-2034
- Figure 23: China Agriculture Technology-as-a-Service Market, $Million, 2023-2034
- Figure 24: Japan Agriculture Technology-as-a-Service Market, $Million, 2023-2034
- Figure 25: India Agriculture Technology-as-a-Service Market, $Million, 2023-2034
- Figure 26: South Korea Agriculture Technology-as-a-Service Market, $Million, 2023-2034
- Figure 27: Rest-of-Asia-Pacific Agriculture Technology-as-a-Service Market, $Million, 2023-2034
- Figure 28: South America Agriculture Technology-as-a-Service Market, $Million, 2023-2034
- Figure 29: Middle East and Africa Agriculture Technology-as-a-Service Market, $Million, 2023-2034
- Figure 30: Strategic Initiatives, 2021-2024
- Figure 31: Share of Strategic Initiatives, 2021-2024
- Figure 32: Data Triangulation
- Figure 33: Top-Down and Bottom-Up Approach
- Figure 34: Assumptions and Limitations
List of Tables
- Table 1: Opportunities across Regions
- Table 2: Application Summary
- Table 3: Product Summary (by Service Type)
- Table 4: Product Summary (by Pricing)
- Table 5: Global Agriculture Technology-as-a-Service Market (by Region), $Million, 2023-2034
- Table 6: North America Agriculture Technology-as-a-Service Market (by Application), $Million, 2023-2034
- Table 7: North America Agriculture Technology-as-a-Service Market (by Service Type), $Million, 2023-2034
- Table 8: North America Agriculture Technology-as-a-Service Market (by Pricing), $Million, 2023-2034
- Table 9: U.S. Agriculture Technology-as-a-Service Market (by Application), $Million, 2023-2034
- Table 10: U.S. Agriculture Technology-as-a-Service Market (by Service Type), $Million, 2023-2034
- Table 11: U.S. Agriculture Technology-as-a-Service Market (by Pricing), $Million, 2023-2034
- Table 12: Canada Agriculture Technology-as-a-Service Market (by Application), $Million, 2023-2034
- Table 13: Canada Agriculture Technology-as-a-Service Market (by Service Type), $Million, 2023-2034
- Table 14: Canada Agriculture Technology-as-a-Service Market (by Pricing), $Million, 2023-2034
- Table 15: Mexico Agriculture Technology-as-a-Service Market (by Application), $Million, 2023-2034
- Table 16: Mexico Agriculture Technology-as-a-Service Market (by Service Type), $Million, 2023-2034
- Table 17: Mexico Agriculture Technology-as-a-Service Market (by Pricing), $Million, 2023-2034
- Table 18: Europe Agriculture Technology-as-a-Service Market (by Application), $Million, 2023-2034
- Table 19: Europe Agriculture Technology-as-a-Service Market (by Service Type), $Million, 2023-2034
- Table 20: Europe Agriculture Technology-as-a-Service Market (by Pricing), $Million, 2023-2034
- Table 21: Germany Agriculture Technology-as-a-Service Market (by Application), $Million, 2023-2034
- Table 22: Germany Agriculture Technology-as-a-Service Market (by Service Type), $Million, 2023-2034
- Table 23: Germany Agriculture Technology-as-a-Service Market (by Pricing), $Million, 2023-2034
- Table 24: France Agriculture Technology-as-a-Service Market (by Application), $Million, 2023-2034
- Table 25: France Agriculture Technology-as-a-Service Market (by Service Type), $Million, 2023-2034
- Table 26: France Agriculture Technology-as-a-Service Market (by Pricing), $Million, 2023-2034
- Table 27: U.K. Agriculture Technology-as-a-Service Market (by Application), $Million, 2023-2034
- Table 28: U.K. Agriculture Technology-as-a-Service Market (by Service Type), $Million, 2023-2034
- Table 29: U.K. Agriculture Technology-as-a-Service Market (by Pricing), $Million, 2023-2034
- Table 30: Italy Agriculture Technology-as-a-Service Market (by Application), $Million, 2023-2034
- Table 31: Italy Agriculture Technology-as-a-Service Market (by Service Type), $Million, 2023-2034
- Table 32: Italy Agriculture Technology-as-a-Service Market (by Pricing), $Million, 2023-2034
- Table 33: Rest-of-Europe Agriculture Technology-as-a-Service Market (by Application), $Million, 2023-2034
- Table 34: Rest-of-Europe Agriculture Technology-as-a-Service Market (by Service Type), $Million, 2023-2034
- Table 35: Rest-of-Europe Agriculture Technology-as-a-Service Market (by Pricing), $Million, 2023-2034
- Table 36: Asia-Pacific Agriculture Technology-as-a-Service Market (by Application), $Million, 2023-2034
- Table 37: Asia-Pacific Agriculture Technology-as-a-Service Market (by Service Type), $Million, 2023-2034
- Table 38: Asia-Pacific Agriculture Technology-as-a-Service Market (by Pricing), $Million, 2023-2034
- Table 39: China Agriculture Technology-as-a-Service Market (by Application), $Million, 2023-2034
- Table 40: China Agriculture Technology-as-a-Service Market (by Service Type), $Million, 2023-2034
- Table 41: China Agriculture Technology-as-a-Service Market (by Pricing), $Million, 2023-2034
- Table 42: Japan Agriculture Technology-as-a-Service Market (by Application), $Million, 2023-2034
- Table 43: Japan Agriculture Technology-as-a-Service Market (by Service Type), $Million, 2023-2034
- Table 44: Japan Agriculture Technology-as-a-Service Market (by Pricing), $Million, 2023-2034
- Table 45: India Agriculture Technology-as-a-Service Market (by Application), $Million, 2023-2034
- Table 46: India Agriculture Technology-as-a-Service Market (by Service Type), $Million, 2023-2034
- Table 47: India Agriculture Technology-as-a-Service Market (by Pricing), $Million, 2023-2034
- Table 48: South Korea Agriculture Technology-as-a-Service Market (by Application), $Million, 2023-2034
- Table 49: South Korea Agriculture Technology-as-a-Service Market (by Service Type), $Million, 2023-2034
- Table 50: South Korea Agriculture Technology-as-a-Service Market (by Pricing), $Million, 2023-2034
- Table 51: Rest-of-Asia-Pacific Agriculture Technology-as-a-Service Market (by Application), $Million, 2023-2034
- Table 52: Rest-of-Asia-Pacific Agriculture Technology-as-a-Service Market (by Service Type), $Million, 2023-2034
- Table 53: Rest-of-Asia-Pacific Agriculture Technology-as-a-Service Market (by Pricing), $Million, 2023-2034
- Table 54: Rest-of-the-World Agriculture Technology-as-a-Service Market (by Application), $Million, 2023-2034
- Table 55: Rest-of-the-World Agriculture Technology-as-a-Service Market (by Service Type), $Million, 2023-2034
- Table 56: Rest-of-the-World Agriculture Technology-as-a-Service Market (by Pricing), $Million, 2023-2034
- Table 57: South America Agriculture Technology-as-a-Service Market (by Application), $Million, 2023-2034
- Table 58: South America Agriculture Technology-as-a-Service Market (by Service Type), $Million, 2023-2034
- Table 59: South America Agriculture Technology-as-a-Service Market (by Pricing), $Million, 2023-2034
- Table 60: Middle East and Africa Agriculture Technology-as-a-Service Market (by Application), $Million, 2023-2034
- Table 61: Middle East and Africa Agriculture Technology-as-a-Service Market (by Service Type), $Million, 2023-2034
- Table 62: Middle East and Africa Agriculture Technology-as-a-Service Market (by Pricing), $Million, 2023-2034
- Table 63: Market Share, 2023
Global Agriculture Technology-as-a-Service Market Overview
The global agriculture technology-as-a-service market, valued at $4,201.3 million in 2023, is expected to reach $17,818.8 million by 2034, exhibiting a robust CAGR of 13.93% during the forecast period 2024-2034. One of the primary drivers for the growth of the agriculture technology-as-a-service market is the increasing need for cost-effective, scalable solutions that enhance productivity and sustainability in farming operations. This model allows farmers to access advanced technologies without significant upfront investments.
Introduction to Agriculture Technology-as-a-Service Market
| KEY MARKET STATISTICS | |
|---|---|
| Forecast Period | 2024 - 2034 |
| 2024 Evaluation | $4,837.1 Million |
| 2034 Forecast | $17,818.8 Million |
| CAGR | 13.93% |
The agriculture technology-as-a-service market is rapidly becoming a crucial element in the modernization of farming practices, mirroring the success of software-as-a-service (SaaS) and equipment-as-a-service (EaaS) models in other industries. Agriculture technology-as-a-service offers a subscription-based model that enables farmers and agribusinesses to access state-of-the-art agricultural technologies without the need for significant upfront capital investments. This approach encompasses a wide range of advanced tools and services, including precision agriculture equipment, data analytics platforms, and automated machinery, which together improve operational efficiency and productivity. The use of IoT devices and AI-driven solutions within this framework allows for real-time monitoring and data-driven decision-making, facilitating more precise and effective farming practices.
The expansion of the agriculture technology-as-a-service market is primarily driven by the increasing need for sustainable and cost-efficient farming solutions in response to global agricultural challenges such as resource scarcity and the demand for higher crop yields. This model offers scalability and flexibility, making it accessible to farms of all sizes. Governments and industry leaders are recognizing the value of agriculture technology-as-a-service, supporting its adoption through various initiatives and subsidies aimed at promoting technological integration in agriculture. As a result, the agriculture technology-as-a-service market is set to play a pivotal role in transforming the agricultural sector, enabling farmers to optimize their operations while also advancing environmental sustainability and contributing to global food security.
Introduction of Agriculture Technology-as-a-Service
Agriculture technology-as-a-service represents an innovative approach to modernizing agricultural practices by offering advanced technological solutions on a subscription basis. Its key components include software-as-a-service (SaaS) and equipment-as-a-service (EaaS), providing farmers and agribusinesses with access to cutting-edge tools and services without the need for substantial initial investments. This model includes a variety of technologies, such as precision agriculture equipment, data analytics platforms, and automated machinery. These technologies work together to enhance operational efficiency and productivity, allowing for more precise and informed farming decisions. Key components of agriculture technology-as-a-service include GPS-guided tractors, drones, soil sensors, weather stations, and farm management software, all of which provide real-time data and analytics to optimize farming practices.
Agriculture technology-as-a-service also incorporates the use of IoT devices and AI-driven solutions, which enable continuous monitoring and predictive analytics. Drones play a significant role by offering aerial surveillance and mapping, helping to monitor crop health, detect pest infestations, and manage irrigation systems efficiently. Robots and autonomous vehicles further contribute by performing tasks such as planting, harvesting, and crop monitoring, thereby reducing labor costs and increasing productivity. The growing need for sustainable and cost-effective farming solutions is a primary driver for the expansion of the agriculture technology-as-a-service market. This approach not only helps in achieving higher crop yields but also supports environmental sustainability by optimizing resource use. Governments and industry leaders are increasingly recognizing the potential of agriculture technology-as-a-service, promoting its adoption through various initiatives and subsidies, positioning it as a critical component in the future of agriculture.
Industrial Impact
The agriculture technology-as-a-service market is poised to have a significant impact on the agricultural industry by transforming traditional farming practices into more efficient, data-driven operations. By providing access to advanced technologies such as precision agriculture tools, IoT devices, and AI-driven analytics, agriculture technology-as-a-service enables farmers to make informed decisions that optimize resource use and enhance crop yields. The adoption of GPS-guided tractors, drones for aerial surveillance, and automated machinery for planting and harvesting streamline operations. This shift not only improves the economic viability of farming but also promotes sustainable practices by minimizing waste and conserving resources.
Moreover, the industrial impact of agriculture technology-as-a-service extends to the broader agricultural supply chain, facilitating better integration and coordination among various stakeholders. Real-time data collection and analysis allow for more accurate forecasting and inventory management, reducing the risk of supply chain disruptions. Additionally, agriculture technology-as-a-service promotes innovation by encouraging the development and adoption of new technologies, fostering a more competitive and dynamic agricultural sector. As governments and industry leaders continue to support the deployment of agriculture technology-as-a-service through subsidies and initiatives, the market is expected to drive significant advancements in agricultural productivity and sustainability, ultimately contributing to global food security and economic growth.
In 2023, the global agriculture technology-as-a-service market reached a valuation of $4,201.3 million. Over the forecast period, the market is projected to exhibit a CAGR of 13.93%, reaching a value of $17,818.8 million by 2034. The surge in demand for agriculture technology-as-a-service is propelled by the increasing need for efficient, scalable solutions that enhance productivity and sustainability in farming. This model allows for the adoption of advanced technologies without significant upfront costs.
Market Segmentation:
Segmentation 1: Application
- Harvest Dynamics Monitoring
- Soil Management and Testing
- Crop Health Monitoring
- Irrigation
- Others
Crop Health Monitoring Segment to Dominate the Global Agriculture Technology-as-a-Service Market (by Application)
During the forecast period 2024-2034, the crop health monitoring segment is expected to be the leading application segment in the agriculture technology-as-a-service market, primarily due to the growing need for precision farming practices that ensure optimal crop yields and quality. This segment leverages advanced technologies such as drones, IoT sensors, and data analytics to provide real-time insights into crop conditions, enabling farmers to detect and address issues such as pests, diseases, and nutrient deficiencies more efficiently. The ability to monitor crop health accurately and take timely actions significantly enhances productivity and sustainability, making it a crucial component of modern agricultural practices.
Segmentation 2: by Service Type
- Software-as-a-Service (SaaS)
- On-Cloud
- On-Premises
- Equipment-as-a-Service (EaaS)
- Agriculture Drone-as-a-Service (ADaaS)
- Agriculture Robot-as-a-Service (ARaaS)
Segmentation 3: by Pricing
- Subscription
- Pay-per-Use
Segmentation 4: by Region
- North America
- Europe
- Asia-Pacific
- Rest-of-the-World
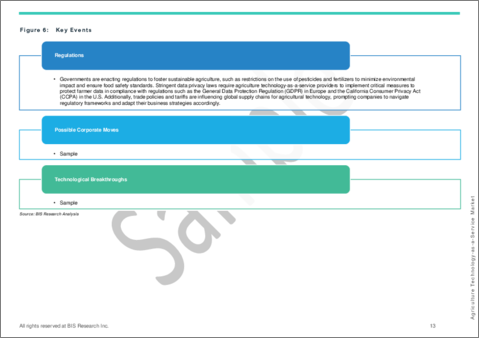
Recent Developments in the Global Agriculture Technology-as-a-Service Market
- In March 2024, Ceres Imaging launched Portfolio Insights, an AI-enabled product suite designed to simplify agricultural management, to empower land investors, lenders, growers, and crop insurers with the tools to collect, analyze, and visualize farmland data, facilitating better and faster decision-making.
- In January 2024, Farmers Edge Inc., in collaboration with LTIMindtree, launched the Farmers Edge Innovation Lab (FEIL) in Mumbai, powered by Fairfax Digital Services, to revolutionize agriculture in India by integrating advanced AgTech with global digital solutions.
- In January 2024, Trimble Inc. launched the Connected Climate Exchange, a carbon marketplace designed to connect farmers, agronomists, and businesses, enabling stakeholders to track and leverage sustainable farming practices, meeting net-zero commitments and promoting a sustainable future.
Demand - Drivers, Challenges, and Opportunities
Market Driver: Growing Adoption of Precision Agriculture
- The growing adoption of precision agriculture has emerged as a significant driver for the agriculture technology-as-a-service market. Precision agriculture utilizes advanced technologies such as drones, sensors, and data analytics to optimize farming practices. By providing farmers with precise information about soil conditions, weather patterns, and crop health, precision agriculture enables more efficient use of resources such as water, fertilizers, and pesticides. This targeted approach not only enhances crop yields but also reduces input costs and minimizes environmental impact. As farmers increasingly recognize the potential benefits of precision agriculture in improving productivity and sustainability, there has been a corresponding rise in demand for agriculture technology-as-a-service solutions.
Market Challenge: Insufficient Technical Expertise among Farmers
- Insufficient technical expertise among farmers presents a significant challenge for the agriculture technology-as-a-service market. Many farmers, particularly in smallholder and traditional farming communities, lack the necessary knowledge and skills to effectively utilize advanced agricultural technologies. These technologies, ranging from precision farming tools to data analytics platforms, require a nuanced understanding of implementation, maintenance, and troubleshooting. The gap in technical expertise often hinders the adoption and optimal utilization of technology-as-a-service solutions, limiting their potential to enhance farm productivity and sustainability.
Market Opportunity: Rising Investment in Agriculture Technology Startups
- Rising investment in agriculture technology (agri-tech) startups presents a significant opportunity for the agriculture technology-as-a-service market. Increased funding from venture capitalists, private equity firms, and government grants has enabled a surge in innovation and development within the agri-tech sector. These investments are fostering the creation of advanced technologies such as IoT-based sensors, AI-driven analytics platforms, and autonomous machinery, which can significantly enhance farming efficiency and productivity.
How can this report add value to an organization?
Product/Innovation Strategy: The product segment helps the reader understand the different applications of agriculture technology-as-a-service and their global potential. Moreover, the study gives the reader a detailed understanding of the end-use industries and different products offered by different regulations, consortiums and associations, and government programs impacting agriculture technology-as-a-service manufacturers for various purposes.
Growth/Marketing Strategy: The global agriculture technology-as-a-service market has seen major development by key players operating in the market, such as business expansion, partnership, collaboration, and joint venture. The favored strategy for the companies has been partnership, collaboration, and joint venture activities to strengthen their position in the global agriculture technology-as-a-service market.
Competitive Strategy: Key players in the global agriculture technology-as-a-service market analyzed and profiled in the study involve agriculture technology-as-a-service providers, including market segments covered by distinct product kinds, applications served, and regional presence, as well as the influence of important market tactics employed. Moreover, a detailed competitive benchmarking of the players operating in the global agriculture technology-as-a-service market has been done to help the reader understand how players stack against each other, presenting a clear market landscape. Additionally, comprehensive competitive strategies such as partnerships, agreements, and collaborations will aid the reader in understanding the untapped revenue pockets in the agriculture technology-as-a-service market.
Research Methodology
Data Sources
Primary Data Sources
The primary sources involve industry experts from the precision agriculture industry and various stakeholders such as raw material suppliers, equipment manufacturers, distributors, and end users. Respondents such as CEOs, vice presidents, marketing directors, and technology and innovation directors have been interviewed to obtain and verify both qualitative and quantitative aspects of this research study.
The key data points taken from primary sources include:
- validation and triangulation of all the numbers and graphs
- validation of reports segmentation and key qualitative findings
- understanding the competitive landscape
- validation of the numbers of various markets for market type
- percentage split of individual markets for regional analysis
Secondary Data Sources
This research study involves the usage of extensive secondary research, directories, company websites, and annual reports. It also makes use of databases, such as ITU, Hoovers, Bloomberg, Businessweek, and Factiva, to collect useful and effective information for an extensive, technical, market-oriented, and commercial study of the global agriculture technology-as-a-service market. In addition to the data sources, the study has been undertaken with the help of other data sources and websites, such as Data Center Dynamics and Data Center Knowledge.
Secondary research was done to obtain crucial information about the industry's value chain, revenue models, the market's monetary chain, the total pool of key players, and the current and potential use cases and applications.
The key data points taken from secondary research include:
- segmentations and percentage shares
- data for market value
- key industry trends of the top players of the market
- qualitative insights into various aspects of the market, key trends, and emerging areas of innovation
- quantitative data for mathematical and statistical calculations
Data Triangulation
This research study involves the usage of extensive secondary sources, such as certified publications, articles from recognized authors, This research study involves the usage of extensive secondary sources, such as certified publications, articles from recognized authors, white papers, annual reports of companies, directories, and major databases to collect useful and effective information for an extensive, technical, market-oriented, and commercial study of the global agriculture technology-as-a-service market.
The process of market engineering involves the calculation of the market statistics, market size estimation, market forecast, market crackdown, and data triangulation (the methodology for such quantitative data processes is explained in further sections). The primary research study has been undertaken to gather information and validate the market numbers for segmentation types and industry trends of the key players in the market.
Factors for Data Prediction and Modeling
- The section exhibits the standard assumptions and limitations followed throughout the research study, which is named the global agriculture technology-as-a-service market.
- The scope of this report has been focused on various applications and product types.
- The base currency considered for the market analysis is US$. Currencies other than the US$ have been converted to the US$ for all statistical calculations, considering the average conversion rate for that particular year.
- The currency conversion rate has been taken from the historical exchange rate of the Oanda website.
- Nearly all the recent developments from January 2021 to May 2024 have been considered in this research study.
- The information rendered in the report is a result of in-depth primary interviews, surveys, and secondary analysis.
- Where relevant information was not available, proxy indicators and extrapolation were employed.
- Any economic downturn in the future has not been taken into consideration for the market estimation and forecast.
- Technologies currently used are expected to persist through the forecast with no major technological breakthroughs
Key Market Players and Competition Synopsis
The companies that are profiled in the agriculture technology-as-a-service market have been selected based on inputs gathered from primary experts and analyzing company coverage, product portfolio, application, and market penetration. The global agriculture technology-as-a-service market is growing at a prominent rate, with many players competing for market share. The agriculture technology-as-a-service market is characterized by the presence of companies offering agriculture technology-as-a-service and new-age startups. The agriculture technology-as-a-service market is attracting significant investment, driven by its capacity for enhancing productivity and sustainability in farming practices. Despite the potential, large-scale deployments may face logistical challenges related to infrastructure limitations and the integration of new technologies into existing systems.
Major players in the agriculture technology-as-a-service market include AGRIVI, IBM Corporation, Microsoft, AIRBUS, and BASF SE.
Some prominent names established in the agriculture technology-as-a-service market are:
- Hexagon AB
- Cropin Technology Solutions Private Limited
- TOPCON CORPORATION
- Deere & Company
- 365FarmNet GmbH
- Trimble Inc.
- KUBOTA Corporation
- VALMONT INDUSTRIES, INC.
- Ag Leader Technology
- Farmers Edge Inc.
- Ceres Imaging
- EM3 Agriservices
Table of Contents
Executive Summary
Scope and Definition
1 Market: Industry Outlook
- 1.1 Trends: Current and Future Impact Assessment
- 1.1.1 Increasing Food Consumption Due to Rise in Population
- 1.1.2 Increasing Need for Sustainable Agricultural Practices
- 1.2 Supply Chain Overview
- 1.2.1 Value Chain Analysis
- 1.2.2 Pricing Forecast
- 1.2.3 Break-Even Analysis
- 1.2.3.1 Introduction
- 1.2.3.2 Key Components
- 1.2.3.3 Calculation
- 1.2.3.4 Case Study: Break-even Analysis of Smart Agriculture Solutions in Indonesia
- 1.3 Research and Development Review
- 1.3.1 Patent Filing Trend (by Country and Company)
- 1.4 Regulatory Landscape
- 1.5 Stakeholder Analysis
- 1.5.1 Use Case
- 1.5.2 End User and Buying Criteria
- 1.6 Market Dynamics Overview
- 1.6.1 Market Drivers
- 1.6.1.1 Growing Adoption of Precision Agriculture
- 1.6.1.2 Low Capital Investment for Farmers
- 1.6.2 Market Challenges
- 1.6.2.1 Insufficient Technical Expertise among Farmers
- 1.6.2.2 Inadequate Infrastructure and Workforce for EaaS Solutions
- 1.6.3 Market Opportunities
- 1.6.3.1 Rising Investment in Agriculture Technology Startups
- 1.6.3.2 Emergence of Collaborative Partnerships and Ecosystems
- 1.6.1 Market Drivers
2 Application
- 2.1 Application Segmentation
- 2.2 Application Summary
- 2.3 Agriculture Technology-as-a-Service Market (by Application)
- 2.3.1 Harvest Dynamics Monitoring
- 2.3.2 Soil Management and Testing
- 2.3.3 Crop Health Monitoring
- 2.3.4 Irrigation
- 2.3.5 Others
3 Products
- 3.1 Product Segmentation
- 3.2 Product Summary
- 3.3 Agriculture Technology-as-a-Service Market (by Service Type)
- 3.3.1 Software-as-a-Service (SaaS)
- 3.3.1.1 Software-as-a-Service (SaaS) (by Installation Type)
- 3.3.1.1.1 On-Cloud
- 3.3.1.1.2 On-Premises
- 3.3.1.1 Software-as-a-Service (SaaS) (by Installation Type)
- 3.3.2 Equipment-as-a-Service (EaaS)
- 3.3.2.1 Agriculture Drone-as-a-Service (ADaaS)
- 3.3.2.2 Agriculture Robot-as-a-Service (ARaaS)
- 3.3.1 Software-as-a-Service (SaaS)
- 3.4 Agriculture Technology-as-a-Service Market (by Pricing)
- 3.4.1 Subscription
- 3.4.2 Pay-per-Use
4 Regions
- 4.1 Regional Summary
- 4.2 North America
- 4.2.1 Regional Overview
- 4.2.2 Driving Factors for Market Growth
- 4.2.3 Factors Challenging the Market
- 4.2.3.1 Application
- 4.2.3.2 Product
- 4.2.4 U.S.
- 4.2.4.1 Application
- 4.2.4.2 Product
- 4.2.5 Canada
- 4.2.5.1 Application
- 4.2.5.2 Product
- 4.2.6 Mexico
- 4.2.6.1 Application
- 4.2.6.2 Product
- 4.3 Europe
- 4.3.1 Regional Overview
- 4.3.2 Driving Factors for Market Growth
- 4.3.3 Factors Challenging the Market
- 4.3.3.1 Application
- 4.3.3.2 Product
- 4.3.4 Germany
- 4.3.4.1 Application
- 4.3.4.2 Product
- 4.3.5 France
- 4.3.5.1 Application
- 4.3.5.2 Product
- 4.3.6 U.K.
- 4.3.6.1 Application
- 4.3.6.2 Product
- 4.3.7 Italy
- 4.3.7.1 Application
- 4.3.7.2 Product
- 4.3.8 Rest-of-Europe
- 4.3.8.1 Application
- 4.3.8.2 Product
- 4.4 Asia-Pacific
- 4.4.1 Regional Overview
- 4.4.2 Driving Factors for Market Growth
- 4.4.3 Factors Challenging the Market
- 4.4.3.1 Application
- 4.4.3.2 Product
- 4.4.4 China
- 4.4.4.1 Application
- 4.4.4.2 Product
- 4.4.5 Japan
- 4.4.5.1 Application
- 4.4.5.2 Product
- 4.4.6 India
- 4.4.6.1 Application
- 4.4.6.2 Product
- 4.4.7 South Korea
- 4.4.7.1 Application
- 4.4.7.2 Product
- 4.4.8 Rest-of-Asia-Pacific
- 4.4.8.1 Application
- 4.4.8.2 Product
- 4.5 Rest-of-the-World
- 4.5.1 Regional Overview
- 4.5.2 Driving Factors for Market Growth
- 4.5.3 Factors Challenging the Market
- 4.5.3.1 Application
- 4.5.3.2 Product
- 4.5.4 South America
- 4.5.4.1 Application
- 4.5.4.2 Product
- 4.5.5 Middle East and Africa
- 4.5.5.1 Application
- 4.5.5.2 Product
5 Markets - Competitive Benchmarking & Company Profiles
- 5.1 Next Frontiers
- 5.2 Geographic Assessment
- 5.3 Company Profiles
- 5.3.1 AGRIVI
- 5.3.1.1 Overview
- 5.3.1.2 Top Products/Product Portfolio
- 5.3.1.3 Top Competitors
- 5.3.1.4 Target Customers
- 5.3.1.5 Key Personnel
- 5.3.1.6 Analyst View
- 5.3.1.7 Market Share, 2023
- 5.3.2 IBM Corporation
- 5.3.2.1 Overview
- 5.3.2.2 Top Products/Product Portfolio
- 5.3.2.3 Top Competitors
- 5.3.2.4 Target Customers
- 5.3.2.5 Key Personnel
- 5.3.2.6 Analyst View
- 5.3.2.7 Market Share, 2023
- 5.3.3 Microsoft
- 5.3.3.1 Overview
- 5.3.3.2 Top Products/Product Portfolio
- 5.3.3.3 Top Competitors
- 5.3.3.4 Target Customers
- 5.3.3.5 Key Personnel
- 5.3.3.6 Analyst View
- 5.3.3.7 Market Share, 2023
- 5.3.4 AIRBUS
- 5.3.4.1 Overview
- 5.3.4.2 Top Products/Product Portfolio
- 5.3.4.3 Top Competitors
- 5.3.4.4 Target Customers
- 5.3.4.5 Key Personnel
- 5.3.4.6 Analyst View
- 5.3.4.7 Market Share, 2023
- 5.3.5 BASF SE
- 5.3.5.1 Overview
- 5.3.5.2 Top Products/Product Portfolio
- 5.3.5.3 Top Competitors
- 5.3.5.4 Target Customers
- 5.3.5.5 Key Personnel
- 5.3.5.6 Analyst View
- 5.3.5.7 Market Share, 2023
- 5.3.6 Hexagon AB
- 5.3.6.1 Overview
- 5.3.6.2 Top Products/Product Portfolio
- 5.3.6.3 Top Competitors
- 5.3.6.4 Target Customers
- 5.3.6.5 Key Personnel
- 5.3.6.6 Analyst View
- 5.3.6.7 Market Share, 2023
- 5.3.7 Cropin Technology Solutions Private Limited
- 5.3.7.1 Overview
- 5.3.7.2 Top Products/Product Portfolio
- 5.3.7.3 Top Competitors
- 5.3.7.4 Target Customers
- 5.3.7.5 Key Personnel
- 5.3.7.6 Analyst View
- 5.3.7.7 Market Share, 2023
- 5.3.8 TOPCON CORPORATION
- 5.3.8.1 Overview
- 5.3.8.2 Top Products/Product Portfolio
- 5.3.8.3 Top Competitors
- 5.3.8.4 Target Customers
- 5.3.8.5 Key Personnel
- 5.3.8.6 Analyst View
- 5.3.8.7 Market Share, 2023
- 5.3.9 Deere & Company
- 5.3.9.1 Overview
- 5.3.9.2 Top Products/Product Portfolio
- 5.3.9.3 Top Competitors
- 5.3.9.4 Target Customers
- 5.3.9.5 Key Personnel
- 5.3.9.6 Analyst View
- 5.3.9.7 Market Share, 2023
- 5.3.10 365FarmNet GmbH
- 5.3.10.1 Overview
- 5.3.10.2 Top Products/Product Portfolio
- 5.3.10.3 Top Competitors
- 5.3.10.4 Target Customers
- 5.3.10.5 Key Personnel
- 5.3.10.6 Analyst View
- 5.3.10.7 Market Share, 2023
- 5.3.11 Trimble Inc.
- 5.3.11.1 Overview
- 5.3.11.2 Top Products/Product Portfolio
- 5.3.11.3 Top Competitors
- 5.3.11.4 Target Customers
- 5.3.11.5 Key Personnel
- 5.3.11.6 Analyst View
- 5.3.11.7 Market Share, 2023
- 5.3.12 KUBOTA Corporation
- 5.3.12.1 Overview
- 5.3.12.2 Top Products/Product Portfolio
- 5.3.12.3 Top Competitors
- 5.3.12.4 Target Customers
- 5.3.12.5 Key Personnel
- 5.3.12.6 Analyst View
- 5.3.12.7 Market Share, 2023
- 5.3.13 VALMONT INDUSTRIES, INC.
- 5.3.13.1 Overview
- 5.3.13.2 Top Products/Product Portfolio
- 5.3.13.3 Top Competitors
- 5.3.13.4 Target Customers
- 5.3.13.5 Key Personnel
- 5.3.13.6 Analyst View
- 5.3.13.7 Market Share, 2023
- 5.3.14 Ag Leader Technology
- 5.3.14.1 Overview
- 5.3.14.2 Top Products/Product Portfolio
- 5.3.14.3 Top Competitors
- 5.3.14.4 Target Customers
- 5.3.14.5 Key Personnel
- 5.3.14.6 Analyst View
- 5.3.14.7 Market Share, 2023
- 5.3.15 Farmers Edge Inc.
- 5.3.15.1 Overview
- 5.3.15.2 Top Products/Product Portfolio
- 5.3.15.3 Top Competitors
- 5.3.15.4 Target Customers
- 5.3.15.5 Key Personnel
- 5.3.15.6 Analyst View
- 5.3.15.7 Market Share, 2023
- 5.3.16 Ceres Imaging
- 5.3.16.1 Overview
- 5.3.16.2 Top Products/Product Portfolio
- 5.3.16.3 Top Competitors
- 5.3.16.4 Target Customers
- 5.3.16.5 Key Personnel
- 5.3.16.6 Analyst View
- 5.3.16.7 Market Share, 2023
- 5.3.17 EM3 Agriservices
- 5.3.17.1 Overview
- 5.3.17.2 Top Products/Product Portfolio
- 5.3.17.3 Top Competitors
- 5.3.17.4 Target Customers
- 5.3.17.5 Key Personnel
- 5.3.17.6 Analyst View
- 5.3.17.7 Market Share, 2023
- 5.3.18 List of Startups
- 5.3.1 AGRIVI
6 Research Methodology
- 6.1 Data Sources
- 6.1.1 Primary Data Sources
- 6.1.2 Secondary Data Sources
- 6.1.3 Data Triangulation
- 6.2 Market Estimation and Forecast
