|
|
市場調査レポート
商品コード
1481274
欧州の持続可能ワイヤー&ケーブル市場:エンドユーザー・用途・設置タイプ・原材料・製品タイプ・電圧タイプ・導体数・国別の分析・予測 (2023-2032年)Europe Sustainable Wire and Cable Market: Focus on End Users, Applications, Installation Type, Raw Material, Product Type, Voltage Type, Conductor Count, and Country - Analysis and Forecast, 2023-2032 |
||||||
|
|||||||
カスタマイズ可能
|
|||||||

| 欧州の持続可能ワイヤー&ケーブル市場:エンドユーザー・用途・設置タイプ・原材料・製品タイプ・電圧タイプ・導体数・国別の分析・予測 (2023-2032年) |
|
出版日: 2024年05月20日
発行: BIS Research
ページ情報: 英文 134 Pages
納期: 1~5営業日
|

全表示
- 概要
- 図表
- 目次
英国を除く欧州の持続可能ワイヤー&ケーブルの市場規模は、2023年の37億6,000万米ドルから、予測期間中は18.34%のCAGRで推移し、2032年には171億3,000万米ドルに達すると予測されています。
同市場の成長には、環境規制の拡大と環境に優しい製品に対する消費者の嗜好の高まりに加え、規制措置の強化を通じた炭素排出低減のための政府の取り組みが背景にあると予測されてます。
| 主要市場統計 | |
|---|---|
| 予測期間 | 2023-2032年 |
| 2023年評価 | 37億6,000万米ドル |
| 2032年予測 | 171億3,000万米ドル |
| CAGR | 18.34% |
欧州の持続可能ワイヤー&ケーブル市場は、いくつかの要因によって著しい成長を遂げています。環境意識の高まりと持続可能な実践を促進する厳しい規制が、地域全体での環境に優しいワイヤー&ケーブルソリューションの採用を後押ししています。環境への影響を低減した製品に対する消費者の嗜好の高まりは、市場の拡大をさらに後押ししています。さらに、二酸化炭素排出量の削減を目指す政府の取り組みが、産業界に持続可能な技術への投資を促しています。特に建設分野では、グリーンビルディングへの取り組みやエネルギー効率要件に後押しされ、持続可能ワイヤー&ケーブルソリューションに対する大きな需要が見られます。欧州は環境の持続可能性への取り組みをリードしており、持続可能ワイヤー&ケーブルの市場は、環境問題に対処し、進化する規制基準を満たすことを目指すメーカーやステークホルダーに有利な機会を示しています。
市場の分類:
セグメンテーション1:エンドユーザー別
- 再生可能エネルギーシステム
- 建築・建設
- 通信・データセンター
- 産業用アプリケーション
- 交通インフラ
- ヘルスケア施設
- その他
セグメンテーション2:用途別
- 電力
- データ伝送・通信
セグメンテーション3:設置タイプ別
- 架空
- 地下
- システム内
セグメンテーション4:原材料別
- 金属
- 銅
- アルミニウム
- その他
- 非金属
- バイオベースポリマー
- リサイクルポリマー・プラスチック
セグメンテーション5:製品タイプ別
- 光ファイバーケーブル
- 同軸ケーブル
- エナメル/マグネットケーブル
- 電力ケーブル
- 信号・制御ケーブル
- 通信・データケーブル
- その他
セグメンテーション6:電圧タイプ別
- 低電圧
- 中電圧
- 高電圧
セグメンテーション7:導体数別
- 単一導体
- 複数導体
セグメンテーション8:地域別
- 欧州
- 英国
当レポートでは、欧州の持続可能ワイヤー&ケーブルの市場を調査し、業界の動向、進行中のプログラム、特許動向、市場成長促進要因・抑制要因、市場規模の推移・予測、各種区分別の詳細分析、競合情勢、主要企業のプロファイルなどをまとめています。
目次
エグゼクティブサマリー
調査範囲
第1章 市場
- 業界展望
- 持続可能ワイヤー&ケーブル:概要
- 動向:現在と将来
- サプライチェーン分析
- エコシステム/進行中のプログラム
- 主要企業による持続可能な取り組み
- 主要特許マッピング
- 事業力学
- 事業促進要因
- 事業上の制約
- 事業戦略
- 企業戦略
- 事業機会
第2章 地域
- 欧州
- 英国
第3章 市場:競合ベンチマーキング・企業プロファイル
- 競合ベンチマーキング
- 企業プロファイル
- Prysmian Group
- TFKable
- LAPP Group
- SAB Brockskes GmbH & Co. KG
第4章 調査手法
List of Figures
- Figure 1: Europe Sustainable Wire and Cable Market, $Billion, 2022-2032
- Figure 2: Europe Sustainable Wire and Cable Market, Kiloton, 2022-2032
- Figure 3: Europe Sustainable Wire and Cable Market (by End User), $Billion, 2022-2032
- Figure 4: Europe Sustainable Wire and Cable Market (by Application), $Billion, 2022-2032
- Figure 5: Europe Sustainable Wire and Cable Market (by In-System), $Billion, 2022-2032
- Figure 6: Europe Sustainable Wire and Cable Market (by Raw Material), $Billion, 2022-2032
- Figure 7: Europe Sustainable Wire and Cable Market (by Product Type), $Billion, 2022-2032
- Figure 8: Europe Sustainable Wire and Cable Market (by Voltage Type), $Billion, 2022-2032
- Figure 9: Europe Sustainable Wire and Cable Market (by Conductor Count), $Billion, 2022-2032
- Figure 10: Sustainable Wire and Cable Market (by Region), $Billion, 2022
- Figure 11: Sustainable Wire and Cable Market Supply Chain Analysis
- Figure 12: Business Dynamics for Sustainable Wire and Cable Market
- Figure 13: Key Business Strategies, 2020-2023
- Figure 14: Product Development (by Company), 2020-2023
- Figure 15: Market Development (by Company), 2020-2023
- Figure 16: Key Corporate Strategies, 2020-2023
- Figure 17: Partnerships, Joint Ventures, Collaborations, and Alliances (by Company), 2020-2023
- Figure 18: Competitive Benchmarking for Sustainable Wire and Cable Market
- Figure 19: Prysmian Group: R&D Expenditure, $Million, 2020-2022
- Figure 20: Research Methodology
- Figure 21: Data Triangulation
- Figure 22: Top-Down and Bottom-Up Approach
- Figure 23: Assumptions and Limitations
List of Tables
- Table 1: Europe Sustainable Wire and Cable Market Overview
- Table 2: Consortiums and Associations
- Table 3: Regulatory Bodies
- Table 4: Government Programs
- Table 5: Programs by Research Institutions and Universities
- Table 6: Sustainable Initiatives by Key Players
- Table 7: Key Patent Mapping
- Table 8: Impact of Business Drivers
- Table 9: Impact of Business Restraints
- Table 10: Impact of Business Opportunities
- Table 11: Developments in the Sustainable Wire and Cable Market Related to the Deployment of Sustainable Technologies
- Table 12: Sustainable Wire and Cable Market (by Region), Kiloton, 2022-2032
- Table 13: Sustainable Wire and Cable Market (by Region), $Billion, 2022-2032
- Table 14: Europe Sustainable Wire and Cable Market (by End User), Kiloton, 2022-2032
- Table 15: Europe Sustainable Wire and Cable Market (by End User), $Million, 2022-2032
- Table 16: Europe Sustainable Wire and Cable Market (by Application), Kiloton, 2022-2032
- Table 17: Europe Sustainable Wire and Cable Market (by Application), $Million, 2022-2032
- Table 18: Europe Sustainable Wire and Cable Market (by Installation Type), Kiloton, 2022-2032
- Table 19: Europe Sustainable Wire and Cable Market (by Installation Type), $Million, 2022-2032
- Table 20: Europe Sustainable Wire and Cable Market (by Raw Material), Kiloton, 2022-2032
- Table 21: Europe Sustainable Wire and Cable Market (by Raw Material), $Million, 2022-2032
- Table 22: Europe Sustainable Wire and Cable Market (by Product Type), Kiloton, 2022-2032
- Table 23: Europe Sustainable Wire and Cable Market (by Product Type), $Million, 2022-2032
- Table 24: Europe Sustainable Wire and Cable Market (by Voltage Type), Kiloton, 2022-2032
- Table 25: Europe Sustainable Wire and Cable Market (by Voltage Type), $Million, 2022-2032
- Table 26: Europe Sustainable Wire and Cable Market (by Conductor Count), Kiloton, 2022-2032
- Table 27: Europe Sustainable Wire and Cable Market (by Conductor Count), $Million, 2022-2032
- Table 28: Germany Sustainable Wire and Cable Market (by End User), Kiloton, 2022-2032
- Table 29: Germany Sustainable Wire and Cable Market (by End User), $Million, 2022-2032
- Table 30: Germany Sustainable Wire and Cable Market (by Application), Kiloton, 2022-2032
- Table 31: Germany Sustainable Wire and Cable Market (by Application), $Million, 2022-2032
- Table 32: Germany Sustainable Wire and Cable Market (by Installation Type), Kiloton, 2022-2032
- Table 33: Germany Sustainable Wire and Cable Market (by Installation Type), $Million, 2022-2032
- Table 34: Germany Sustainable Wire and Cable Market (by Raw Material), Kiloton, 2022-2032
- Table 35: Germany Sustainable Wire and Cable Market (by Raw Material), $Million, 2022-2032
- Table 36: Germany Sustainable Wire and Cable Market (by Product Type), Kiloton, 2022-2032
- Table 37: Germany Sustainable Wire and Cable Market (by Product Type), $Million, 2022-2032
- Table 38: Germany Sustainable Wire and Cable Market (by Voltage Type), Kiloton, 2022-2032
- Table 39: Germany Sustainable Wire and Cable Market (by Voltage Type), $Million, 2022-2032
- Table 40: Germany Sustainable Wire and Cable Market (by Conductor Count), Kiloton, 2022-2032
- Table 41: Germany Sustainable Wire and Cable Market (by Conductor Count), $Million, 2022-2032
- Table 42: France Sustainable Wire and Cable Market (by End User), Kiloton, 2022-2032
- Table 43: France Sustainable Wire and Cable Market (by End User), $Million, 2022-2032
- Table 44: France Sustainable Wire and Cable Market (by Application), Kiloton, 2022-2032
- Table 45: France Sustainable Wire and Cable Market (by Application), $Million, 2022-2032
- Table 46: France Sustainable Wire and Cable Market (by Installation Type), Kiloton, 2022-2032
- Table 47: France Sustainable Wire and Cable Market (by Installation Type), $Million, 2022-2032
- Table 48: France Sustainable Wire and Cable Market (by Raw Material), Kiloton, 2022-2032
- Table 49: France Sustainable Wire and Cable Market (by Raw Material), $Million, 2022-2032
- Table 50: France Sustainable Wire and Cable Market (by Product Type), Kiloton, 2022-2032
- Table 51: France Sustainable Wire and Cable Market (by Product Type), $Million, 2022-2032
- Table 52: France Sustainable Wire and Cable Market (by Voltage Type), Kiloton, 2022-2032
- Table 53: France Sustainable Wire and Cable Market (by Voltage Type), $Million, 2022-2032
- Table 54: France Sustainable Wire and Cable Market (by Conductor Count), Kiloton, 2022-2032
- Table 55: France Sustainable Wire and Cable Market (by Conductor Count), $Million, 2022-2032
- Table 56: Italy Sustainable Wire and Cable Market (by End User), Kiloton, 2022-2032
- Table 57: Italy Sustainable Wire and Cable Market (by End User), $Million, 2022-2032
- Table 58: Italy Sustainable Wire and Cable Market (by Application), Kiloton, 2022-2032
- Table 59: Italy Sustainable Wire and Cable Market (by Application), $Million, 2022-2032
- Table 60: Italy Sustainable Wire and Cable Market (by Installation Type), Kiloton, 2022-2032
- Table 61: Italy Sustainable Wire and Cable Market (by Installation Type), $Million, 2022-2032
- Table 62: Italy Sustainable Wire and Cable Market (by Raw Material), Kiloton, 2022-2032
- Table 63: Italy Sustainable Wire and Cable Market (by Raw Material), $Million, 2022-2032
- Table 64: Italy Sustainable Wire and Cable Market (by Product Type), Kiloton, 2022-2032
- Table 65: Italy Sustainable Wire and Cable Market (by Product Type), $Million, 2022-2032
- Table 66: Italy Sustainable Wire and Cable Market (by Voltage Type), Kiloton, 2022-2032
- Table 67: Italy Sustainable Wire and Cable Market (by Voltage Type), $Million, 2022-2032
- Table 68: Italy Sustainable Wire and Cable Market (by Conductor Count), Kiloton, 2022-2032
- Table 69: Italy Sustainable Wire and Cable Market (by Conductor Count), $Million, 2022-2032
- Table 70: Spain Sustainable Wire and Cable Market (by End User), Kiloton, 2022-2032
- Table 71: Spain Sustainable Wire and Cable Market (by End User), $Million, 2022-2032
- Table 72: Spain Sustainable Wire and Cable Market (by Application), Kiloton, 2022-2032
- Table 73: Spain Sustainable Wire and Cable Market (by Application), $Million, 2022-2032
- Table 74: Spain Sustainable Wire and Cable Market (by Installation Type), Kiloton, 2022-2032
- Table 75: Spain Sustainable Wire and Cable Market (by Installation Type), $Million, 2022-2032
- Table 76: Spain Sustainable Wire and Cable Market (by Raw Material), Kiloton, 2022-2032
- Table 77: Spain Sustainable Wire and Cable Market (by Raw Material), $Million, 2022-2032
- Table 78: Spain Sustainable Wire and Cable Market (by Product Type), Kiloton, 2022-2032
- Table 79: Spain Sustainable Wire and Cable Market (by Product Type), $Million, 2022-2032
- Table 80: Spain Sustainable Wire and Cable Market (by Voltage Type), Kiloton, 2022-2032
- Table 81: Spain Sustainable Wire and Cable Market (by Voltage Type), $Million, 2022-2032
- Table 82: Spain Sustainable Wire and Cable Market (by Conductor Count), Kiloton, 2022-2032
- Table 83: Spain Sustainable Wire and Cable Market (by Conductor Count), $Million, 2022-2032
- Table 84: Rest-of-Europe Sustainable Wire and Cable Market (by End User), Kiloton, 2022-2032
- Table 85: Rest-of-Europe Sustainable Wire and Cable Market (by End User), $Million, 2022-2032
- Table 86: Rest-of-Europe Sustainable Wire and Cable Market (by Application), Kiloton, 2022-2032
- Table 87: Rest-of-Europe Sustainable Wire and Cable Market (by Application), $Million, 2022-2032
- Table 88: Rest-of-Europe Sustainable Wire and Cable Market (by Installation Type), Kiloton, 2022-2032
- Table 89: Rest-of-Europe Sustainable Wire and Cable Market (by Installation Type), $Million, 2022-2032
- Table 90: Rest-of-Europe Sustainable Wire and Cable Market (by Raw Material), Kiloton, 2022-2032
- Table 91: Rest-of-Europe Sustainable Wire and Cable Market (by Raw Material), $Million, 2022-2032
- Table 92: Rest-of-Europe Sustainable Wire and Cable Market (by Product Type), Kiloton, 2022-2032
- Table 93: Rest-of-Europe Sustainable Wire and Cable Market (by Product Type), $Million, 2022-2032
- Table 94: Rest-of-Europe Sustainable Wire and Cable Market (by Voltage Type), Kiloton, 2022-2032
- Table 95: Rest-of-Europe Sustainable Wire and Cable Market (by Voltage Type), $Million, 2022-2032
- Table 96: Rest-of-Europe Sustainable Wire and Cable Market (by Conductor Count), Kiloton, 2022-2032
- Table 97: Rest-of-Europe Sustainable Wire and Cable Market (by Conductor Count), $Million, 2022-2032
- Table 98: U.K. Sustainable Wire and Cable Market (by End User), Kiloton, 2022-2032
- Table 99: U.K. Sustainable Wire and Cable Market (by End User), $Million, 2022-2032
- Table 100: U.K. Sustainable Wire and Cable Market (by Application), Kiloton, 2022-2032
- Table 101: U.K. Sustainable Wire and Cable Market (by Application), $Million, 2022-2032
- Table 102: U.K. Sustainable Wire and Cable Market (by Installation Type), Kiloton, 2022-2032
- Table 103: U.K. Sustainable Wire and Cable Market (by Installation Type), $Million, 2022-2032
- Table 104: U.K. Sustainable Wire and Cable Market (by Raw Material), Kiloton, 2022-2032
- Table 105: U.K. Sustainable Wire and Cable Market (by Raw Material), $Million, 2022-2032
- Table 106: U.K. Sustainable Wire and Cable Market (by Product Type), Kiloton, 2022-2032
- Table 107: U.K. Sustainable Wire and Cable Market (by Product Type), $Million, 2022-2032
- Table 108: U.K. Sustainable Wire and Cable Market (by Voltage Type), Kiloton, 2022-2032
- Table 109: U.K. Sustainable Wire and Cable Market (by Voltage Type), $Million, 2022-2032
- Table 110: U.K. Sustainable Wire and Cable Market (by Conductor Count), Kiloton, 2022-2032
- Table 111: U.K. Sustainable Wire and Cable Market (by Conductor Count), $Million, 2022-2032
- Table 112: Product Matrix of Key Companies
- Table 113: Market Share Analysis of Key Companies
- Table 114: Prysmian Group: Product Portfolio
- Table 115: TFKable: Product Portfolio
- Table 116: LAPP Group: Product Portfolio
- Table 117: SAB Brockskes GmbH & Co. KG: Product Portfolio
Introduction to Europe Sustainable Wire and Cable Market
The Europe sustainable wire and cable market (excluding U.K.) was valued at $3.76 billion in 2023, and it is expected to grow at a CAGR of 18.34% to reach $17.13 billion by 2032. The anticipated growth of the sustainable wire and cable market is projected to result from the growing prominence of environmental regulations and consumer preference for environmentally friendly products, alongside governmental efforts to mitigate carbon emissions through increased regulatory measures.
| KEY MARKET STATISTICS | |
|---|---|
| Forecast Period | 2023 - 2032 |
| 2023 Evaluation | $3.76 Billion |
| 2032 Forecast | $17.13 Billion |
| CAGR | 18.34% |
Market Introduction
The Europe sustainable wire and cable market is experiencing notable growth, driven by several factors. Increasing environmental awareness and stringent regulations promoting sustainable practices are encouraging the adoption of eco-friendly wire and cable solutions across the region. Consumers' growing preference for products with reduced environmental impact further propels market expansion. Moreover, government initiatives aimed at reducing carbon emissions are incentivizing industries to invest in sustainable technologies. The construction sector, in particular, is witnessing significant demand for sustainable wire and cable solutions, driven by green building initiatives and energy efficiency requirements. With Europe leading the way in environmental sustainability efforts, the sustainable wire and cable market presents lucrative opportunities for manufacturers and stakeholders aiming to address environmental concerns and meet evolving regulatory standards.
Market Segmentation:
Segmentation 1: by End User
- Renewable Energy Systems
- Building and Construction
- Telecommunications and Data Centers
- Industrial Applications
- Transportation Infrastructure
- Healthcare Facilities
- Others
Segmentation 2: by Application
- Power
- Data Transmission and Communication
Segmentation 3: by Installation Type
- Overhead
- Underground
- In-System
Segmentation 4: by Raw Material
- Metallic
- Copper
- Aluminum
- Others
- Non-Metallic
- Bio-Based Polymers
- Recycled Polymers and Plastics
Segmentation 5: by Product Type
- Fiber Optic Cables
- Coaxial Cables
- Enameled/Magnet Cables
- Power Cables
- Signal and Control Cables
- Telecom and Data Cables
- Others
Segmentation 6: by Voltage Type
- Low Voltage
- Medium Voltage
- High Voltage
Segmentation 7: by Conductor Count
- Single Conductor
- Multi Conductor
Segmentation 8: by Region
- Europe
- U.K.
How can this report add value to an organization?
Product/Innovation Strategy: The product/innovation section helps to create winning products, choose the right unmet needs, target the right customer group, and compete with substitute products. The product strategy helps the readers understand the different aftermarket solutions provided by the industry participants.
Growth/Marketing Strategy: The Europe sustainable wire and cable market is growing at a significant pace and holds enormous opportunities for market players. Some of the strategies covered in this segment are product launches, partnerships, collaborations, business expansions, and investments. The companies' preferred strategy has been product launches, partnerships, and collaborations to strengthen their positions in the sustainable wire and cable market.
Competitive Strategy: The key players in the Europe sustainable wire and cable market analyzed and profiled in the study include sustainable wire and cable manufacturers, raw material suppliers, and wholesalers and distributors. Moreover, a detailed competitive benchmarking of the players operating in the sustainable wire and cable industry has been done to help the reader understand the ways in which players stack against each other, presenting a clear market landscape. Additionally, comprehensive competitive strategies such as partnerships, agreements, and collaborations will aid the reader in understanding the untapped revenue pockets in the market.
Key Market Players and Competition Synopsis
The companies that are profiled have been selected based on inputs gathered from primary experts and analyzing company coverage, product portfolio, and regional presence.
Some of the prominent names in this market are:
- Prysmian Group
- TFKable
- LAPP Group
- SAB Brockskes GmbH & Co. KG
Table of Contents
Executive Summary
Scope of the Study
1 Markets
- 1.1 Industry Outlook
- 1.1.1 Sustainable Wire and Cable: Overview
- 1.1.2 Trends: Current and Future
- 1.1.2.1 Widespread Adoption of Circular Economy as Sustainable Practices
- 1.1.2.2 Rising Focus on Data Centers and Networking Systems
- 1.1.2.3 Increasing Infrastructure and Technology Spending in Developing Countries
- 1.1.3 Supply Chain Analysis
- 1.1.4 Ecosystem/Ongoing Programs
- 1.1.4.1 Consortiums and Associations
- 1.1.4.2 Regulatory Bodies
- 1.1.4.3 Government Programs
- 1.1.4.4 Programs by Research Institutions and Universities
- 1.1.5 Sustainable Initiatives by Key Players
- 1.1.6 Key Patent Mapping
- 1.1.6.1 Analyst View
- 1.2 Business Dynamics
- 1.2.1 Business Drivers
- 1.2.1.1 Rising Demand from Renewable Energy Sector
- 1.2.1.2 Growth of Smart and Green Infrastructure
- 1.2.1.3 Increasing Government Focus on Carbon Neutrality to Offset Carbon Emissions
- 1.2.2 Business Restraints
- 1.2.2.1 Lower Adoption Rate Owing to High Price and Lack of Suitable Technologies
- 1.2.2.2 Limited Infrastructure for Material Recycling
- 1.2.2.3 Limited Availability of Sustainable Materials and its Related Standardization Challenges
- 1.2.3 Business Strategies
- 1.2.3.1 Product Development
- 1.2.3.2 Market Development
- 1.2.4 Corporate Strategies
- 1.2.4.1 Mergers and Acquisitions
- 1.2.4.2 Partnerships, Joint Ventures, Collaborations, and Alliances
- 1.2.5 Business Opportunities
- 1.2.5.1 Government Targets toward Green Energy Solutions
- 1.2.5.2 Rapid Advancements in Electric Vehicles and Charging Infrastructure
- 1.2.5.3 Increasing Demand for Deployment of Sustainable Technologies for Power Generation
- 1.2.1 Business Drivers
2 Regions
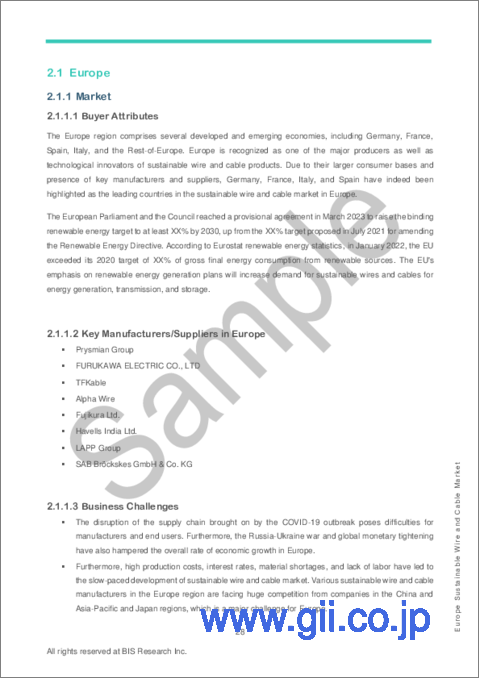
- 2.1 Europe
- 2.1.1 Market
- 2.1.1.1 Buyer Attributes
- 2.1.1.2 Key Manufacturers/Suppliers in Europe
- 2.1.1.3 Business Challenges
- 2.1.1.4 Business Drivers
- 2.1.2 Application
- 2.1.2.1 Europe Sustainable Wire and Cable Market (by End User), Volume and Value Data
- 2.1.2.2 Europe Sustainable Wire and Cable Market (by Application), Volume and Value Data
- 2.1.2.3 Europe Sustainable Wire and Cable Market (by Installation Type), Volume and Value Data
- 2.1.3 Product
- 2.1.3.1 Europe Sustainable Wire and Cable Market (by Raw Material), Volume and Value Data
- 2.1.3.2 Europe Sustainable Wire and Cable Market (by Product Type), Volume and Value Data
- 2.1.3.3 Europe Sustainable Wire and Cable Market (by Voltage Type), Volume and Value Data
- 2.1.3.4 Europe Sustainable Wire and Cable Market (by Conductor Count), Volume and Value Data
- 2.1.4 Europe: Country-Level Analysis
- 2.1.4.1 Germany
- 2.1.4.1.1 Market
- 2.1.4.1.1.1 Buyer Attributes
- 2.1.4.1.1.2 Key Manufacturers/Suppliers in Germany
- 2.1.4.1.1.3 Business Challenges
- 2.1.4.1.1.4 Business Drivers
- 2.1.4.1.2 Application
- 2.1.4.1.2.1 Germany Sustainable Wire and Cable Market (by End User), Volume and Value Data
- 2.1.4.1.2.2 Germany Sustainable Wire and Cable Market (by Application), Volume and Value Data
- 2.1.4.1.2.3 Germany Sustainable Wire and Cable Market (by Installation Type), Volume and Value Data
- 2.1.4.1.3 Product
- 2.1.4.1.3.1 Germany Sustainable Wire and Cable Market (by Raw Material), Volume and Value Data
- 2.1.4.1.3.2 Germany Sustainable Wire and Cable Market (by Product Type), Volume and Value Data
- 2.1.4.1.3.3 Germany Sustainable Wire and Cable Market (by Voltage Type), Volume and Value Data
- 2.1.4.1.3.4 Germany Sustainable Wire and Cable Market (by Conductor Count), Volume and Value Data
- 2.1.4.1.1 Market
- 2.1.4.2 France
- 2.1.4.2.1 Market
- 2.1.4.2.1.1 Buyer Attributes
- 2.1.4.2.1.2 Key Manufacturers/Suppliers in France
- 2.1.4.2.1.3 Business Challenges
- 2.1.4.2.1.4 Business Drivers
- 2.1.4.2.2 Application
- 2.1.4.2.2.1 France Sustainable Wire and Cable Market (by End User), Volume and Value Data
- 2.1.4.2.2.2 France Sustainable Wire and Cable Market (by Application), Volume and Value Data
- 2.1.4.2.2.3 France Sustainable Wire and Cable Market (by Installation Type), Volume and Value Data
- 2.1.4.2.3 Product
- 2.1.4.2.3.1 France Sustainable Wire and Cable Market (by Raw Material), Volume and Value Data
- 2.1.4.2.3.2 France Sustainable Wire and Cable Market (by Product Type), Volume and Value Data
- 2.1.4.2.3.3 France Sustainable Wire and Cable Market (by Voltage Type), Volume and Value Data
- 2.1.4.2.3.4 France Sustainable Wire and Cable Market (by Conductor Count), Volume and Value Data
- 2.1.4.2.1 Market
- 2.1.4.3 Italy
- 2.1.4.3.1 Market
- 2.1.4.3.1.1 Buyer Attributes
- 2.1.4.3.1.2 Key Manufacturers/Suppliers in Italy
- 2.1.4.3.1.3 Business Challenges
- 2.1.4.3.1.4 Business Drivers
- 2.1.4.3.2 Application
- 2.1.4.3.2.1 Italy Sustainable Wire and Cable Market (by End User), Volume and Value Data
- 2.1.4.3.2.2 Italy Sustainable Wire and Cable Market (by Application), Volume and Value Data
- 2.1.4.3.2.3 Italy Sustainable Wire and Cable Market (by Installation Type), Volume and Value Data
- 2.1.4.3.3 Product
- 2.1.4.3.3.1 Italy Sustainable Wire and Cable Market (by Raw Material), Volume and Value Data
- 2.1.4.3.3.2 Italy Sustainable Wire and Cable Market (by Product Type), Volume and Value Data
- 2.1.4.3.3.3 Italy Sustainable Wire and Cable Market (by Voltage Type), Volume and Value Data
- 2.1.4.3.3.4 Italy Sustainable Wire and Cable Market (by Conductor Count), Volume and Value Data
- 2.1.4.3.1 Market
- 2.1.4.4 Spain
- 2.1.4.4.1 Market
- 2.1.4.4.1.1 Buyer Attributes
- 2.1.4.4.1.2 Key Manufacturers/Suppliers in Spain
- 2.1.4.4.1.3 Business Challenges
- 2.1.4.4.1.4 Business Drivers
- 2.1.4.4.2 Application
- 2.1.4.4.2.1 Spain Sustainable Wire and Cable Market (by End User), Volume and Value Data
- 2.1.4.4.2.2 Spain Sustainable Wire and Cable Market (by Application), Volume and Value Data
- 2.1.4.4.2.3 Spain Sustainable Wire and Cable Market (by Installation Type), Volume and Value Data
- 2.1.4.4.3 Product
- 2.1.4.4.3.1 Spain Sustainable Wire and Cable Market (by Raw Material), Volume and Value Data
- 2.1.4.4.3.2 Spain Sustainable Wire and Cable Market (by Product Type), Volume and Value Data
- 2.1.4.4.3.3 Spain Sustainable Wire and Cable Market (by Voltage Type), Volume and Value Data
- 2.1.4.4.3.4 Spain Sustainable Wire and Cable Market (by Conductor Count), Volume and Value Data
- 2.1.4.4.1 Market
- 2.1.4.5 Rest-of-Europe
- 2.1.4.5.1 Market
- 2.1.4.5.1.1 Buyer Attributes
- 2.1.4.5.1.2 Key Manufacturers/Suppliers in Rest-of-Europe
- 2.1.4.5.1.3 Business Challenges
- 2.1.4.5.1.4 Business Drivers
- 2.1.4.5.2 Application
- 2.1.4.5.2.1 Rest-of-Europe Sustainable Wire and Cable Market (by End User), Volume and Value Data
- 2.1.4.5.2.2 Rest-of-Europe Sustainable Wire and Cable Market (by Application), Volume and Value Data
- 2.1.4.5.2.3 Rest-of-Europe Sustainable Wire and Cable Market (by Installation Type), Volume and Value Data
- 2.1.4.5.3 Product
- 2.1.4.5.3.1 Rest-of-Europe Sustainable Wire and Cable Market (by Raw Material), Volume and Value Data
- 2.1.4.5.3.2 Rest-of-Europe Sustainable Wire and Cable Market (by Product Type), Volume and Value Data
- 2.1.4.5.3.3 Rest-of-Europe Sustainable Wire and Cable Market (by Voltage Type), Volume and Value Data
- 2.1.4.5.3.4 Rest-of-Europe Sustainable Wire and Cable Market (by Conductor Count), Volume and Value Data
- 2.1.4.5.1 Market
- 2.1.4.1 Germany
- 2.1.1 Market
- 2.2 U.K.
- 2.2.1 Market
- 2.2.1.1 Buyer Attributes
- 2.2.1.2 Key Manufacturers/Suppliers in the U.K.
- 2.2.1.3 Business Challenges
- 2.2.1.4 Business Drivers
- 2.2.2 Application
- 2.2.2.1 U.K. Sustainable Wire and Cable Market (by End User), Volume and Value Data
- 2.2.2.2 U.K. Sustainable Wire and Cable Market (by Application), Volume and Value Data
- 2.2.2.3 U.K. Sustainable Wire and Cable Market (by Installation Type), Volume and Value Data
- 2.2.3 Product
- 2.2.3.1 U.K. Sustainable Wire and Cable Market (by Raw Material), Volume and Value Data
- 2.2.3.2 U.K. Sustainable Wire and Cable Market (by Product Type), Volume and Value Data
- 2.2.3.3 U.K. Sustainable Wire and Cable Market (by Voltage Type), Volume and Value Data
- 2.2.3.4 U.K. Sustainable Wire and Cable Market (by Conductor Count), Volume and Value Data
- 2.2.1 Market
3 Markets-- Competitive Benchmarking & Company Profiles
- 3.1 Competitive Benchmarking
- 3.1.1 Competitive Position Matrix
- 3.1.2 Product Matrix of Key Companies
- 3.1.3 Market Share Analysis of Key Companies
- 3.2 Company Profiles
- 3.2.1 Prysmian Group
- 3.2.1.1 Company Overview
- 3.2.1.1.1 Role of Prysmian Group in Sustainable Wire and Cable Market
- 3.2.1.1.2 Product Portfolio
- 3.2.1.2 Production Sites and R&D Analysis
- 3.2.1.3 Analyst View
- 3.2.1.1 Company Overview
- 3.2.2 TFKable
- 3.2.2.1 Company Overview
- 3.2.2.1.1 Role of TFKable in Sustainable Wire and Cable Market
- 3.2.2.1.2 Product Portfolio
- 3.2.2.2 Business Strategies
- 3.2.2.2.1 TFKable: Product Development
- 3.2.2.3 Production Sites
- 3.2.2.4 Analyst View
- 3.2.2.1 Company Overview
- 3.2.3 LAPP Group
- 3.2.3.1 Company Overview
- 3.2.3.1.1 Role of LAPP Group in Sustainable Wire and Cable Market
- 3.2.3.1.2 Product Portfolio
- 3.2.3.2 Analyst View
- 3.2.3.1 Company Overview
- 3.2.4 SAB Brockskes GmbH & Co. KG
- 3.2.4.1 Company Overview
- 3.2.4.1.1 Role of SAB Brockskes GmbH & Co. KG in Sustainable Wire and Cable Market
- 3.2.4.1.2 Product Portfolio
- 3.2.4.2 Analyst View
- 3.2.4.1 Company Overview
- 3.2.1 Prysmian Group
4 Research Methodology
- 4.1 Data Sources
- 4.1.1 Primary Data Sources
- 4.1.2 Secondary Data Sources
- 4.2 Data Triangulation
- 4.3 Market Estimation and Forecast
- 4.3.1 Factors for Data Prediction and Modeling

