|
|
市場調査レポート
商品コード
1479773
再生可能化学品製造市場- 世界および地域別分析:用途別、製品別、地域別:分析と予測(2023年~2033年)Renewable Chemical Manufacturing Market - A Global and Regional Analysis: Focus on Application, Product, and Region - Analysis and Forecast, 2023-2033 |
||||||
|
|||||||
カスタマイズ可能
|
|||||||

| 再生可能化学品製造市場- 世界および地域別分析:用途別、製品別、地域別:分析と予測(2023年~2033年) |
|
出版日: 2024年05月17日
発行: BIS Research
ページ情報: 英文 166 Pages
納期: 1~5営業日
|

全表示
- 概要
- 図表
- 目次
再生可能化学品セクターは、持続可能性への取り組み、バイオテクノロジーの革新、パイロットプラントや大規模生産プラントへの大規模投資による需要の増加に後押しされ、大幅な成長が見込まれています。
過去の課題から、バイオベースの化学物質の普及には慎重な見方が強かったのですが、現在では業界全体とその対象市場で投資活動が明らかに活発化しています。サプライチェーンの各段階における利害関係者は、持続可能な事業の重要性を認識し、環境責任に沿った目標を積極的に追求しています。このような危機感の高まりは、環境に優しい慣行への移行に対する共通の献身を浮き彫りにしています。
| 主要市場統計 | |
|---|---|
| 予測期間 | 2023年~2033年 |
| 2023年評価 | 958億7,000万米ドル |
| 2033年予測 | 2,541億5,600万米ドル |
| CAGR | 10.49% |
再生可能化学品セクターは、バイオベースポリマーへの関心の高まり、技術と技術革新の進歩、政府の支援的な政策と規制に後押しされ、急速に拡大しています。再生可能化学品への移行は、二酸化炭素排出量の削減、資源効率の向上、化石燃料への依存度の低減など、環境的・経済的に多くのメリットをもたらします。世界の持続可能性の重要性が高まる中、再生可能化学品製造市場は継続的な成長が見込まれています。さらに、業界関係者は、この分野の収益成長を促進するために、費用対効果、生産の拡張性、原料サプライチェーンの持続可能性の維持といった課題に取り組まなければなりません。
再生可能化学品製造市場の主な参入企業は、製品提供の幅を広げるために研究開発に多額の投資を行っており、この分野のさらなる成長を促進しています。これらの市場参入企業は、新製品の発売、契約締結、M&Aの推進、投資の拡大、他組織との協力関係の促進など、さまざまな戦略的取り組みを行っています。競争が激化する市場環境で成功を収めるには、再生可能化学品業界はコスト効率の高いソリューションを提供し、事業領域を拡大して成長を維持する必要があります。
当レポートでは、世界の再生可能化学品製造市場について調査し、市場の概要とともに、用途別、製品別、地域別の動向、および市場に参入する企業のプロファイルなどを提供しています。
目次
エグゼクティブサマリー
第1章 市場
- 動向:現在および将来の影響評価
- サプライチェーンの概要
- 研究開発レビュー
- 規制状況
- ステークホルダー分析
- 市場力学の概要
- スタートアップ資金調達の概要
- 再生可能エネルギー源を使用して製造された世界の化学品
第2章 用途
- 用途のセグメンテーション
- 用途の概要
- 世界の再生可能化学品製造市場(用途別)
第3章 製品
- 製品セグメンテーション
- 製品概要
- 世界の再生可能化学品製造市場(製品別)
第4章 地域
- 地域別概要
- 北米
- 欧州
- アジア太平洋
- その他の地域
第5章 市場-競合ベンチマーキングと企業プロファイル
- 今後の見通し
- 地理的評価
- BASF SE
- CropEnergies AG
- DSM
- amyris
- Braskem
- Evonik
- Novozymes A/S
- Cargill, Incorporated
- NatureWorks LLC
- ADM
- ARD
- OCI
- Mitsubishi Chemical Group Corporation
- Corbion
- Carbon Recycling International
第6章 調査手法
List of Figures
- Figure 1: Renewable Chemical Manufacturing Market (by Region), $Million, 2022, 2026, and 2033
- Figure 2: Renewable Chemical Manufacturing Market (by Application), $Million, 2022, 2026, and 2033
- Figure 3: Renewable Chemical Manufacturing Market (by Product Type), $Million, 2022, 2026, and 2033
- Figure 4: Renewable Chemical Manufacturing Market (by Feedstocks), $Million, 2022, 2026, and 2033
- Figure 5: Renewable Chemical Manufacturing Market, Recent Developments
- Figure 6: Willingness to Pay for Sustainable Packaging by Age
- Figure 7: Supply Chain and Risks within the Supply Chain
- Figure 8: Global Renewable Chemical Manufacturing Market (by Company), January 2020-January 2024
- Figure 9: Global Renewable Chemical Manufacturing Market (by Country), January 2020-January 2024
- Figure 10: U.S. Production and Consumption of Ethanol, 2000-2022
- Figure 11: Battery Demand by Region, GWh/Year, 2016-2022
- Figure 12: U.S. Renewable Chemical Manufacturing Market, $Million, 2022-2033
- Figure 13: Canada Renewable Chemical Manufacturing Market, $Million, 2022-2033
- Figure 14: Mexico Renewable Chemical Manufacturing Market, $Million, 2022-2033
- Figure 15: France Renewable Chemical Manufacturing Market, $Million, 2022-2033
- Figure 16: Germany Renewable Chemical Manufacturing Market, $Million, 2022-2033
- Figure 17: Spain Renewable Chemical Manufacturing Market, $Million, 2022-2033
- Figure 18: U.K. Renewable Chemical Manufacturing Market, $Million, 2022-2033
- Figure 19: Italy Renewable Chemical Manufacturing Market, $Million, 2022-2033
- Figure 20: Rest-of-Europe Renewable Chemical Manufacturing Market, $Million, 2022-2033
- Figure 21: China Renewable Chemical Manufacturing Market, $Million, 2022-2033
- Figure 22: India Renewable Chemical Manufacturing Market, $Million, 2022-2033
- Figure 23: Japan Renewable Chemical Manufacturing Market, $Million, 2022-2033
- Figure 24: Australia and New Zealand Renewable Chemical Manufacturing Market, $Million, 2022-2033
- Figure 25: Indonesia Renewable Chemical Manufacturing Market, $Million, 2022-2033
- Figure 26: Rest-of-Asia-Pacific Renewable Chemical Manufacturing Market, $Million, 2022-2033
- Figure 27: South America Renewable Chemical Manufacturing Market, $Million, 2022-2033
- Figure 28: Middle East and Africa Renewable Chemical Manufacturing Market, $Million, 2022-2033
- Figure 29: Strategic Initiatives, 2020-2024
- Figure 30: Share of Strategic Initiatives, 2020-2024
- Figure 31: Data Triangulation
- Figure 32: Top-Down and Bottom-Up Approach
- Figure 33: Assumptions and Limitations
List of Tables
- Table 1: Market Snapshot
- Table 2: Renewable Chemical Manufacturing Market, Opportunities
- Table 3: Global Pricing Forecast, $/Ton, 2022-2033
- Table 4: Regional Pricing Forecast, $/Ton, 2022-2033
- Table 5: Impact Analysis of Market Navigating Factors, 2023-2033
- Table 6: Startup Funding Summary
- Table 7: Global Chemical Manufactured by Renewable Energy Source, $Million, 2022-2033
- Table 8: Global Renewable Chemical Manufacturing Market (by Region), $Million, 2022-2033
- Table 9: North America Renewable Chemical Manufacturing Market (by Application), $Million, 2022-2033
- Table 10: North America Renewable Chemical Manufacturing Market (by Product Type), $Million, 2022-2033
- Table 11: North America Renewable Chemical Manufacturing Market (by Feedstocks), $Million, 2022-2033
- Table 12: U.S. Renewable Chemical Manufacturing Market (by Application), $Million, 2022-2033
- Table 13: U.S. Renewable Chemical Manufacturing Market (by Product Type), $Million, 2022-2033
- Table 14: U.S. Renewable Chemical Manufacturing Market (by Feedstocks), $Million, 2022-2033
- Table 15: Canada Renewable Chemical Manufacturing Market (by Application), $Million, 2022-2033
- Table 16: Canada Renewable Chemical Manufacturing Market (by Product Type), $Million, 2022-2033
- Table 17: Canada Renewable Chemical Manufacturing Market (by Feedstocks), $Million, 2022-2033
- Table 18: Mexico Renewable Chemical Manufacturing Market (by Application), $Million, 2022-2033
- Table 19: Mexico Renewable Chemical Manufacturing Market (by Product Type), $Million, 2022-2033
- Table 20: Mexico Renewable Chemical Manufacturing Market (by Feedstocks), $Million, 2022-2033
- Table 21: Europe Renewable Chemical Manufacturing Market (by Application), $Million, 2022-2033
- Table 22: Europe Renewable Chemical Manufacturing Market (by Product Type), $Million, 2022-2033
- Table 23: Europe Renewable Chemical Manufacturing Market (by Feedstocks), $Million, 2022-2033
- Table 24: France Renewable Chemical Manufacturing Market (by Application), $Million, 2022-2033
- Table 25: France Renewable Chemical Manufacturing Market (by Product Type), $Million, 2022-2033
- Table 26: France Renewable Chemical Manufacturing Market (by Feedstocks), $Million, 2022-2033
- Table 27: Germany Renewable Chemical Manufacturing Market (by Application), $Million, 2022-2033
- Table 28: Germany Renewable Chemical Manufacturing Market (by Product Type), $Million, 2022-2033
- Table 29: Germany Renewable Chemical Manufacturing Market (by Feedstocks), $Million, 2022-2033
- Table 30: Spain Renewable Chemical Manufacturing Market (by Application), $Million, 2022-2033
- Table 31: Spain Renewable Chemical Manufacturing Market (by Product Type), $Million, 2022-2033
- Table 32: Spain Renewable Chemical Manufacturing Market (by Feedstocks), $Million, 2022-2033
- Table 33: U.K. Renewable Chemical Manufacturing Market (by Application), $Million, 2022-2033
- Table 34: U.K. Renewable Chemical Manufacturing Market (by Product Type), $Million, 2022-2033
- Table 35: U.K. Renewable Chemical Manufacturing Market (by Feedstocks), $Million, 2022-2033
- Table 36: Italy Renewable Chemical Manufacturing Market (by Application), $Million, 2022-2033
- Table 37: Italy Renewable Chemical Manufacturing Market (by Product Type), $Million, 2022-2033
- Table 38: Italy Renewable Chemical Manufacturing Market (by Feedstocks), $Million, 2022-2033
- Table 39: Rest-of-Europe Renewable Chemical Manufacturing Market (by Application), $Million, 2022-2033
- Table 40: Rest-of-Europe Renewable Chemical Manufacturing Market (by Product Type), $Million, 2022-2033
- Table 41: Rest-of-Europe Renewable Chemical Manufacturing Market (by Feedstocks), $Million, 2022-2033
- Table 42: Asia-Pacific Renewable Chemical Manufacturing Market (by Application), $Million, 2022-2033
- Table 43: Asia-Pacific Renewable Chemical Manufacturing Market (by Product Type), $Million, 2022-2033
- Table 44: Asia-Pacific Renewable Chemical Manufacturing Market (by Feedstocks), $Million, 2022-2033
- Table 45: China Renewable Chemical Manufacturing Market (by Application), $Million, 2022-2033
- Table 46: China Renewable Chemical Manufacturing Market (by Product Type), $Million, 2022-2033
- Table 47: China Renewable Chemical Manufacturing Market (by Feedstocks), $Million, 2022-2033
- Table 48: India Renewable Chemical Manufacturing Market (by Application), $Million, 2022-2033
- Table 49: India Renewable Chemical Manufacturing Market (by Product Type), $Million, 2022-2033
- Table 50: India Renewable Chemical Manufacturing Market (by Feedstocks), $Million, 2022-2033
- Table 51: Japan Renewable Chemical Manufacturing Market (by Application), $Million, 2022-2033
- Table 52: Japan Renewable Chemical Manufacturing Market (by Product Type), $Million, 2022-2033
- Table 53: Japan Renewable Chemical Manufacturing Market (by Feedstocks), $Million, 2022-2033
- Table 54: Australia and New Zealand Renewable Chemical Manufacturing Market (by Application), $Million, 2022-2033
- Table 55: Australia and New Zealand Renewable Chemical Manufacturing Market (by Product Type), $Million, 2022-2033
- Table 56: Australia and New Zealand Renewable Chemical Manufacturing Market (by Feedstocks), $Million, 2022-2033
- Table 57: Indonesia Renewable Chemical Manufacturing Market (by Application), $Million, 2022-2033
- Table 58: Indonesia Renewable Chemical Manufacturing Market (by Product Type), $Million, 2022-2033
- Table 59: Indonesia Renewable Chemical Manufacturing Market (by Feedstocks), $Million, 2022-2033
- Table 60: Rest-of-Asia-Pacific Renewable Chemical Manufacturing Market (by Application), $Million, 2022-2033
- Table 61: Rest-of-Asia-Pacific Renewable Chemical Manufacturing Market (by Product Type), $Million, 2022-2033
- Table 62: Rest-of-Asia-Pacific Renewable Chemical Manufacturing Market (by Feedstocks), $Million, 2022-2033
- Table 63: Rest-of-the-World Renewable Chemical Manufacturing Market (by Application), $Million, 2022-2033
- Table 64: Rest-of-the-World Renewable Chemical Manufacturing Market (by Product Type), $Million, 2022-2033
- Table 65: Rest-of-the-World Renewable Chemical Manufacturing Market (by Feedstocks), $Million, 2022-2033
- Table 66: South America Renewable Chemical Manufacturing Market (by Application), $Million, 2022-2033
- Table 67: South America Renewable Chemical Manufacturing Market (by Product Type), $Million, 2022-2033
- Table 68: South America Renewable Chemical Manufacturing Market (by Feedstocks), $Million, 2022-2033
- Table 69: Middle East and Africa Renewable Chemical Manufacturing Market (by Application), $Million, 2022-2033
- Table 70: Middle East and Africa Renewable Chemical Manufacturing Market (by Product Type), $Million, 2022-2033
- Table 71: Middle East and Africa Renewable Chemical Manufacturing Market (by Feedstocks), $Million, 2022-2033
- Table 72: Market Share
Global Renewable Chemical Manufacturing Market Overview
The renewable chemicals sector is witnessing a significant upswing in growth, fueled by increasing demand driven by sustainability efforts, biotechnology innovations, and substantial investments in pilot and large-scale production plants. Past challenges have instilled caution about the widespread adoption of bio-based chemicals, but there's now a clear increase in investment activity evident throughout the industry and its target markets. Stakeholders at every stage of the supply chain are realizing the importance of sustainable operations and are actively pursuing goals aligned with environmental responsibility. This growing sense of urgency highlights a shared dedication to transitioning toward eco-friendlier practices.
Market Introduction
| KEY MARKET STATISTICS | |
|---|---|
| Forecast Period | 2023 - 2033 |
| 2023 Evaluation | $95,870.0 Million |
| 2033 Forecast | $2,54,156.0 Million |
| CAGR | 10.49% |
The renewable chemicals sector is seeing swift expansion, fueled by rising interest in bio-based polymers, advancements in technology and innovation, and supportive government policies and regulations. This transition toward renewable chemicals presents a host of environmental and economic advantages, such as lower carbon emissions, improved resource efficiency, and reduced dependence on fossil fuels. With global sustainability becoming increasingly important, the renewable chemical manufacturing market is set for continued growth. Furthermore, industry players must address challenges such as cost-effectiveness, scalability of production, and maintaining sustainability in feedstock supply chains to drive revenue growth in this sector.
Industrial Impact
Key players in the renewable chemical manufacturing market are heavily investing in research and development to broaden their product offerings, driving further growth in the sector. These market participants are engaging in various strategic initiatives, such as launching new products, forming contractual agreements, pursuing mergers and acquisitions, increasing investments, and fostering collaborations with other organizations. To thrive in an increasingly competitive market environment, the renewable chemicals industry must deliver cost-effective solutions to expand its reach and sustain growth.
One crucial business strategy employed by manufacturers in the renewable chemicals sector is local manufacturing to reduce operational costs, ultimately benefiting customers and bolstering market presence. Renewable chemicals have recently demonstrated significant medical benefits, further fueling market demand. Major players such as BioAmber (Canada), Corbion (Netherlands), Myriant Corporation (U.S.), Braskem (Brazil), Metabolix Inc. (U.S.), Mitsubishi Chemical Group Corporation (Japan), and BASF SE (Germany) are actively investing in research and development to stimulate market demand.
Established in 1983 and headquartered in Pune, Maharashtra, India, Praj Industries Limited is an Indian multinational company specializing in process and project engineering. With offices in South Africa, North America, Thailand, and other countries, Praj Industries offers a range of products, including ethanol plants, water and wastewater solutions, bioproducts, and research services. In July 2020, Praj Industries introduced its Bio-Prism portfolio, which is focused on manufacturing bio-based renewable chemicals and materials (RCM). This portfolio includes various bio-industrial products, with bioplastics being a primary focus, along with cellulose-lignin refinery products and specialty items. The launch of the Bio-Prism portfolio expands Praj Industries' product offerings and is expected to contribute to revenue growth.
Market Segmentation
Segmentation 1: by Application
- Transportation
- Agrochemical
- Food and Beverage
- Personal Care
- Pharmaceuticals
- Paints and Coatings
- Detergents and Cleaners
- Industrial
- Others
Transportation to Dominate the Global Renewable Chemical Manufacturing Market (by Application)
In 2022, the bio-based chemicals market was primarily driven by the transportation sector, spurred by the increasing demand for bio-based fuels. As the world's third-largest oil producer and largest oil exporter, Russia's conflict with Ukraine caused a surge in crude oil prices, escalating fuel and gas costs globally. Consequently, nations are increasingly seeking alternatives to fossil fuels to expedite the green transition and reduce dependency. Bioethanol has emerged as a promising solution due to its renewable nature and ability to enhance fuel efficiency while reducing emissions when blended with gasoline and petrol. In response, various countries are considering raising the bioethanol blending mandate to lower fuel prices and promote sustainability. For instance, to reduce the skyrocketing fuel prices in the U.S. caused by the Russian war in Ukraine, Joe Biden presented a new plan to increase the availability of gasoline blended with ethanol derived from corn in April 2022.
Segmentation 2: by Product Type
- Alcohols
- Organic Acids
- Polymers
- Others
Alcohol to Dominate the Global Renewable Chemical Manufacturing Market (by Product Type)
In 2022, the alcohol segment emerged as the dominant force in the renewable chemical manufacturing market, fueled by the escalating demand for alcohol, such as ethanol and methanol, across various sectors. Notably, the transportation and mobility segment has witnessed a notable shift toward the adoption of green methanol, driven by the pressing need to decarbonize the marine industry. Major players such as A.P. Moller - Maersk and Stena have made significant investments in embracing green methanol as a primary fuel for marine vessels. For instance, A.P. Moller - Maersk's substantial agreement with Orsted in March 2022, securing 300,000 tons of e-methanol annually for its fleet of 12 methanol-powered vehicles, underscores the industry's commitment to sustainability. This strategic move not only addresses the imperative to reduce carbon emissions but also reflects a broader momentum toward greener solutions in the transportation sector.
Segmentation 3: by Feedstocks
- Plant Oil
- Ligno
- Sugar
- Starch
- Biomass
- Others
Plant Oil Segment to Dominate the Global Renewable Chemical Manufacturing Market (by Feedstocks)
In 2022, plant oil feedstock emerged as the dominant force in the bio-based chemical market, driven by several key factors. Plant oils derived from renewable sources, such as soybean, palm, rapeseed, and sunflower, offer a promising solution due to their renewable nature and lower environmental footprint. Moreover, advancements in biotechnology and chemical engineering have enhanced the efficiency and cost-effectiveness of converting plant oils into bio-based chemicals.
Innovative processes, such as enzymatic hydrolysis and fermentation, have enabled the production of a wide range of bio-based products, including bioplastics, biofuels, and biochemicals, from plant oil feedstocks. These factors collectively propelled plant oil feedstock to the forefront of the bio-based chemical market in 2022, driving its widespread adoption and market dominance.
Segmentation 4: by Region
- North America: U.S., Canada, and Mexico
- Europe: France, Germany, Italy, Spain, U.K., and Rest-of-Europe
- Asia-Pacific: China, Japan, India, Australia and New Zealand, Indonesia, and Rest-of-Asia-Pacific
- Rest-of-the-World: South America and Middle East and Africa
North America has emerged as a leader in the renewable chemical manufacturing market due to a convergence of influential factors. The region's robust research and development infrastructure, particularly in biotechnology and chemical engineering, enables it to drive innovation and pioneer new products and processes. Moreover, the region benefits from supportive regulatory policies that incentivize sustainability and reduce reliance on fossil fuels, fostering investment and market growth.
For instance, as per the Constitutional Rights Foundation, San Francisco implemented a policy to prohibit the use of standard plastic bags commonly employed by supermarkets and major retailers for packaging and other purposes. The policy explicitly mandates that stores wishing to continue using bags must ensure they are exclusively crafted from recyclable paper or biodegradable plastics. Consequently, this regulation is expected to significantly impact the uptake and expansion of renewable chemicals across the U.S.
Recent Developments in the Global Renewable Chemical Manufacturing Market
- NatureWorks LLC, a prominent producer of low-carbon polylactic acid, unveiled its latest fully integrated manufacturing facility for Ingeo PLA Biopolymer in Thailand in November 2022. This expansion significantly bolstered its position in the renewable chemical manufacturing market.
- In September 2022, BASF SE revealed an inventive collaboration with RiKarbon, a startup technology company based in the U.S. RiKarbon possesses patented technology that is capable of transforming bio-waste into bio-based degradable emollients. Leveraging this partnership, BASF plans to utilize its manufacturing facilities to broaden its market reach.
- In October 2021, Mitsubishi Chemical Holdings, headquartered in Japan, unveiled its ambition to achieve zero greenhouse gas emissions throughout its group operations by 2050. A key aspect of this endeavor involves implementing eco-friendly production methods and transitioning to renewable energy sources. The company sees significant potential in the journey toward carbon-free production. At the heart of its plan is a commitment to invest approximately $875 million (100 billion yen) by 2030. These funds will support initiatives such as installing on-site solar panels and constructing a plastics plant designed to utilize spent vegetable oils.
Demand - Driver, Challenge, and Opportunity
Market Driver: Rising Awareness of Sustainable Products to Reduce Pollution
- This heightened awareness significantly influences purchasing decisions, prompting industries to adopt renewable chemicals in response to market demands. Companies are placing greater importance on sustainability to bolster their brand image and meet the evolving expectations of consumers.
- Moreover, stringent environmental regulations further incentivize the adoption of renewable chemicals. As awareness continues to grow, the market experiences consistent expansion, fostering innovation and investment in sustainable practices to address the demand for environment-friendly products.
Market Challenge: High Cost of Production Expenses in Renewable Chemicals
- The renewable chemical manufacturing market faces formidable challenges hindering its growth trajectory. Energy intensity and feedstock expenses contribute significantly, with renewable processes demanding more energy and intricate methods compared to conventional counterparts.
- Renewable chemicals face higher production costs due to complex manufacturing processes, expensive feedstock acquisition, and ongoing technology development. For instance, extracting fermentable sugars from plant material for bio-based chemicals incurs processing expenses. To mitigate these challenges, manufacturers can focus on improving process efficiency, optimizing resource usage, and integrating renewable energy sources into production, ultimately working toward more sustainable and cost-effective solutions.
Market Opportunity: Growth of the Electric Vehicle (EV) Industry
- The electric vehicle (EV) industry's rapid expansion acts as a significant catalyst for the growth of the renewable chemical manufacturing market. One of the pivotal drivers in this relationship is the increasing demand for lithium-ion batteries, primarily used in EVs.
- As reported by the International Energy Agency (IEA) in 2023, the remarkable growth of the automotive lithium-ion (Li-ion) battery is particularly driven by the expansion of electric vehicles worldwide. This surge, exemplified by a 65% increase in battery demand in 2022 alone, signifies a burgeoning market for energy storage solutions, consequently propelling the demand for chemicals integral to battery production.
- The dominance of traditional vehicles (82% market share as reported by IEA report, 2023) presents a substantial opportunity for EV battery chemical manufacturers due to the vast potential for growth as EV adoption rises. With shifting market dynamics favoring EVs and ongoing technological advancements, there's a sustained demand for EV battery chemicals. Manufacturers can capitalize on this by expanding production capacity, investing in R&D for superior battery materials, and diversifying their product offerings. This opportunity positions them to become key players in shaping the future of transportation.
How can this Report add value to an Organization?
Product/Innovation Strategy: The product segment helps the reader understand the different applications of renewable chemical manufacturing in the market. The market is poised for significant expansion with ongoing technological advancements, increased investments, and growing awareness of the use of renewable chemical manufacturing. Therefore, renewable chemical manufacturing is a high-investment and high-revenue generating model.
Growth/Marketing Strategy: The global renewable chemical manufacturing market is growing at a rapid pace. The market offers enormous opportunities for existing and emerging market players. Some of the strategies covered in this segment are mergers and acquisitions, product launches, partnerships and collaborations, business expansions, and investments. The strategies preferred by companies to maintain and strengthen their market position primarily include partnerships and collaborations.
Competitive Strategy: The key players in the global renewable chemical manufacturing market analyzed and profiled in the study include renewable chemical manufacturing projects. Additionally, a comprehensive competitive landscape such as partnerships, agreements, and collaborations are expected to aid the reader in understanding the untapped revenue pockets in the market.
Research Methodology
Factors for Data Prediction and Modeling
- The base currency considered for the market analysis is US$. Currencies other than the US$ have been converted to the US$ for all statistical calculations, considering the average conversion rate for that particular year.
- The currency conversion rate has been taken from the historical exchange rate of the Oanda website.
- Nearly all the recent developments from January 2020 to January 2024 have been considered in this research study.
- The information rendered in the report is a result of in-depth primary interviews, surveys, and secondary analysis.
- Where relevant information was not available, proxy indicators and extrapolation were employed.
- Any economic downturn in the future has not been taken into consideration for the market estimation and forecast.
- Technologies currently used are expected to persist through the forecast with no major technological breakthroughs.
Market Estimation and Forecast
This research study involves the usage of extensive secondary sources, such as certified publications, articles from recognized authors, white papers, annual reports of companies, directories, and major databases to collect useful and effective information for an extensive, technical, market-oriented, and commercial study of the global renewable chemical manufacturing market.
The process of market engineering involves the calculation of the market statistics, market size estimation, market forecast, market crackdown, and data triangulation (the methodology for such quantitative data processes is explained in further sections). The primary research study has been undertaken to gather information and validate the market numbers for segmentation types and industry trends of the key players in the market.
Primary Research
The primary sources involve industry experts from the global renewable chemical manufacturing market and various stakeholders in the ecosystem. Respondents such as CEOs, vice presidents, marketing directors, and technology and innovation directors have been interviewed to obtain and verify both qualitative and quantitative aspects of this research study.
The key data points taken from primary sources include:
- validation and triangulation of all the numbers and graphs
- validation of reports segmentation and key qualitative findings
- understanding the competitive landscape
- validation of the numbers of various markets for market type
- percentage split of individual markets for geographical analysis
Secondary Research
This research study involves the usage of extensive secondary research, directories, company websites, and annual reports. It also makes use of databases, such as Hoovers, Bloomberg, Businessweek, and Factiva, to collect useful and effective information for an extensive, technical, market-oriented, and commercial study of the global market. In addition to the aforementioned data sources, the study has been undertaken with the help of other data sources and websites, such as GFI and the Delft University of Technology.
Secondary research was done in order to obtain crucial information about the industry's value chain, revenue models, the market's monetary chain, the total pool of key players, and the current and potential use cases and applications.
The key data points taken from secondary research include:
- segmentations and percentage shares
- data for market value
- key industry trends of the top players of the market
- qualitative insights into various aspects of the market, key trends, and emerging areas of innovation
- quantitative data for mathematical and statistical calculations
Key Market Players and Competition Synopsis
The companies that are profiled have been selected based on inputs gathered from primary experts and analyzing company coverage, product portfolio, and market penetration.
Leading Companies in the Renewable Chemical Manufacturing Market
- BASF SE
- CropEnergies AG
- DSM
- amyris
- Braskem
- Evonik
- Novozymes A/S
- Cargill, Incorporated
- NatureWorks LLC
- ADM
- ARD
- OCI
- Mitsubishi Chemical Group Corporation
- Carbon Recycling International
- Corbion
Companies that are not a part of the aforementioned pool have been well represented across different sections of the report (wherever applicable).
Table of Contents
Executive Summary
Scope and Definition
1 Markets
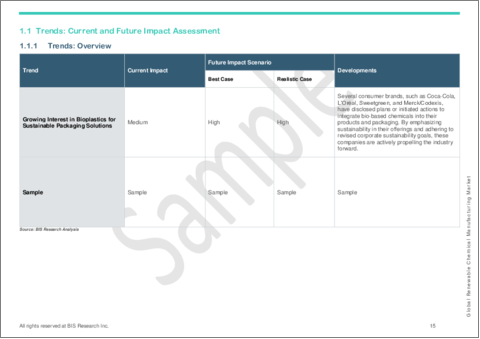
- 1.1 Trends: Current and Future Impact Assessment
- 1.1.1 Trends: Overview
- 1.1.1.1 Growing Interest in Bioplastics for Sustainable Packaging Solutions
- 1.1.1.2 Regulatory Support Driving Investment and Market Growth in Renewable Chemicals
- 1.1.1 Trends: Overview
- 1.2 Supply Chain Overview
- 1.2.1 Value Chain Analysis
- 1.2.2 Pricing Forecast
- 1.2.2.1 Global Pricing Forecast
- 1.2.2.2 Regional Pricing Forecast
- 1.3 Research and Development Review
- 1.3.1 Patent Filing Trend (by Company)
- 1.3.2 Patent Filing Trend (by Country)
- 1.4 Regulatory Landscape
- 1.5 Stakeholder Analysis
- 1.6 Market Dynamics Overview
- 1.6.1 Market Drivers
- 1.6.1.1 Rising Awareness of Sustainable Products to Reduce Pollution
- 1.6.1.2 Increasing Demand for Renewable Alcohol
- 1.6.2 Market Restraints
- 1.6.2.1 High Cost of Production Expenses in Renewable Chemicals
- 1.6.2.2 Lack of Standardized Regulations and Stringent Regulations Associated with Environment Safety
- 1.6.3 Market Opportunities
- 1.6.3.1 Growth of the Electric Vehicle (EV) Industry
- 1.6.3.2 Growth in Technological Innovations
- 1.6.1 Market Drivers
- 1.7 Startup Funding Summary
- 1.8 Global Chemical Manufactured using Renewable Energy Source
- 1.8.1 Hydropower
- 1.8.2 Wind
- 1.8.3 Solar Energy
- 1.8.4 Others
- 1.8.5 Global Chemical Manufactured using Renewable Energy Source
2 Application
- 2.1 Application Segmentation
- 2.2 Application Summary
- 2.3 Global Renewable Chemical Manufacturing Market (by Application)
- 2.3.1 Application
- 2.3.1.1 Transportation
- 2.3.1.2 Agrochemical
- 2.3.1.3 Food and Beverage
- 2.3.1.4 Personal Care
- 2.3.1.5 Pharmaceuticals
- 2.3.1.6 Paints and Coatings
- 2.3.1.7 Detergents and Cleaners
- 2.3.1.8 Industrial
- 2.3.1.9 Others
- 2.3.1 Application
3 Products
- 3.1 Product Segmentation
- 3.2 Product Summary
- 3.2.1 Product Type
- 3.2.2 Feedstocks
- 3.3 Global Renewable Chemical Manufacturing Market (by Product)
- 3.3.1 Product Type
- 3.3.1.1 Alcohols
- 3.3.1.1.1 Ethanol
- 3.3.1.1.2 Butanol
- 3.3.1.1.3 Methanol
- 3.3.1.1.4 Others
- 3.3.1.2 Organic Acids
- 3.3.1.2.1 Acetic Acid
- 3.3.1.2.2 Lactic Acid
- 3.3.1.2.3 Succinic Acid
- 3.3.1.2.4 Others
- 3.3.1.3 Polymers
- 3.3.1.3.1 Polyethylene (PE)
- 3.3.1.3.2 Polyamide (PA)
- 3.3.1.3.3 Polyethylene Terephthalate (PET)
- 3.3.1.3.4 Polylactic Acid (PLA)
- 3.3.1.3.5 Polyurethane (PU)
- 3.3.1.3.6 Others
- 3.3.1.4 Others
- 3.3.1.1 Alcohols
- 3.3.2 Feedstocks
- 3.3.2.1 Plant Oil
- 3.3.2.2 Ligno
- 3.3.2.3 Sugar
- 3.3.2.4 Starch
- 3.3.2.5 Biomass
- 3.3.2.6 Others
- 3.3.1 Product Type
4 Regions
- 4.1 Regional Summary
- 4.2 North America
- 4.2.1 Regional Overview
- 4.2.2 Driving Factors for Market Growth
- 4.2.3 Factors Challenging the Market
- 4.2.4 Application
- 4.2.5 Product
- 4.2.6 U.S.
- 4.2.7 Canada
- 4.2.8 Mexico
- 4.3 Europe
- 4.3.1 Regional Overview
- 4.3.2 Driving Factors for Market Growth
- 4.3.3 Factors Challenging the Market
- 4.3.4 Application
- 4.3.5 Product
- 4.3.6 France
- 4.3.7 Germany
- 4.3.8 Spain
- 4.3.9 U.K.
- 4.3.10 Italy
- 4.3.11 Rest-of-Europe
- 4.4 Asia-Pacific
- 4.4.1 Regional Overview
- 4.4.2 Driving Factors for Market Growth
- 4.4.3 Factors Challenging the Market
- 4.4.4 Application
- 4.4.5 Product
- 4.4.6 China
- 4.4.7 India
- 4.4.8 Japan
- 4.4.9 Australia and New Zealand
- 4.4.10 Indonesia
- 4.4.11 Rest-of-Asia-Pacific
- 4.5 Rest-of-the-World
- 4.5.1 Regional Overview
- 4.5.2 Driving Factors for Market Growth
- 4.5.3 Factors Challenging the Market
- 4.5.4 Application
- 4.5.5 Product
- 4.5.6 South America
- 4.5.7 Middle East and Africa
5 Markets - Competitive Benchmarking & Company Profiles
- 5.1 Next Frontiers
- 5.2 Geographic Assessment
- 5.2.1 BASF SE
- 5.2.1.1 Overview
- 5.2.1.2 Top Products/Product Portfolio
- 5.2.1.3 Top Competitors
- 5.2.1.4 Target Customers
- 5.2.1.5 Key Personnel
- 5.2.1.6 Analyst View
- 5.2.1.7 Market Share, 2023
- 5.2.2 CropEnergies AG
- 5.2.2.1 Overview
- 5.2.2.2 Top Products/Product Portfolio
- 5.2.2.3 Top Competitors
- 5.2.2.4 Target Customers
- 5.2.2.5 Key Personnel
- 5.2.2.6 Analyst View
- 5.2.2.7 Market Share, 2023
- 5.2.3 DSM
- 5.2.3.1 Overview
- 5.2.3.2 Top Products/Product Portfolio
- 5.2.3.3 Top Competitors
- 5.2.3.4 Target Customers
- 5.2.3.5 Key Personnel
- 5.2.3.6 Analyst View
- 5.2.3.7 Market Share, 2023
- 5.2.4 amyris
- 5.2.4.1 Overview
- 5.2.4.2 Top Products/Product Portfolio
- 5.2.4.3 Top Competitors
- 5.2.4.4 Target Customers
- 5.2.4.5 Key Personnel
- 5.2.4.6 Analyst View
- 5.2.4.7 Market Share, 2023
- 5.2.5 Braskem
- 5.2.5.1 Overview
- 5.2.5.2 Top Products/Product Portfolio
- 5.2.5.3 Top Competitors
- 5.2.5.4 Target Customers
- 5.2.5.5 Key Personnel
- 5.2.5.6 Analyst View
- 5.2.5.7 Market Share, 2023
- 5.2.6 Evonik
- 5.2.6.1 Overview
- 5.2.6.2 Top Products/Product Portfolio
- 5.2.6.3 Top Competitors
- 5.2.6.4 Target Customers
- 5.2.6.5 Key Personnel
- 5.2.6.6 Analyst View
- 5.2.6.7 Market Share, 2023
- 5.2.7 Novozymes A/S
- 5.2.7.1 Overview
- 5.2.7.2 Top Products/Product Portfolio
- 5.2.7.3 Top Competitors
- 5.2.7.4 Target Customers
- 5.2.7.5 Key Personnel
- 5.2.7.6 Analyst View
- 5.2.7.7 Market Share, 2023
- 5.2.8 Cargill, Incorporated
- 5.2.8.1 Overview
- 5.2.8.2 Top Products/Product Portfolio
- 5.2.8.3 Top Competitors
- 5.2.8.4 Target Customers
- 5.2.8.5 Key Personnel
- 5.2.8.6 Analyst View
- 5.2.8.7 Market Share, 2023
- 5.2.9 NatureWorks LLC
- 5.2.9.1 Overview
- 5.2.9.2 Top Products/Product Portfolio
- 5.2.9.3 Top Competitors
- 5.2.9.4 Target Customers
- 5.2.9.5 Key Personnel
- 5.2.9.6 Analyst View
- 5.2.9.7 Market Share, 2023
- 5.2.10 ADM
- 5.2.10.1 Overview
- 5.2.10.2 Top Products/Product Portfolio
- 5.2.10.3 Top Competitors
- 5.2.10.4 Target Customers
- 5.2.10.5 Key Personnel
- 5.2.10.6 Analyst View
- 5.2.10.7 Market Share, 2023
- 5.2.11 ARD
- 5.2.11.1 Overview
- 5.2.11.2 Top Products/Product Portfolio
- 5.2.11.3 Top Competitors
- 5.2.11.4 Target Customers
- 5.2.11.5 Analyst View
- 5.2.11.6 Market Share, 2023
- 5.2.12 OCI
- 5.2.12.1 Overview
- 5.2.12.2 Top Products/Product Portfolio
- 5.2.12.3 Top Competitors
- 5.2.12.4 Target Customers
- 5.2.12.5 Key Personnel
- 5.2.12.6 Analyst View
- 5.2.12.7 Market Share, 2023
- 5.2.13 Mitsubishi Chemical Group Corporation
- 5.2.13.1 Overview
- 5.2.13.2 Top Products/Product Portfolio
- 5.2.13.3 Top Competitors
- 5.2.13.4 Target Customers
- 5.2.13.5 Key Personnel
- 5.2.13.6 Analyst View
- 5.2.13.7 Market Share, 2023
- 5.2.14 Corbion
- 5.2.14.1 Overview
- 5.2.14.2 Top Products/Product Portfolio
- 5.2.14.3 Top Competitors
- 5.2.14.4 Target Customers
- 5.2.14.5 Key Personnel
- 5.2.14.6 Analyst View
- 5.2.14.7 Market Share, 2023
- 5.2.15 Carbon Recycling International
- 5.2.15.1 Overview
- 5.2.15.2 Top Products/Product Portfolio
- 5.2.15.3 Top Competitors
- 5.2.15.4 Target Customers
- 5.2.15.5 Key Personnel
- 5.2.15.6 Analyst View
- 5.2.15.7 Market Share, 2023
- 5.2.1 BASF SE
6 Research Methodology
- 6.1 Data Sources
- 6.1.1 Primary Data Sources
- 6.1.2 Secondary Data Sources
- 6.1.3 Data Triangulation
- 6.2 Market Estimation and Forecast

