|
|
市場調査レポート
商品コード
1477895
欧州のリグノ燃料市場:由来別、加工技術別、エンドユーザー別、国別:分析と予測(2023年~2032年)Europe Lignofuels Market: Focus on Source, Processing Technology, End User, and Country - Analysis and Forecast, 2023-2032 |
||||||
|
|||||||
カスタマイズ可能
|
|||||||

| 欧州のリグノ燃料市場:由来別、加工技術別、エンドユーザー別、国別:分析と予測(2023年~2032年) |
|
出版日: 2024年05月13日
発行: BIS Research
ページ情報: 英文 79 Pages
納期: 1~5営業日
|

全表示
- 概要
- 図表
- 目次
欧州リグノ燃料の市場規模(英国を除く)は、2023年の8億1,610万米ドルから2032年には15億920万米ドルに達し、予測期間の2023年~2032年のCAGRは7.07%になると予測されています。
現在進行中の研究開発の進歩により、リグノ燃料の生産方法がより高度になり、費用対効果と効率が改善され、それが市場開発を後押ししています。フィンランドのNeste Porvoo Refineryのような施設に代表される、統合バイオリファイナリーで採用されている最先端技術は、バイオ燃料生成のためのリグノセルロース系原料の使用を示しています。支援的な政策とインセンティブが、リグノ燃料セクターの成長をさらに加速させています。
| 主要市場統計 | |
|---|---|
| 予測期間 | 2023年~2032年 |
| 2023年の評価 | 8億1,610万米ドル |
| 2032年予測 | 15億920万米ドル |
| CAGR | 7.07% |
欧州のリグノ燃料市場は、技術的進歩と規制支援策によって変革期を迎えています。継続的な研究開発努力により、生産プロセスの効率化が進み、リグノ燃料は持続可能なエネルギーへのシフトの礎石として位置づけられています。
最先端の技術は、バイオ燃料生成のためのリグノセルロース資源の可能性を実証しています。欧州では、厳しい排出規制とともに、環境の持続可能性への取り組みが、リグノ燃料セクターの大幅な成長を促しています。この急成長市場は、投資家やメーカーを含む利害関係者にとって、より環境に優しいエネルギーの未来への移行を進める上で有望な展望を提供しています。
当レポートでは、欧州のリグノ燃料市場について調査し、市場の概要とともに、由来別、加工技術別、エンドユーザー別、国別の動向、および市場に参入する企業のプロファイルなどを提供しています。
目次
エグゼクティブサマリー
調査範囲
第1章 市場
- 業界展望
- ビジネスダイナミクス
- スタートアップの情勢
第2章 地域
- 欧州
- 英国
第3章 市場-競合ベンチマーキングと企業プロファイル
- 競合ベンチマーキング
- 競争ポジションマトリックス
- 企業プロファイル
- Clariant AG
- Lessaffre
- Axens
第4章 調査手法
List of Figures
- Figure 1: Europe Lignofuels Market, $Million, 2022, 2023, and 2032
- Figure 2: Europe Lignofuels Market (by End User), $Million, 2022 and 2032
- Figure 3: Europe Lignofuels Market (by Source), $Million, 2022 and 2032
- Figure 4: Europe Lignofuels Market (by Processing Technology), $Million, 2022 and 2032
- Figure 5: Lignofuels Market (by Region), $Million, 2022 and 2032
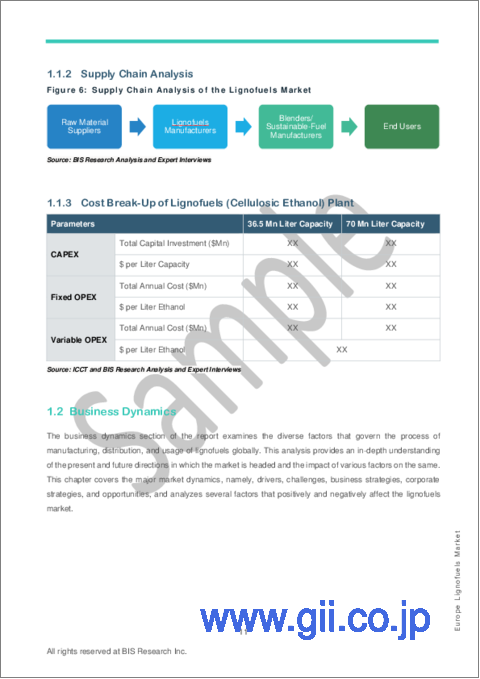
- Figure 6: Supply Chain Analysis of the Lignofuels Market
- Figure 7: Europe Lignofuels Market, $Million, 2022-2032
- Figure 8: Europe Market (by End User), Volume
- Figure 9: Europe Market (by End User), Value
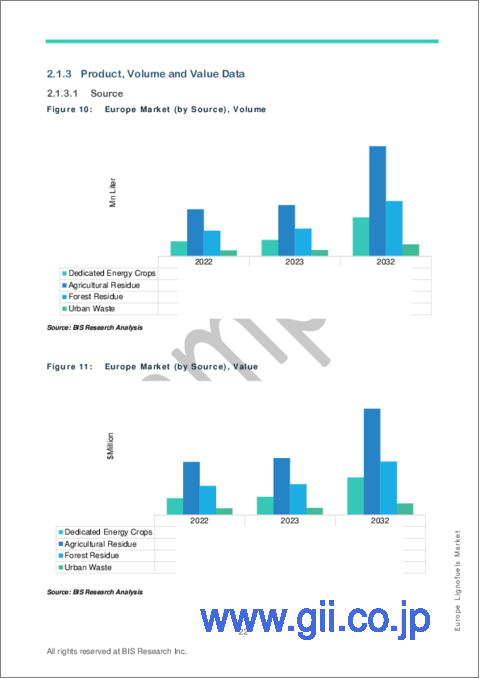
- Figure 10: Europe Market (by Source), Volume
- Figure 11: Europe Market (by Source), Value
- Figure 12: Europe Market (by Processing Technology), Volume
- Figure 13: Europe Market (by Processing Technology), Value
- Figure 14: Germany Lignofuels Market, $Million, 2022-2032
- Figure 15: Germany Market (by End User), Volume
- Figure 16: Germany Market (by End User), Value
- Figure 17: Germany Market (by Source), Volume
- Figure 18: Germany Market (by Source), Value
- Figure 19: Germany Market (by Processing Technology), Volume
- Figure 20: Germany Market (by Processing Technology), Value
- Figure 21: France Lignofuels Market, $Million, 2022-2032
- Figure 22: France Market (by End User), Volume
- Figure 23: France Market (by End User), Value
- Figure 24: France Market (by Source), Volume
- Figure 25: France Market (by Source), Value
- Figure 26: France Market (by Processing Technology), Volume
- Figure 27: France Market (by Processing Technology), Value
- Figure 28: Sweden Lignofuels Market, $Million, 2022-2032
- Figure 29: Sweden Market (by End User), Volume
- Figure 30: Sweden Market (by End User), Value
- Figure 31: Sweden Market (by Source), Volume
- Figure 32: Sweden Market (by Source), Value
- Figure 33: Sweden Market (by Processing Technology), Volume
- Figure 34: Sweden Market (by Processing Technology), Value
- Figure 35: Finland Lignofuels Market, $Million, 2022-2032
- Figure 36: Finland Market (by End User), Volume
- Figure 37: Finland Market (by End User), Value
- Figure 38: Finland Market (by Source), Volume
- Figure 39: Finland Market (by Source), Value
- Figure 40: Finland Market (by Processing Technology), Volume
- Figure 41: Finland Market (by Processing Technology), Value
- Figure 42: Rest-of-Europe Lignofuels Market, $Million, 2022-2032
- Figure 43: Rest-of-Europe Market (by End User), Volume
- Figure 44: Rest-of-Europe Market (by End User), Value
- Figure 45: Rest-of-Europe Market (by Source), Volume
- Figure 46: Rest-of-Europe Market (by Source), Value
- Figure 47: Rest-of-Europe Market (by Processing Technology), Volume
- Figure 48: Rest-of-Europe Market (by Processing Technology), Value
- Figure 49: U.K. Lignofuels Market, $Million, 2022-2032
- Figure 50: U.K. Market (by End User), Volume
- Figure 51: U.K. Market (by End User), Value
- Figure 52: U.K. Market (by Source), Volume
- Figure 53: U.K. Market (by Source), Value
- Figure 54: U.K. Market (by Processing Technology), Volume
- Figure 55: U.K. Market (by Processing Technology), Value
- Figure 56: Research Methodology
- Figure 57: Top-Down and Bottom-Up Approach
- Figure 58: Lignofuels Market: Influencing Factors
- Figure 59: Assumptions and Limitations
List of Tables
- Table 1: Key Product and Market Developments
- Table 2: Key Mergers and Acquisitions, Partnerships, and Joint Ventures
- Table 3: Lignofuels Market (by Region), Mn Liters, 2022-2032
- Table 4: Lignofuels Market (by Region), $Million, 2022-2032
- Table 5: Key funding details for cellulosic bio-ethanol (lignofuels):
Introduction to Europe Lignofuels Market
The Europe lignofuels market (excluding U.K.) is projected to reach $1,509.2 million by 2032 from $816.1 million in 2023, growing at a CAGR of 7.07% during the forecast period 2023-2032. Advancements in ongoing research and development have led to more advanced methods for producing lignofuels, improving their cost-effectiveness and efficiency, which in turn is boosting market growth. Cutting-edge technologies employed in integrated biorefineries, exemplified by facilities like the Neste Porvoo Refinery in Finland, showcase the use of lignocellulosic materials for biofuel generation. Supportive policies and incentives are further accelerating the growth of the lignofuels sector.
| KEY MARKET STATISTICS | |
|---|---|
| Forecast Period | 2023 - 2032 |
| 2023 Evaluation | $816.1 Million |
| 2032 Forecast | $1,509.2 Million |
| CAGR | 7.07% |
Market Introduction
The Europe lignofuels market is undergoing a transformative phase fueled by technological advancements and supportive regulatory measures. With continuous research and development efforts, production processes are becoming more efficient, positioning lignofuels as a cornerstone in the shift towards sustainable energy.
State-of-the-art technologies are demonstrating the potential of lignocellulosic sources for biofuel generation. Europe's dedication to environmental sustainability, alongside strict emissions regulations, is driving substantial growth in the lignofuels sector across the continent. This burgeoning market offers promising prospects for stakeholders, including investors and manufacturers, as they navigate the transition towards a greener energy future.
Market Segmentation:
Segmentation 1: by End User
- Automotive
- Aerospace
- Marine
Segmentation 2: by Source
- Dedicated Energy Crops
- Agricultural Residue
- Forest Residue
- Urban Waste
Segmentation 3: by Processing Technology
- Thermochemical
- Biochemical
Segmentation 4: by Country
- Germany
- France
- Sweden
- Finland
- Rest-of-Europe
How can this report add value to an organization?
Product/Innovation Strategy: The product segment helps the reader to understand the different sources and processing technology involved in the lignofuels market. The source segment has been segmented into dedicated energy crops, agricultural residue, forest residue, and urban waste. The processing technology segment has been segmented into thermochemical and biochemical. Moreover, the study provides the reader with a detailed understanding of the Europe lignofuels market based on end users, including automotive, aerospace, and marine. The increasing adoption of lignofuels in renewable diesel and sustainable aviation fuel is expected to fuel market growth in the future.
Growth/Marketing Strategy: The Europe lignofuels market has seen major development by key players operating in the market, such as business expansions, partnerships, collaborations, mergers and acquisitions, and joint ventures. The favored strategy for the companies has been business partnerships to strengthen their position in the lignofuels market.
Competitive Strategy: Key players in the Europe lignofuels market analyzed and profiled in the study involve lignofuels manufacturers and the overall ecosystem. Moreover, a detailed competitive benchmarking of the players operating in the lignofuels market has been done to help the reader understand how players stack against each other, presenting a clear market landscape. Additionally, comprehensive competitive strategies such as partnerships, agreements, acquisitions, and collaborations will aid the reader in understanding the untapped revenue pockets in the market.
Table of Contents
Executive Summary
Scope of the Study
1 Market
- 1.1 Industry Outlook
- 1.1.1 Trends: Current and Future
- 1.1.1.1 Market Competitiveness Promoting Commercial Deployment of Low-Cost Lignofuels
- 1.1.1.2 Sustainability Standards Playing a Vital Role in Promoting Lignofuels
- 1.1.2 Supply Chain Analysis
- 1.1.3 Cost Break-Up of Lignofuels (Cellulosic Ethanol) Plant
- 1.1.1 Trends: Current and Future
- 1.2 Business Dynamics
- 1.2.1 Business Drivers
- 1.2.1.1 Government Policies Benefiting Lignofuels
- 1.2.1.2 Collaborative Efforts of Government and Manufacturers for Promoting Sustainable Biofuels
- 1.2.1.3 Availability of Waste and Residues Feedstock to Benefit Lignofuels
- 1.2.2 Business Challenges
- 1.2.2.1 Slower Commercialization of Lignofuels
- 1.2.2.2 Variation in Feedstock Prices Across Regions and Countries
- 1.2.3 Business Strategies
- 1.2.3.1 Product and Market Developments
- 1.2.4 Corporate Strategies
- 1.2.4.1 Mergers and Acquisitions, Partnerships, and Joint Ventures
- 1.2.5 Business Opportunities
- 1.2.5.1 Trade Opportunities to Benefit Lignofuels
- 1.2.5.2 Mandates for Blending of Bioethanol
- 1.2.1 Business Drivers
- 1.3 Start-Up Landscape
- 1.3.1 Key Start-Ups in the Ecosystem
2 Regions
- 2.1 Europe
- 2.1.1 Market
- 2.1.1.1 Business Drivers
- 2.1.1.2 Business Challenges
- 2.1.2 Application, Volume and Value Data
- 2.1.2.1 End User
- 2.1.3 Product, Volume and Value Data
- 2.1.3.1 Source
- 2.1.3.2 Processing Technology
- 2.1.4 Europe (by Country)
- 2.1.4.1 Germany
- 2.1.4.1.1 Market
- 2.1.4.1.2 Application, Volume and Value Data
- 2.1.4.1.2.1 End User
- 2.1.4.1.3 Product, Volume and Value Data
- 2.1.4.1.3.1 Source
- 2.1.4.1.3.2 Processing Technology
- 2.1.4.2 France
- 2.1.4.2.1 Market
- 2.1.4.2.2 Application, Volume and Value Data
- 2.1.4.2.2.1 End User
- 2.1.4.2.3 Product, Volume and Value Data
- 2.1.4.2.3.1 Source
- 2.1.4.2.3.2 Processing Technology
- 2.1.4.3 Sweden
- 2.1.4.3.1 Market
- 2.1.4.3.2 Application, Volume and Value Data
- 2.1.4.3.2.1 End User
- 2.1.4.3.3 Product, Volume and Value Data
- 2.1.4.3.3.1 Source
- 2.1.4.3.3.2 Processing Technology
- 2.1.4.4 Finland
- 2.1.4.4.1 Market
- 2.1.4.4.2 Application, Volume and Value Data
- 2.1.4.4.2.1 End User
- 2.1.4.4.3 Product, Volume and Value Data
- 2.1.4.4.3.1 Source
- 2.1.4.4.3.2 Processing Technology
- 2.1.4.5 Rest-of-Europe
- 2.1.4.5.1 Market
- 2.1.4.5.2 Application, Volume and Value Data
- 2.1.4.5.2.1 End User
- 2.1.4.5.3 Product, Volume and Value Data
- 2.1.4.5.3.1 Source
- 2.1.4.5.3.2 Processing Technology
- 2.1.4.1 Germany
- 2.1.1 Market
- 2.2 U.K.
- 2.2.1 Market
- 2.2.1.1 Business Drivers
- 2.2.1.2 Business Challenges
- 2.2.2 Application, Volume and Value Data
- 2.2.2.1 End User
- 2.2.3 Product, Volume and Value Data
- 2.2.3.1 Source
- 2.2.3.2 Processing Technology
- 2.2.1 Market
3 Market - Competitive Benchmarking and Company Profiles
- 3.1 Competitive Benchmarking
- 3.1.1 Competitive Position Matrix
- 3.2 Company Profiles
- 3.2.1 Clariant AG
- 3.2.1.1 Overview
- 3.2.1.2 Top Products / Product Portfolio
- 3.2.1.3 Top Competitors
- 3.2.1.4 Target Clients/End User
- 3.2.1.5 Market Share
- 3.2.1.6 Analyst View
- 3.2.1.7 Key Personnel
- 3.2.2 Lessaffre
- 3.2.2.1 Overview
- 3.2.2.2 Top Products / Product Portfolio
- 3.2.2.3 Top Competitors
- 3.2.2.4 Target Clients/End User
- 3.2.2.5 Market Share
- 3.2.2.6 Analyst View
- 3.2.2.7 Key Personnel
- 3.2.3 Axens
- 3.2.3.1 Overview
- 3.2.3.2 Top Products / Product Portfolio
- 3.2.3.3 Top Competitors
- 3.2.3.4 Target Clients/End User
- 3.2.3.5 Market Share
- 3.2.3.6 Analyst Views
- 3.2.3.7 Key Personnel
- 3.2.1 Clariant AG
4 Research Methodology
- 4.1 Primary Data Sources
- 4.2 BIS Data Sources
- 4.3 Assumptions and Limitations
