|
|
市場調査レポート
商品コード
1462586
欧州の電子コネクタ市場:用途別、製品タイプ別、国別:分析と予測(2023年~2032年)Europe Electronic Connector Market: Focus on Application, Product Type, and Country - Analysis and Forecast, 2023-2032 |
||||||

|
|||||||
カスタマイズ可能
|
|||||||

| 欧州の電子コネクタ市場:用途別、製品タイプ別、国別:分析と予測(2023年~2032年) |
|
出版日: 2024年04月15日
発行: BIS Research
ページ情報: 英文 116 Pages
納期: 1~5営業日
|

全表示
- 概要
- 図表
- 目次
欧州の電子コネクタの市場規模(英国を除く)は、2023年の145億2,000万米ドルから2032年には220億9,000万米ドルに達すると予測され、予測期間のCAGRは4.78%になると予測されています。
欧州の電子コネクタ市場の拡大は、自動車・輸送、コンピューター・周辺機器、通信など、さまざまな用途で洗練された効果的な電子コネクタに対する需要の高まりによって推進されると予測されます。
| 主要市場統計 | |
|---|---|
| 予測期間 | 2023年~2032年 |
| 2023年の評価額 | 145億2,000万米ドル |
| 2032年予測 | 220億9,000万米ドル |
| CAGR | 4.78% |
欧州の電子コネクタ市場は、さまざまな要因によって急速に拡大しています。自動車、運輸、コンピュータ、通信など、さまざまな業界で革新的かつ効率的な電子コネクタに対する需要が高まり、この業界では採用が急増しています。電子コネクタは、さまざまな電子機器やシステムのシームレスな接続とデータ伝送を確保するために不可欠です。
電気自動車(EV)、自律走行システム、コネクテッドカーといった高度な技術の急速な統合を特徴とする欧州の自動車・運輸セクターは、電子コネクタの需要に大きく貢献しています。これらのコネクタは、エンターテインメント・システム、センサー、制御ユニットなどの自動車用電子機器において重要な部品であり、自動車の性能と利便性を向上させます。
さらに、スマートデバイス、IoT(モノのインターネット)、データセンターの成長は、コンピューティングおよび通信産業における電子コネクタの需要を増大させています。これらの接続は、スマートフォン、タブレット、サーバー、ネットワーク機器など、幅広い機器に信頼性の高い接続性と効率的なデータ転送を提供します。
全体として、欧州の電子コネクタ市場は、さまざまな産業において高品質で信頼性の高い電子コネクタソリューションへのニーズが高まっていることから、メーカーやサプライヤーにとって大きな可能性を秘めています。
当レポートでは、欧州の電子コネクタ市場について調査し、市場の概要とともに、用途別、製品タイプ別、国別の動向、および市場に参入する企業のプロファイルなどを提供しています。
目次
エグゼクティブサマリー
調査範囲
第1章 市場
- 業界展望
- ビジネスダイナミクス
第2章 地域
- 欧州
- 英国
第3章 市場-競合ベンチマーキングと企業プロファイル
- 競合ベンチマーキング
- 競争ポジションマトリックス
- 市場シェア分析
- 企業プロファイル
- TE Connectivity
- Aptiv PLC
- Rosenberger Group
- HARTING Technology Group
- Phoenix Contact
- HUBER+SUHNER
- Radiall
- LEMO Group
- Weidmuller Interface GmbH & Co. KG
- WAGO
第4章 調査手法
List of Figures
- Figure 1: Europe Electronic Connector Market Overview, $Billion, 2022-2032
- Figure 2: Europe Electronic Connector Market (by Product Type), $Billion, 2022-2032
- Figure 3: Europe Electronic Connector Market (by Application), $Billion, 2022-2032
- Figure 4: Electronic Connector Market (by Region), $Billion, 2022
- Figure 5: Key Companies Profiled
- Figure 6: Sale of Electric Vehicles, Million Units, 2020-2022
- Figure 7: Electronic Connector Market Supply Chain Analysis
- Figure 8: Business Dynamics for Electronic Connector Market
- Figure 9: Vehicle Production, Thousand Units, 2021 and 2022
- Figure 10: Installed Base of Connected Devices Worldwide (IoT), Billion Units, 2015-2025
- Figure 11: Clean Energy Investment in the Net Zero Pathway, $Trillion, 2016-2050
- Figure 12: Challenges for Electrical Connectors
- Figure 13: Effects and Preventive Measures of Corrosion in Electrical Connectors
- Figure 14: Key Business Strategies, 2020-2023
- Figure 15: Product Development (by Company), 2020-2023
- Figure 16: Market Development (by Company), 2020-2023
- Figure 17: Key Corporate Strategies, 2020-2023
- Figure 18: Mergers and Acquisitions (by Company), 2020-2023
- Figure 19: Partnerships, Joint Ventures, Collaborations, and Alliances (by Company), 2020-2023
- Figure 20: Key Applications of Micro Electrical Connectors in Various Industries
- Figure 21: Competitive Benchmarking for Electronic Connector Manufacturers in Europe
- Figure 22: Competitive Benchmarking for Electronic Connector Manufacturers in the U.K.
- Figure 23: Competitive Benchmarking
- Figure 24: TE Connectivity: R&D Expenditure, $Million, 2020-2022
- Figure 25: Aptiv PLC: R&D Expenditure, $Billion, 2020-2022
- Figure 26: HUBER+SUHNER: R&D Expenditure, $Million, 2020-2022
- Figure 27: Weidmuller Interface GmbH & Co. KG: R&D Expenditure, $Million, 2021-2022
- Figure 28: Data Triangulation
- Figure 29: Top-Down and Bottom-Up Approach
List of Tables
- Table 1: Europe Electronic Connector Market Overview
- Table 2: Consortiums, Associations, and Regulatory Bodies
- Table 3: Government Programs for Electronic Connectors
- Table 4: Programs by Research Institutions and Universities
- Table 5: Regulatory Landscape for Electronic Connector Market
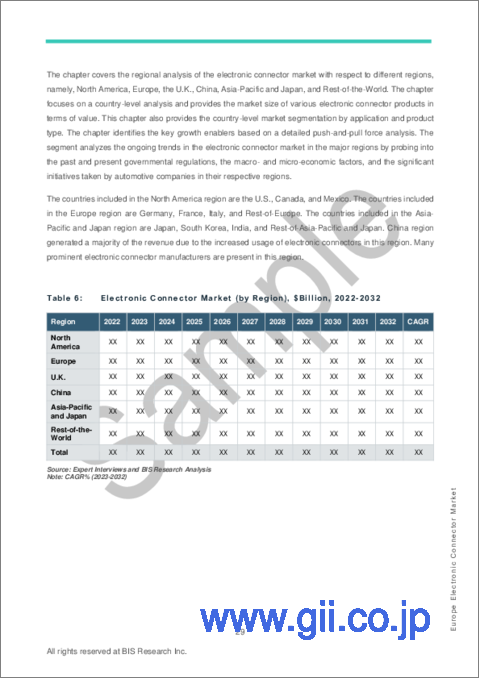
- Table 6: Electronic Connector Market (by Region), $Billion, 2022-2032
- Table 7: Europe Electronic Connector Market (by Application), $Billion, 2022-2032
- Table 8: Europe Electronic Connector Market (by Product Type), $Billion, 2022-2032
- Table 9: Germany Electronic Connector Market (by Application), $Billion, 2022-2032
- Table 10: Germany Electronic Connector Market (by Product Type), $Billion, 2022-2032
- Table 11: France Electronic Connector Market (by Application), $Billion, 2022-2032
- Table 12: France Electronic Connector Market (by Product Type), $Billion, 2022-2032
- Table 13: Italy Electronic Connector Market (by Application), $Billion, 2022-2032
- Table 14: Italy Electronic Connector Market (by Product Type), $Billion, 2022-2032
- Table 15: Rest-of-Europe Electronic Connector Market (by Application), $Billion, 2022-2032
- Table 16: Rest-of-Europe Electronic Connector Market (by Product Type), $Billion, 2022-2032
- Table 17: U.K. Electronic Connector Market (by Application), $Million, 2022-2032
- Table 18: U.K. Electronic Connector Market (by Product Type), $Million, 2022-2032
- Table 19: Market Share Analysis: Electronic Connector Market
- Table 20: TE Connectivity: Product Portfolio
- Table 21: TE Connectivity: Product Development
- Table 22: TE Connectivity: Mergers and Acquisitions
- Table 23: TE Connectivity: Partnerships, Joint Ventures, Collaborations, and Alliances
- Table 24: Aptiv PLC: Product Portfolio
- Table 25: Aptiv PLC: Mergers and Acquisitions
- Table 26: Rosenberger Group: Product Portfolio
- Table 27: Rosenberger Group: Product Development
- Table 28: Rosenberger Group: Market Development
- Table 29: Rosenberger Group: Partnerships, Joint Ventures, Collaborations, and Alliances
- Table 30: HARTING Technology Group: Product Portfolio
- Table 31: HARTING Technology Group: Product Development
- Table 32: HARTING Technology Group: Market Development
- Table 33: HARTING Technology Group: Partnerships, Joint Ventures, Collaborations, and Alliances
- Table 34: Phoenix Contact: Product Portfolio
- Table 35: Phoenix Contact: Product Development
- Table 36: Phoenix Contact: Partnerships, Joint Ventures, Collaborations, and Alliances
- Table 37: HUBER+SUHNER: Product Portfolio
- Table 38: HUBER+SUHNER: Mergers and Acquisitions
- Table 39: Radiall: Product Portfolio
- Table 40: Radiall: Mergers and Acquisitions
- Table 41: LEMO Group: Product Portfolio
- Table 42: LEMO Group: Product Development
- Table 43: Weidmuller Interface GmbH & Co. KG: Product Portfolio
- Table 44: Weidmuller Interface GmbH & Co. KG: Market Development
- Table 45: WAGO: Product Portfolio
Introduction to Europe Electronic Connector Market
The Europe electronic connector market (excluding U.K.) is projected to reach $22.09 billion by 2032 from $14.52 billion in 2023, growing at a CAGR of 4.78% during the forecast period 2023-2032. The expansion of the Europe electronic connector market is anticipated to be propelled by rising demand for sophisticated and effective electronic connectors across various applications, including automotive and transportation, computers and peripherals, and telecommunications.
| KEY MARKET STATISTICS | |
|---|---|
| Forecast Period | 2023 - 2032 |
| 2023 Evaluation | $14.52 Billion |
| 2032 Forecast | $22.09 Billion |
| CAGR | 4.78% |
Market Introduction
The electronic connection market in Europe is expanding rapidly, owing to a variety of causes. With rising demand for innovative and efficient electronic connections in a variety of industries, including automotive, transportation, computer, and telecommunications, the industry is seeing a spike in adoption. Electronic connectors are essential for ensuring seamless connectivity and data transmission in a variety of electronic devices and systems.
The automotive and transportation sector in Europe, which is characterized by the fast integration of sophisticated technologies such as electric vehicles (EVs), autonomous driving systems, and connected vehicles, contributes significantly to the demand for electronic connectors. These connectors are critical components in automotive electronics, including entertainment systems, sensors, and control units, which improve vehicle performance and usefulness.
Furthermore, the growth of smart devices, IoT (Internet of Things) applications, and data centers is increasing the demand for electronic connections in the computing and telecommunications industries. These connections provide dependable connectivity and efficient data transfer in a wide range of devices, including smartphones, tablets, servers, and networking equipment.
Furthermore, technical improvements such as electronic component shrinking, faster data transfer speeds, and better durability are influencing the evolution of Europe's electronic connection industry. Government actions to promote digitalization, as well as investments in infrastructure development, help to drive market growth.
Overall, the European electronic connector market offers considerable potential for manufacturers and suppliers to capitalize on the region's growing need for high-quality, dependable electronic connecting solutions across a variety of industries.
Market Segmentation:
Segmentation 1: by Application
- Computers and Peripherals
- Consumer Electronics
- Automotive and Transportation
- Telecom
- Energy and Power
- Others (Industrial, Military, and Medical, among others)
Segmentation 2: by Product Type
- I/O Connectors
- Printed Circuit Board (PCB) Connectors
- RF Coaxial Connectors
- Fiber Optic Connectors
- Others (Circular Connectors, Rectangular Connectors, and others)
Segmentation 3: by Country
- Germany
- France
- Italy
- Rest-of-Europe
How can this report add value to an organization?
Product/Innovation Strategy: The product segment helps the reader understand the different types of electronic connector products available by product type (I/O connectors, printed circuit board (PCB) connectors, RF coaxial connectors, fiber optic connectors, and others (circular connectors, rectangular connectors, and others)), by application (computers and peripherals, consumer electronics, automotive and transportation, telecom, energy and power, others (industrial, military, and medical, among others)). Increasing automotive and transportation demand worldwide is pushing the sales of electronic connector systems. Therefore, the electronic connector business is a high-investment and high-revenue generating model.
Growth/Marketing Strategy: The Europe electronic connector market is exponentially growing, with enormous opportunities for the market players. Some strategies covered in this segment are product launches, partnerships and collaborations, business expansions, and investments. The companies' preferred strategies have been product launches, partnerships, and collaborations to strengthen their positions in the Europe electronic connector market.
Competitive Strategy: Key players in the Europe electronic connector market analyzed and profiled in the study involve electronic connector-based product manufacturers and start-ups. Moreover, a detailed competitive benchmarking of the players operating in the Europe electronic connector market has been done to help the reader understand how players stack against each other, presenting a clear market landscape. Additionally, comprehensive competitive strategies such as partnerships, agreements, and collaborations will aid the reader in understanding the untapped revenue pockets in the market.
Key Market Players and Competition Synopsis
The companies that are profiled have been selected based on inputs gathered from primary experts and analyzing company coverage, type portfolio, and market penetration.
Some prominent names in the market include:
- Aptiv PLC
- Phoenix Contact
- Rosenberger Group
- HARTING Technology Group
Table of Contents
Executive Summary
Scope of the Study
1 Markets
- 1.1 Industry Outlook
- 1.1.1 Overview: Electronic Connector
- 1.1.2 Trends: Current and Future
- 1.1.2.1 Growing Numbers of Electric Vehicles Worldwide
- 1.1.2.2 Growing Demand for High-Speed Data Transfer
- 1.1.2.3 Evolution of Wireless Connectivity
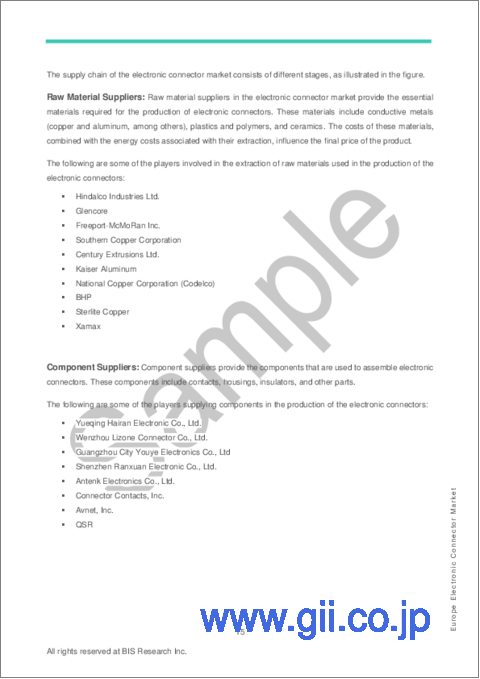
- 1.1.3 Supply Chain Analysis
- 1.1.4 Ecosystem/Ongoing Programs
- 1.1.4.1 Consortiums, Associations, and Regulatory Bodies
- 1.1.4.2 Government Programs
- 1.1.4.3 Programs by Research Institutions and Universities
- 1.1.5 Regulatory Landscape
- 1.1.5.1 Analyst View
- 1.2 Business Dynamics
- 1.2.1 Business Drivers
- 1.2.1.1 Rapidly Increasing Demand for Electrical Connectors in the Automotive Industry
- 1.2.1.2 Increasing Adoption of the Internet of Things (IoT)
- 1.2.1.3 Growing Demand for Renewable Energy Sources
- 1.2.2 Business Challenges
- 1.2.2.1 Intricate Design and Process of Manufacturing
- 1.2.2.2 Elevated Corrosion Levels and the Occurrence of Loose Connections
- 1.2.2.3 High Implementation Cost and Availability of Alternatives
- 1.2.3 Business Strategies
- 1.2.3.1 Product Development
- 1.2.3.2 Market Development
- 1.2.4 Corporate Strategies
- 1.2.4.1 Mergers and Acquisitions
- 1.2.4.2 Partnerships, Joint Ventures, Collaborations, and Alliances
- 1.2.5 Business Opportunities
- 1.2.5.1 Increasing Trend of Miniaturization in Electronics
- 1.2.5.2 Requirement of High-Performance Connectors in 5G Technology
- 1.2.1 Business Drivers
2 Regions
- 2.1 Europe
- 2.1.1 Market
- 2.1.1.1 Buyer Attributes
- 2.1.1.2 Key Suppliers and Product Manufacturers in Europe
- 2.1.1.3 Competitive Benchmarking
- 2.1.1.4 Business Challenges
- 2.1.1.5 Business Drivers
- 2.1.2 Application
- 2.1.2.1 Europe Electronic Connector Market (by Application), Value Data
- 2.1.3 Product
- 2.1.3.1 Europe Electronic Connector Market (by Product Type), Value Data
- 2.1.4 Europe: Country-Level Analysis
- 2.1.4.1 Germany
- 2.1.4.1.1 Market
- 2.1.4.1.1.1 Buyer Attributes
- 2.1.4.1.1.2 Key Suppliers and Product Manufacturers in Germany
- 2.1.4.1.1.3 Business Challenges
- 2.1.4.1.1.4 Business Drivers
- 2.1.4.1.2 Application
- 2.1.4.1.2.1 Germany Electronic Connector Market (by Application), Value Data
- 2.1.4.1.3 Product
- 2.1.4.1.3.1 Germany Electronic Connector Market (by Product Type), Value Data
- 2.1.4.1.1 Market
- 2.1.4.2 France
- 2.1.4.2.1 Market
- 2.1.4.2.1.1 Buyer Attributes
- 2.1.4.2.1.2 Key Suppliers and Product Manufacturers in France
- 2.1.4.2.1.3 Business Challenges
- 2.1.4.2.1.4 Business Drivers
- 2.1.4.2.2 Application
- 2.1.4.2.2.1 France Electronic Connector Market (by Application), Value Data
- 2.1.4.2.3 Product
- 2.1.4.2.3.1 France Electronic Connector Market (by Product Type), Value Data
- 2.1.4.2.1 Market
- 2.1.4.3 Italy
- 2.1.4.3.1 Market
- 2.1.4.3.1.1 Buyer Attributes
- 2.1.4.3.1.2 Key Suppliers and Product Manufacturers in Italy
- 2.1.4.3.1.3 Business Challenges
- 2.1.4.3.1.4 Business Drivers
- 2.1.4.3.2 Application
- 2.1.4.3.2.1 Italy Electronic Connector Market (by Application), Value Data
- 2.1.4.3.3 Product
- 2.1.4.3.3.1 Italy Electronic Connector Market (by Product Type), Value Data
- 2.1.4.3.1 Market
- 2.1.4.4 Rest-of-Europe
- 2.1.4.4.1 Market
- 2.1.4.4.1.1 Buyer Attributes
- 2.1.4.4.1.2 Key Suppliers and Product Manufacturers in Rest-of-Europe
- 2.1.4.4.1.3 Business Challenges
- 2.1.4.4.1.4 Business Drivers
- 2.1.4.4.2 Application
- 2.1.4.4.2.1 Rest-of-Europe Electronic Connector Market (by Application), Value Data
- 2.1.4.4.3 Product
- 2.1.4.4.3.1 Rest-of-Europe Electronic Connector Market (by Product Type), Value Data
- 2.1.4.4.1 Market
- 2.1.4.1 Germany
- 2.1.1 Market
- 2.2 U.K.
- 2.2.1 Market
- 2.2.1.1 Buyer Attributes
- 2.2.1.2 Key Suppliers and Product Manufacturers in the U.K.
- 2.2.1.3 Competitive Benchmarking
- 2.2.1.4 Business Challenges
- 2.2.1.5 Business Drivers
- 2.2.2 Application
- 2.2.2.1 U.K. Electronic Connector Market (by Application), Value Data
- 2.2.3 Product
- 2.2.3.1 U.K. Electronic Connector Market (by Product Type), Value Data
- 2.2.1 Market
3 Markets - Competitive Benchmarking & Company Profiles
- 3.1 Competitive Benchmarking
- 3.1.1 Competitive Position Matrix
- 3.2 Market Share Analysis
- 3.3 Company Profiles
- 3.3.1 TE Connectivity
- 3.3.1.1 Company Overview
- 3.3.1.1.1 Role of TE Connectivity in the Electronic Connector Market
- 3.3.1.1.2 Product Portfolio
- 3.3.1.2 Business Strategies
- 3.3.1.2.1 TE Connectivity: Product Development
- 3.3.1.3 Corporate Strategies
- 3.3.1.3.1 TE Connectivity: Mergers and Acquisitions
- 3.3.1.3.2 TE Connectivity: Partnerships, Joint Ventures, Collaborations, and Alliances
- 3.3.1.4 Production Sites and R&D Analysis
- 3.3.1.5 Analyst View
- 3.3.1.1 Company Overview
- 3.3.2 Aptiv PLC
- 3.3.2.1 Company Overview
- 3.3.2.1.1 Role of Aptiv PLC in the Electronic Connector Market
- 3.3.2.1.2 Product Portfolio
- 3.3.2.2 Corporate Strategies
- 3.3.2.2.1 Aptiv PLC: Mergers and Acquisitions
- 3.3.2.3 Production Sites and R&D Analysis
- 3.3.2.4 Analyst View
- 3.3.2.1 Company Overview
- 3.3.3 Rosenberger Group
- 3.3.3.1 Company Overview
- 3.3.3.1.1 Role of Rosenberger Group in the Electronic Connector Market
- 3.3.3.1.2 Product Portfolio
- 3.3.3.2 Business Strategies
- 3.3.3.2.1 Rosenberger Group: Product Development
- 3.3.3.2.2 Rosenberger Group: Market Development
- 3.3.3.3 Corporate Strategies
- 3.3.3.3.1 Rosenberger Group: Partnerships, Joint Ventures, Collaborations, and Alliances
- 3.3.3.4 Production Sites and R&D Analysis
- 3.3.3.5 Analyst View
- 3.3.3.1 Company Overview
- 3.3.4 HARTING Technology Group
- 3.3.4.1 Company Overview
- 3.3.4.1.1 Role of HARTING Technology Group in the Electronic Connector Market
- 3.3.4.1.2 Product Portfolio
- 3.3.4.2 Business Strategies
- 3.3.4.2.1 HARTING Technology Group: Product Development
- 3.3.4.2.2 HARTING Technology Group: Market Development
- 3.3.4.3 Corporate Strategies
- 3.3.4.3.1 HARTING Technology Group: Partnerships, Joint Ventures, Collaborations, and Alliances
- 3.3.4.4 Production Sites and R&D Analysis
- 3.3.4.5 Analyst View
- 3.3.4.1 Company Overview
- 3.3.5 Phoenix Contact
- 3.3.5.1 Company Overview
- 3.3.5.1.1 Role of Phoenix Contact in the Electronic Connector Market
- 3.3.5.1.2 Product Portfolio
- 3.3.5.2 Business Strategies
- 3.3.5.2.1 Phoenix Contact: Product Development
- 3.3.5.3 Corporate Strategies
- 3.3.5.3.1 Phoenix Contact: Partnerships, Joint Ventures, Collaborations, and Alliances
- 3.3.5.4 Production Sites and R&D Analysis
- 3.3.5.5 Analyst View
- 3.3.5.1 Company Overview
- 3.3.6 HUBER+SUHNER
- 3.3.6.1 Company Overview
- 3.3.6.1.1 Role of HUBER+SUHNER in the Electronic Connector Market
- 3.3.6.1.2 Product Portfolio
- 3.3.6.2 Corporate Strategies
- 3.3.6.2.1 HUBER+SUHNER: Mergers and Acquisitions
- 3.3.6.3 Production Sites and R&D Analysis
- 3.3.6.4 Analyst View
- 3.3.6.1 Company Overview
- 3.3.7 Radiall
- 3.3.7.1 Company Overview
- 3.3.7.1.1 Role of Radiall in the Electronic Connector Market
- 3.3.7.1.2 Product Portfolio
- 3.3.7.2 Corporate Strategies
- 3.3.7.2.1 Radiall: Mergers and Acquisitions
- 3.3.7.3 Production Sites and R&D Analysis
- 3.3.7.4 Analyst View
- 3.3.7.1 Company Overview
- 3.3.8 LEMO Group
- 3.3.8.1 Company Overview
- 3.3.8.1.1 Role of LEMO Group in the Electronic Connector Market
- 3.3.8.1.2 Product Portfolio
- 3.3.8.2 Business Strategies
- 3.3.8.2.1 LEMO Group: Product Development
- 3.3.8.3 Production Sites and R&D Analysis
- 3.3.8.4 Analyst View
- 3.3.8.1 Company Overview
- 3.3.9 Weidmuller Interface GmbH & Co. KG
- 3.3.9.1 Company Overview
- 3.3.9.1.1 Role of Weidmuller Interface GmbH & Co. KG in the Electronic Connector Market
- 3.3.9.1.2 Product Portfolio
- 3.3.9.2 Business Strategies
- 3.3.9.2.1 Weidmuller Interface GmbH & Co. KG: Market Development
- 3.3.9.3 Production Sites and R&D Analysis
- 3.3.9.4 Analyst View
- 3.3.9.1 Company Overview
- 3.3.10 WAGO
- 3.3.10.1 Company Overview
- 3.3.10.1.1 Role of WAGO in the Electronic Connector Market
- 3.3.10.1.2 Product Portfolio
- 3.3.10.2 Production Sites and R&D Analysis
- 3.3.10.3 Analyst View
- 3.3.10.1 Company Overview
- 3.3.1 TE Connectivity
4 Research Methodology
- 4.1 Data Sources
- 4.1.1 Primary Data Sources
- 4.1.2 Secondary Data Sources
- 4.1.3 Data Triangulation
- 4.2 Market Estimation and Forecast
- 4.2.1 Research Methodology - Top-Down and Bottom-Up Approach
- 4.2.2 Factors for Data Prediction and Modeling

