|
|
市場調査レポート
商品コード
1455866
デジタルツインの世界市場:用途別、エンドユーザー別、タイプ別、提供製品別、国別 - 分析と予測(2023-2033年)Global Digital Twin Market: Focus on Application, End User, Type, Product Offering, and Country - Analysis and Forecast, 2023-2033 |
||||||
|
|||||||
カスタマイズ可能
|
|||||||


| デジタルツインの世界市場:用途別、エンドユーザー別、タイプ別、提供製品別、国別 - 分析と予測(2023-2033年) |
|
出版日: 2024年03月28日
発行: BIS Research
ページ情報: 英文
納期: 1~5営業日
|

全表示
- 概要
- 図表
- 目次
| 主要市場統計 | |
|---|---|
| 予測期間 | 2023-2033年 |
| 2023年評価 | 103億米ドル |
| 2033年予測 | 1兆364億米ドル |
| CAGR | 58.52% |
デジタルツインの市場は、より広範な業界情勢の中で急成長しているセクターであり、急速な成長、イノベーション、多業種にわたる幅広い用途を特徴としています。
デジタルツインとは、物理的オブジェクト、プロセス、システム、サービスを仮想的に複製したものです。
同市場を牽引しているのは、製造、ヘルスケア、自動車、航空宇宙、エネルギー、都市開発など、さまざまな分野におけるデジタル化とIoTの導入に対する需要の高まりです。企業は効率改善、コスト削減、製品・サービス提供の強化の方法を模索しており、デジタルツインはより良い意思決定につながる洞察を提供することで戦略的優位性をもたらします。IoT接続、クラウドコンピューティング、AIの進歩はデジタルツイン市場の重要な実現要素であり、リアルタイムでの膨大なデータの収集と分析を可能にします。これらの技術は、より正確でダイナミックなデジタルツインの作成を促進し、行動を予測し、オペレーションを最適化し、潜在的な障害を事前に特定することができます。
用途別では、予知保全の部門が世界市場を独占:
予知保全は急速に市場をリードしており、その市場規模は2022年の23億米ドルから2033年には3,659億米ドルに拡大すると予測されています。この著しい成長は、業界全体での予知保全技術の重要性が高まりに起因しています。この成長の主な原動力となっているのは、IoTとビッグデータアナリティクスの進歩であり、これによりリアルタイムでの機器のモニタリングが可能になり、ダウンタイムとメンテナンスコストが大幅に削減されました。製造業および工業の世界的の拡大が、こうした技術への需要をさらに加速させています。
タイプ別では、アセットの部門が世界市場を独占:
アセット部門は、物理資産をデジタルのフレームワークでミラーリングし、リアルタイムのモニタリング、分析、シミュレーションを可能にする革新的なアプローチにより、市場をリードしています。同部門の市場規模は、2022年の27億米ドルから、2033年には4,338億米ドルに成長すると予測されており、主に産業資産の複雑化、運用効率の向上と予知保全の必要性が原動力となっています。デジタルツイン内のIoT、AI、ML技術の統合により、潜在的な故障の正確な予測と資産性能の最適化が可能になり、ダウンタイムとメンテナンスコストの削減が実現します。今後の成長要因としては、より深い洞察のためのAIとMLのさらなる進化、リアルタイムデータ伝送のための5Gの統合、没入型資産管理体験のためのAR・VR技術の採用が挙げられます。これらの技術的進歩は、より正確で効率的な資産管理を可能にし、アセットデジタルツイン市場の継続的成長を促進します。
北米がデジタルツイン市場をリードしている主な理由は、強固な技術インフラ、R&Dへの高水準の投資、IoT、AI、機械学習などの先進技術の早期導入です。この地域は、デジタルツイン技術の限界を押し広げ、継続的に革新している大手技術企業や新興企業の存在感が強いという利点があります。さらに、北米全域の製造、航空宇宙、ヘルスケアなどの業界は、業務の最適化、コスト削減、製品開発の強化におけるデジタルツインの価値をいち早く認識しています。これは、経済におけるデジタルトランスフォーメーションとイノベーションの促進を目的とした政府の支援政策によって補完されています。さらに、この地域では持続可能性とエネルギー効率に重点を置いているため、複雑なシステムやプロセスをより効果的に管理するためのデジタルツインの導入に拍車がかかっています。
当レポートでは、世界のデジタルツインの市場を調査し、市場概要、主要動向、法規制環境、市場影響因子および市場機会の分析、市場規模の推移・予測、各種区分・地域別の詳細分析、競合情勢、主要企業のプロファイルなどをまとめています。
目次
エグゼクティブサマリー
第1章 市場
- 動向:現在および将来の影響評価
- インフラ開発におけるデジタルツインの台頭
- ハイパーパーソナライゼーション
- 規制状況
- エコシステム/進行中のプログラム
- インダストリー5.0におけるデジタルツインの役割
- 業界別のユースケース
- スタートアップ資金調達の概要
- 市場力学の概要
- 市場促進要因
- 市場抑制要因
- 市場機会
- サプライチェーンの概要
第2章 用途
- 用途の分類
- 用途の概要
- 世界のデジタルツイン市場
- 市場概要
- 世界のデジタルツイン市場:用途別
- 製品設計開発
- パフォーマンス監視
- 予知保全
- 在庫管理
- その他
- 世界のデジタルツイン市場:エンドユーザー別
- 世界のデジタルツイン市場:エンドユーザー別
- 製造
- 自動車
- 航空
- エネルギー・ユーティリティ
- ヘルスケア
- 物流・小売
- その他
第3章 製品
- 製品概要
- 世界のデジタルツイン市場
- 市場概要
- 世界のデジタルツイン市場:提供製品別
- プラットフォーム
- ハードウェア
- ソフトウェアサービス
- 世界のデジタルツイン市場:タイプ別
- アセットデジタルツイン
- プロセスデジタルツイン
- システムデジタルツイン
- 組織デジタルツイン (DTO)
第4章 地域
- 地域概要
- 北米
- 欧州
- アジア太平洋
- その他の地域
第5章 市場:競合ベンチマーキング・企業プロファイル
- 次なるフロンティア
- 地理的評価
- General Electric
- Microsoft
- ANSYS, Inc
- ABB
- ANDRITZ
- Bentley Systems
- Dassault Systemes
- Honeywell International Inc
- Robert Bosch Gmbh
- IBM Corporation
- Siemens
- SAP SE
第6章 調査手法
List of Figures
- Figure 1: Global Digital Twin Market (by Region), $Billion, 2022, 2023, and 2033
- Figure 2: Global Digital Twin Market (by Application), $Billion, 2022, 2023, and 2033
- Figure 3: Global Digital Twin Market (by End User), $Billion, 2022, 2023, and 2033
- Figure 4: Global Digital Twin Market (by Product Offering), $Billion, 2022, 2023, and 2033
- Figure 5: Global Digital Twin Market (by Type), $Billion, 2022, 2023, and 2033
- Figure 6: Digital Twin, Recent Developments
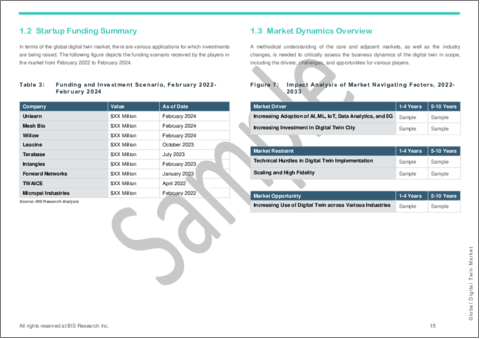
- Figure 7: Impact Analysis of Market Navigating Factors, 2022-2033
- Figure 8: Supply Chain and Risks within the Supply Chain
- Figure 9: U.S. Digital Twin Market, $Billion, 2022-2033
- Figure 10: Canada Digital Twin Market, $Billion, 2022-2033
- Figure 11: France Digital Twin Market, $Billion, 2022-2033
- Figure 12: Germany Digital Twin Market, $Billion, 2022-2033
- Figure 13: U.K. Digital Twin Market, $Billion, 2022-2033
- Figure 14: Russia Digital Twin Market, $Billion, 2022-2033
- Figure 15: Rest-of-Europe Digital Twin Market, $Billion, 2022-2033
- Figure 16: China Digital Twin Market, $Billion, 2022-2033
- Figure 17: India Digital Twin Market, $Billion, 2022-2033
- Figure 18: Japan Digital Twin Market, $Billion, 2022-2033
- Figure 19: Rest-of-Asia-Pacific Digital Twin Market, $Billion, 2022-2033
- Figure 20: Latin America Digital Twin Market, $Billion, 2022-2033
- Figure 21: Strategic Initiatives, 2020-2023
- Figure 22: Share of Strategic Initiatives, 2020-2023
- Figure 23: Data Triangulation
- Figure 24: Top-Down and Bottom-Up Approach
- Figure 25: Assumptions and Limitations
List of Tables
- Table 1: Market Snapshot
- Table 2: Global Digital Twin Market, Opportunities across Regions
- Table 3: Funding and Investment Scenario, February 2022-February 2024
- Table 4: Global Digital Twin Market (by Application), $Billion, 2022-2033
- Table 5: Global Digital Twin Market (by End User), $Billion, 2022-2033
- Table 6: Global Digital Twin Market (by Product Offering), $Billion, 2022-2033
- Table 7: Global Digital Twin Market (by Type), $Billion, 2022-2033
- Table 8: Global Digital Twin Market (by Region), $Billion, 2022-2033
- Table 9: North America Digital Twin Market (by End User), $Billion, 2022-2033
- Table 10: North America Digital Twin Market (by Application), $Billion, 2022-2033
- Table 11: North America Digital Twin Market (by Type), $Billion, 2022-2033
- Table 12: North America Digital Twin Market (by Product Offering), $Billion, 2022-2033
- Table 13: U.S. Digital Twin Market (by End User), $Billion, 2022-2033
- Table 14: U.S. Digital Twin Market (by Application), $Billion, 2022-2033
- Table 15: U.S. Digital Twin Market (by Type), $Billion, 2022-2033
- Table 16: U.S. Digital Twin Market (by Product Offering), $Billion, 2022-2033
- Table 17: Canada Digital Twin Market (by End User), $Billion, 2022-2033
- Table 18: Canada Digital Twin Market (by Application), $Billion, 2022-2033
- Table 19: Canada Digital Twin Market (by Type), $Billion, 2022-2033
- Table 20: Canada Digital Twin Market (by Product Offering), $Billion, 2022-2033
- Table 21: Europe Digital Twin Market (by End User), $Billion, 2022-2033
- Table 22: Europe Digital Twin Market (by Application), $Billion, 2022-2033
- Table 23: Europe Digital Twin Market (by Type), $Billion, 2022-2033
- Table 24: Europe Digital Twin Market (by Product Offering), $Billion, 2022-2033
- Table 25: France Digital Twin Market (by End User), $Billion, 2022-2033
- Table 26: France Digital Twin Market (by Application), $Billion, 2022-2033
- Table 27: France Digital Twin Market (by Type), $Billion, 2022-2033
- Table 28: France Digital Twin Market (by Product Offering), $Billion, 2022-2033
- Table 29: Germany Digital Twin Market (by End User), $Billion, 2022-2033
- Table 30: Germany Digital Twin Market (by Application), $Billion, 2022-2033
- Table 31: Germany Digital Twin Market (by Type), $Billion, 2022-2033
- Table 32: Germany Digital Twin Market (by Product Offering), $Billion, 2022-2033
- Table 33: U.K. Digital Twin Market (by End User), $Billion, 2022-2033
- Table 34: U.K. Digital Twin Market (by Application), $Billion, 2022-2033
- Table 35: U.K. Digital Twin Market (by Type), $Billion, 2022-2033
- Table 36: U.K. Digital Twin Market (by Product Offering), $Billion, 2022-2033
- Table 37: Russia Digital Twin Market (by End User), $Billion, 2022-2033
- Table 38: Russia Digital Twin Market (by Application), $Billion, 2022-2033
- Table 39: Russia Digital Twin Market (by Type), $Billion, 2022-2033
- Table 40: Russia Digital Twin Market (by Product Offering), $Billion, 2022-2033
- Table 41: Rest-of-Europe Digital Twin Market (by End User), $Billion, 2022-2033
- Table 42: Rest-of-Europe Digital Twin Market (by Application), $Billion, 2022-2033
- Table 43: Rest-of-Europe Digital Twin Market (by Type), $Billion, 2022-2033
- Table 44: Rest-of-Europe Digital Twin Market (by Product Offering), $Billion, 2022-2033
- Table 45: Asia-Pacific Digital Twin Market (by End User), $Billion, 2022-2033
- Table 46: Asia-Pacific Digital Twin Market (by Application), $Billion, 2022-2033
- Table 47: Asia-Pacific Digital Twin Market (by Type), $Billion, 2022-2033
- Table 48: Asia-Pacific Digital Twin Market (by Product Offering), $Billion, 2022-2033
- Table 49: China Digital Twin Market (by End User), $Billion, 2022-2033
- Table 50: China Digital Twin Market (by Application), $Billion, 2022-2033
- Table 51: China Digital Twin Market (by Type), $Billion, 2022-2033
- Table 52: China Digital Twin Market (by Product Offering), $Billion, 2022-2033
- Table 53: India Digital Twin Market (by End User), $Billion, 2022-2033
- Table 54: India Digital Twin Market (by Application), $Billion, 2022-2033
- Table 55: India Digital Twin Market (by Type), $Billion, 2022-2033
- Table 56: India Digital Twin Market (by Product Offering), $Billion, 2022-2033
- Table 57: Japan Digital Twin Market (by End User), $Billion, 2022-2033
- Table 58: Japan Digital Twin Market (by Application), $Billion, 2022-2033
- Table 59: Japan Digital Twin Market (by Type), $Billion, 2022-2033
- Table 60: Japan Digital Twin Market (by Product Offering), $Billion, 2022-2033
- Table 61: Rest-of-Asia-Pacific Digital Twin Market (by End User), $Billion, 2022-2033
- Table 62: Rest-of-Asia-Pacific Digital Twin Market (by Application), $Billion, 2022-2033
- Table 63: Rest-of-Asia-Pacific Digital Twin Market (by Type), $Billion, 2022-2033
- Table 64: Rest-of-Asia-Pacific Digital Twin Market (by Product Offering), $Billion, 2022-2033
- Table 65: Rest-of-the-World Digital Twin Market (by End User), $Billion, 2022-2033
- Table 66: Rest-of-the-World Digital Twin Market (by Application), $Billion, 2022-2033
- Table 67: Rest-of-the-World Digital Twin Market (by Type), $Billion, 2022-2033
- Table 68: Rest-of-the-World Digital Twin Market (by Product Offering), $Billion, 2022-2033
- Table 69: Latin America Digital Twin Market (by End User), $Billion, 2022-2033
- Table 70: Latin America Digital Twin Market (by Application), $Billion, 2022-2033
- Table 71: Latin America Digital Twin Market (by Type), $Billion, 2022-2033
- Table 72: Latin America Digital Twin Market (by Product Offering), $Billion, 2022-2033
- Table 73: Middle East and Africa Digital Twin Market (by End User), $Billion, 2022-2033
- Table 74: Middle East and Africa Digital Twin Market (by Application), $Billion, 2022-2033
- Table 75: Middle East and Africa Digital Twin Market (by Type), $Billion, 2022-2033
- Table 76: Middle East and Africa Digital Twin Market (by Product Offering), $Billion, 2022-2033
- Table 77: Market Share, 2022
Introduction of Digital Twin
A digital twin is a virtual model designed to accurately reflect a physical object, process, system, or service. This innovative concept leverages the convergence of the Internet of Things (IoT), artificial intelligence (AI), machine learning (ML), and big data analytics to create a dynamic and real-time simulation of a physical entity or system. Digital twins are used across various industries, including manufacturing, healthcare, urban planning, and more, enabling professionals to simulate, predict, and optimize systems before they are built and throughout their lifecycle. The essence of a digital twin technology lies in its ability to bridge the physical and virtual worlds. By gathering data from sensors installed on physical objects, the virtual model can be updated in real time, allowing for simulations that predict how the physical counterpart would behave under different conditions. This capability not only helps in understanding and forecasting the performance and potential issues of the physical counterpart but also facilitates innovation, efficiency, and decision-making processes.
Digital twins can vary in complexity, from simple models that represent a single aspect of the physical entity to highly sophisticated systems that encompass multiple layers of information and interaction. They serve as a critical tool in optimizing operations, maintenance, and product development, offering a holistic view of the entire lifecycle of a product or system. By providing insights that would be difficult or impossible to obtain through traditional methods, digital twins represent a significant leap forward in how humans interact with and understand the physical world around them.
| KEY MARKET STATISTICS | |
|---|---|
| Forecast Period | 2023 - 2033 |
| 2023 Evaluation | $10.3 Billion |
| 2033 Forecast | $1,036.4 Billion |
| CAGR | 58.52% |
Market Introduction
The digital twin market represents a burgeoning sector within the broader technology landscape, characterized by rapid growth, innovation, and wide-ranging applications across multiple industries. At its core, a digital twin is a virtual replica of a physical object, process, system, or service.
The market is driven by the increasing demand for digitalization and the adoption of IoT across various sectors, including manufacturing, healthcare, automotive, aerospace, energy, and urban development. Businesses are seeking ways to improve efficiency, reduce costs, and enhance product and service offerings, with digital twins providing a strategic advantage by offering insights that lead to better decision-making. Advancements in IoT connectivity, cloud computing, and AI are crucial enablers of the digital twin market, allowing for the collection and analysis of vast amounts of data in real time. These technologies facilitate the creation of more accurate and dynamic digital twins that can predict behaviors, optimize operations, and identify potential failures before they occur.
Industrial Impact
The industrial impact of the digital twin market is profound and far-reaching, fundamentally transforming how industries operate, innovate, and compete. By providing a virtual representation of physical assets, processes, or systems, digital twins enable businesses to simulate, predict, and optimize their operations in ways previously unimaginable. In manufacturing, for instance, digital twins are revolutionizing production processes by allowing for real-time monitoring and predictive maintenance, significantly reducing downtime and increasing efficiency. This leads to lower operational costs and higher product quality, enhancing competitiveness in a global market.
In the realm of infrastructure and construction, digital twin facilitates the detailed planning and management of large-scale projects, improving decision-making and risk management. By simulating different scenarios and analyzing potential impacts, project managers can anticipate problems before they occur, ensuring smoother project execution and better resource allocation. The energy sector benefits from digital twins through optimized asset management and grid operation, contributing to more sustainable energy systems. By predicting equipment failures and optimizing energy distribution, companies can reduce waste and enhance reliability, supporting the transition to greener energy sources.
Market Segmentation:
Segmentation 1: by Application
- Product Design Development
- Performance Monitoring
- Predictive Maintenance
- Inventory Management
- Others
Predictive Maintenance Segment to Dominate the Global Digital Twin Market (by Application)
Predictive maintenance is rapidly leading the market in application sectors, with its value expected to grow from $2.3 billion in 2022 to an estimated $365.9 billion by 2033. This significant growth is attributed to a confluence of driving factors that underscore the increasing importance of predictive maintenance technologies across industries. The key drivers behind this growth are advances in IoT and big data analytics that have enabled real-time equipment monitoring, drastically reducing downtime and maintenance costs. The expansion of manufacturing and industrial sectors globally has further spurred the demand for such technologies.
Segmentation 2: by End User
- Manufacturing
- Automotive
- Aviation
- Energy and Utilities
- Healthcare
- Logistics and Retail
- Others
Segmentation 3: by Type
- Asset Digital Twin
- Process Digital Twin
- System Digital Twin
- Digital Twin of an Organization (DTO)
Asset Digital Twin Segment to Dominate the Global Digital Twin Market (by Type)
The asset digital twin segment is leading the market due to its innovative approach to mirroring physical assets in a digital framework, enabling real-time monitoring, analysis, and simulation. This segment's market value, projected to grow from $2.7 billion in 2022 to $433.8 billion by 2033, is primarily driven by the increasing complexity of industrial assets and the need for enhanced operational efficiency and predictive maintenance. The integration of IoT, AI, and ML technologies within digital twins allows for the precise prediction of potential failures and optimization of asset performance, thereby reducing downtime and maintenance costs. Future growth factors include the further advancement of AI and ML for deeper insights, the integration of 5G for real-time data transmission, and the adoption of AR and VR technologies for immersive asset management experiences. These technological advancements will enable more accurate and efficient asset management practices, fostering the continued growth of the asset digital twin market.
Segmentation 4: by Product Offering
- Platforms
- Hardware
- Support Services
Segmentation 5: by Region
- North America - U.S. and Canada
- Europe - U.K., Germany, France, Russia, and Rest-of-the-Europe
- Asia-Pacific - China, India, Japan, and Rest-of-Asia-Pacific
- Rest-of-the-World - Latin America and Middle East and Africa
North America is leading the digital twin market primarily due to its robust technological infrastructure, high levels of investment in research and development, and the early adoption of advanced technologies such as IoT, AI, and machine learning. The region benefits from a strong presence of leading technology companies and start-ups that continuously innovate and push the boundaries of digital twin technology. Furthermore, industries across North America, including manufacturing, aerospace, and healthcare, have been quick to recognize the value of digital twins in optimizing operations, reducing costs, and enhancing product development. This has been complemented by supportive government policies aimed at fostering digital transformation and innovation within the economy. Additionally, the region's focus on sustainability and energy efficiency has spurred the adoption of digital twins to manage complex systems and processes more effectively.
Recent Developments in the Global Digital Twin Market
In December 2023, Siemens signed a collaboration with Intel on advanced semiconductor manufacturing, which aimed to improve production efficiency and sustainability throughout the value chain. The collaboration explored initiatives such as optimizing energy management and mitigating carbon footprints throughout the value chain. A notable aspect involved investigating the use of digital twins for complex manufacturing facilities, aiming to standardize solutions and enhance efficiency in every aspect of the process.
- In September 2023, GE Vernova launched a new product, an AI-powered carbon emissions management software for the energy sector. Utilization of this new software would enable precise measurement, management, and operationalization of insights aimed at lowering carbon emissions. With the use of a reconciliation algorithm and digital twin technology driven by machine learning (ML) and data analytics, the software aimed to increase the accuracy of greenhouse gas (GHG) calculations on scope one gas turbines by as much as 33%.
- In April 2023, Siemens signed a partnership with IBM to create an integrated software solution for systems engineering, service lifecycle management, and asset management. The collaboration aimed to support traceability and sustainable product development across mechanical, electronics, electrical, and software engineering domains. The new suite, based on SysML v1 standards, would utilize a digital thread to link design, manufacturing, operations, maintenance, updates, and end-of-life management throughout the product lifecycle.
How can this report add value to an organization?
Product/Innovation Strategy: The product segment helps the reader understand the different types of products available for deployment globally. Moreover, the study provides the reader with a detailed understanding of the global digital twin market based on application (product design development, performance monitoring, predictive maintenance, inventory management, and others), and by end user (manufacturing, automotive, aviation, energy and utilities, healthcare, logistics and retail, and others), on the basis product offering (platform, hardware, and software service), and by type(Asset Digital Twin, Process Digital Twin, System Digital Twin, and Digital Twin of an Organization (DTO).
Growth/Marketing Strategy: The global digital twin market has seen major development by key players operating in the market, such as business expansion, partnership, collaboration, and joint venture. The favored strategy for the companies has been partnerships and contracts to strengthen their position in the global digital twin market. For instance, in May 2023, Dassault Systemes signed a partnership with Envision Digital to optimize the performance of sustainable energy solutions. This partnership involved the connection of Envision Digital's EnOS real-time asset operations data with a virtual twin of asset engineering and manufacturing on Dassault Systemes' 3DEXPERIENCE platform.
Methodology: The research methodology design adopted for this specific study includes a mix of data collected from primary and secondary data sources. Both primary resources (key players, market leaders, and in-house experts) and secondary research (a host of paid and unpaid databases), along with analytical tools, are employed to build the predictive and forecast models.
Data and validation have been taken into consideration from both primary sources as well as secondary sources.
Key Considerations and Assumptions in Market Engineering and Validation
- Detailed secondary research has been done to ensure maximum coverage of manufacturers/suppliers operational in a country.
- Based on the classification, the average selling price (ASP) has been calculated using the weighted average method.
- The currency conversion rate has been taken from the historical exchange rate of Oanda and/or other relevant websites.
- Any economic downturn in the future has not been taken into consideration for the market estimation and forecast.
- The base currency considered for the market analysis is US$. Currencies other than the US$ have been converted to the US$ for all statistical calculations, considering the average conversion rate for that particular year.
- The term "product" in this document may refer to "hardware and software" as and where relevant.
- The term "manufacturers/suppliers" may refer to "systems providers" or "technology providers" as and where relevant.
Primary Research
The primary sources involve experts from various digital twin technology solution and service providers. Respondents such as CEOs, vice presidents, marketing directors, and technology and innovation directors have been interviewed to obtain and verify both qualitative and quantitative aspects of this research study.
Secondary Research
This study involves the usage of extensive secondary research, company websites, directories, and annual reports. It also makes use of databases, such as Spacenews, Businessweek, and others, to collect effective and useful information for a market-oriented, technical, commercial, and extensive study of the global market. In addition to the data sources, the study has been undertaken with the help of other data sources and websites, such as www.nasa.gov.
Secondary research was done to obtain critical information about the industry's value chain, the market's monetary chain, revenue models, the total pool of key players, and the current and potential use cases and applications.
Key Market Players and Competition Synopsis
The companies that are profiled have been selected based on thorough secondary research, which includes analyzing company coverage, product portfolio, market penetration, and insights gathered from primary experts.
The global digital twin market comprises key players who have established themselves thoroughly and have the proper understanding of the market, accompanied by start-ups who are looking forward to establishing themselves in this highly competitive market. In 2022, the global digital twin market was dominated by established players, accounting for 71% of the market share, whereas start-ups managed to capture 29% of the market.
Some prominent names established in this market are:
- Ansys Inc.
- ABB Ltd.
- Andritz Group
- Bentley Systems
- Siemens AG
- Dassault Systemes
- IBM Corporation
- SAP SE
- Robert Bosch GMBH
- Honeywell International Inc
- Microsoft
- General Electric
Table of Contents
Executive Summary
Scope and Definition
1 Markets
- 1.1 Trends: Current and Future Impact Assessment
- 1.1.1 Rise of Digital Twins in Infrastructure Development
- 1.1.2 Hyper-Personalization
- 1.2 Regulatory Landscape
- 1.3 Ecosystem/Ongoing Programs
- 1.3.1 Project PLATEAU
- 1.4 Role of Digital Twin in Industry 5.0
- 1.5 Use Cases by Industry
- 1.6 Startup Funding Summary
- 1.7 Market Dynamics Overview
- 1.7.1 Market Drivers
- 1.7.1.1 Increasing Adoption of AI, ML, IoT, Data Analytics, and 5G
- 1.7.1.2 Increasing Investment in Digital Twin City
- 1.7.2 Market Restraints
- 1.7.2.1 Technical Hurdles in Digital Twin Implementation
- 1.7.2.2 Scaling and High Fidelity
- 1.7.3 Market Opportunities
- 1.7.3.1 Increasing Use of Digital Twin across Various Industries
- 1.7.1 Market Drivers
- 1.8 Supply Chain Overview
2 Application
- 2.1 Application Segmentation
- 2.2 Application Summary
- 2.3 Global Digital Twin Market
- 2.3.1 Market Overview
- 2.4 Global Digital Twin Market (by Application)
- 2.4.1 Product Design Development
- 2.4.2 Performance Monitoring
- 2.4.3 Predictive Maintenance
- 2.4.4 Inventory Management
- 2.4.5 Others
- 2.5 Global Digital Twin Market (by End User)
- 2.6 Global Digital Twin Market (by End User)
- 2.6.1 Manufacturing
- 2.6.2 Automotive
- 2.6.3 Aviation
- 2.6.4 Energy and Utilities
- 2.6.5 Healthcare
- 2.6.6 Logistics and Retail
- 2.6.7 Others
3 Products
- 3.1 Product Summary
- 3.2 Global Digital Twin Market
- 3.2.1 Market Overview
- 3.3 Global Digital Twin Market (by Product Offering)
- 3.3.1 Platforms
- 3.3.2 Hardware
- 3.3.3 Software Services
- 3.4 Global Digital Twin Market (by Type)
- 3.4.1 Asset Digital Twin
- 3.4.2 Process Digital Twin
- 3.4.3 System Digital Twin
- 3.4.4 Digital Twin of an Organization (DTO)
4 Regions
- 4.1 Regional Summary
- 4.2 North America
- 4.2.1 Regional Overview
- 4.2.2 Driving Factors for Market Growth
- 4.2.3 Factors Challenging the Market
- 4.2.4 Application
- 4.2.5 Product
- 4.2.6 U.S.
- 4.2.7 Application
- 4.2.8 Product
- 4.2.9 Canada
- 4.2.10 Application
- 4.2.11 Product
- 4.3 Europe
- 4.3.1 Regional Overview
- 4.3.2 Driving Factors for Market Growth
- 4.3.3 Factors Challenging the Market
- 4.3.4 Application
- 4.3.5 Product
- 4.3.6 France
- 4.3.7 Application
- 4.3.8 Product
- 4.3.9 Germany
- 4.3.10 Application
- 4.3.11 Product
- 4.3.12 U.K.
- 4.3.13 Application
- 4.3.14 Product
- 4.3.15 Russia
- 4.3.16 Application
- 4.3.17 Product
- 4.3.18 Rest-of-Europe
- 4.3.19 Application
- 4.3.20 Product
- 4.4 Asia-Pacific
- 4.4.1 Regional Overview
- 4.4.2 Driving Factors for Market Growth
- 4.4.3 Factors Challenging the Market
- 4.4.4 Application
- 4.4.5 Product
- 4.4.6 China
- 4.4.7 Application
- 4.4.8 Product
- 4.4.9 India
- 4.4.10 Application
- 4.4.11 Product
- 4.4.12 Japan
- 4.4.13 Application
- 4.4.14 Product
- 4.4.15 Rest-of-Asia-Pacific
- 4.4.16 Application
- 4.4.17 Product
- 4.5 Rest-of-the-World
- 4.5.1 Regional Overview
- 4.5.2 Driving Factors for Market Growth
- 4.5.3 Factors Challenging the Market
- 4.5.4 Application
- 4.5.5 Product
- 4.5.6 Latin America
- 4.5.7 Regional Overview
- 4.5.8 Application
- 4.5.9 Product
- 4.5.10 Middle East and Africa
- 4.5.11 Regional Overview
- 4.5.12 Application
- 4.5.13 Product
5 Markets - Competitive Benchmarking & Company Profiles
- 5.1 Next Frontiers
- 5.2 Geographic Assessment
- 5.2.1 General Electric
- 5.2.1.1 Overview
- 5.2.1.2 Top Products/Product Portfolio
- 5.2.1.3 Top Competitors
- 5.2.1.4 Target Customers
- 5.2.1.5 Key Personnel
- 5.2.1.6 Analyst View
- 5.2.1.7 Market Share, 2023
- 5.2.2 Microsoft
- 5.2.2.1 Overview
- 5.2.2.2 Top Products/Product Portfolio
- 5.2.2.3 Top Competitors
- 5.2.2.4 Target Customers
- 5.2.2.5 Key Personnel
- 5.2.2.6 Analyst View
- 5.2.2.7 Market Share, 2023
- 5.2.3 ANSYS, Inc
- 5.2.3.1 Overview
- 5.2.3.2 Top Products/Product Portfolio
- 5.2.3.3 Top Competitors
- 5.2.3.4 Target Customers
- 5.2.3.5 Key Personnel
- 5.2.3.6 Analyst View
- 5.2.3.7 Market Share, 2023
- 5.2.4 ABB
- 5.2.4.1 Overview
- 5.2.4.2 Top Products/Product Portfolio
- 5.2.4.3 Top Competitors
- 5.2.4.4 Target Customers
- 5.2.4.5 Key Personnel
- 5.2.4.6 Analyst View
- 5.2.4.7 Market Share, 2023
- 5.2.5 ANDRITZ
- 5.2.5.1 Overview
- 5.2.5.2 Top Products/Product Portfolio
- 5.2.5.3 Top Competitors
- 5.2.5.4 Target Customers
- 5.2.5.5 Key Personnel
- 5.2.5.6 Analyst View
- 5.2.5.7 Market Share, 2023
- 5.2.6 Bentley Systems
- 5.2.6.1 Overview
- 5.2.6.2 Top Products/Product Portfolio
- 5.2.6.3 Top Competitors
- 5.2.6.4 Target Customers
- 5.2.6.5 Key Personnel
- 5.2.6.6 Analyst View
- 5.2.6.7 Market Share, 2023
- 5.2.7 Dassault Systemes
- 5.2.7.1 Overview
- 5.2.7.2 Top Products/Product Portfolio
- 5.2.7.3 Top Competitors
- 5.2.7.4 Target Customers
- 5.2.7.5 Key Personnel
- 5.2.7.6 Analyst View
- 5.2.7.7 Market Share, 2023
- 5.2.8 Honeywell International Inc
- 5.2.8.1 Overview
- 5.2.8.2 Top Products/Product Portfolio
- 5.2.8.3 Top Competitors
- 5.2.8.4 Target Customers
- 5.2.8.5 Key Personnel
- 5.2.8.6 Analyst View
- 5.2.8.7 Market Share, 2023
- 5.2.9 Robert Bosch Gmbh
- 5.2.9.1 Overview
- 5.2.9.2 Top Products/Product Portfolio
- 5.2.9.3 Top Competitors
- 5.2.9.4 Target Customers
- 5.2.9.5 Key Personnel
- 5.2.9.6 Analyst View
- 5.2.9.7 Market Share, 2023
- 5.2.10 IBM Corporation
- 5.2.10.1 Overview
- 5.2.10.2 Top Products/Product Portfolio
- 5.2.10.3 Top Competitors
- 5.2.10.4 Target Customers
- 5.2.10.5 Key Personnel
- 5.2.10.6 Analyst View
- 5.2.10.7 Market Share, 2023
- 5.2.11 Siemens
- 5.2.11.1 Overview
- 5.2.11.2 Top Products/Product Portfolio
- 5.2.11.3 Top Competitors
- 5.2.11.4 Target Customers
- 5.2.11.5 Key Personnel
- 5.2.11.6 Analyst View
- 5.2.11.7 Market Share, 2023
- 5.2.12 SAP SE
- 5.2.12.1 Overview
- 5.2.12.2 Top Products/Product Portfolio
- 5.2.12.3 Top Competitors
- 5.2.12.4 Target Customers
- 5.2.12.5 Key Personnel
- 5.2.12.6 Analyst View
- 5.2.12.7 Market Share, 2023
- 5.2.1 General Electric
6 Research Methodology
- 6.1 Data Sources
- 6.1.1 Primary Data Sources
- 6.1.2 Secondary Data Sources
- 6.1.3 Data Triangulation
- 6.2 Market Estimation and Forecast

