|
|
市場調査レポート
商品コード
1423539
不耕起・最小耕起装置市場- 世界および地域別分析:製品別、用途別、国別分析、サプライチェーン分析:分析と予測(2023年~2028年)No-Till and Minimum-Till Equipment Market - A Global and Regional Analysis: Focus on Product, Application, Supply Chain Analysis, and Country Analysis - Analysis and Forecast, 2023-2028 |
||||||
|
|||||||
カスタマイズ可能
|
|||||||

| 不耕起・最小耕起装置市場- 世界および地域別分析:製品別、用途別、国別分析、サプライチェーン分析:分析と予測(2023年~2028年) |
|
出版日: 2024年02月13日
発行: BIS Research
ページ情報: 英文 138 Pages
納期: 1~5営業日
|

全表示
- 概要
- 図表
- 目次
世界の不耕起・最小耕起装置の市場規模は、2028年までに88億7,000万米ドルに達する見込みです。
不耕起・最小耕起装置市場は、世界の農業産業における技術進歩の継続により、予測期間を通じて急成長が見込まれています。世界の不耕起・最小耕起装置の市場規模は、2023年に65億8,000万米ドルとなりました。同市場は今後、CAGR6.15%で成長し、2028年には88億7,000万米ドルに達すると予測されています。
| 主要市場統計 | |
|---|---|
| 予測期間 | 2023年~2028年 |
| 2023年の評価 | 65億8,000万米ドル |
| 2028年予測 | 88億7,000万米ドル |
| CAGR | 6.15% |
土壌の健全性と肥沃度を向上させる被覆作物戦略は、不耕起・最小耕起装置分野の成長を促進しています。マメ科植物と牧草は、農家が浸食を減らし、雑草を抑制し、有機物を改善するために使用する被覆作物の一例です。これにより土壌構造が強化され、生物多様性が増加し、輪作作物が多様化します。自然の窒素固定を助けることで、被覆作物は化学肥料の必要性を減らすのに役立ちます。これに対して生産者は、環境に配慮した農業へのスムーズな移行を促進し、長期的な土壌保全と環境スチュワードシップを奨励する、カスタマイズされたアドオンを提供しています。
当レポートでは、世界の不耕起・最小耕起装置市場について調査し、市場の概要とともに、用途別、製品別、地域別の動向、および市場に参入する企業のプロファイルなどを提供しています。
目次
調査範囲
エグゼクティブサマリー
第1章 市場
- 業界の展望
- ビジネスダイナミクス
- 資金調達と投資の情勢
第2章 用途
- 世界の不耕起・最小耕起装置市場(用途別)
第3章 製品
- 世界の不耕起・最小耕起装置市場(製品別)
- サプライチェーン分析
- 価格分析
- 特許分析
第4章 地域
- 北米
- 南米
- 欧州
- 英国
- 中東・アフリカ
- 中国
- アジア太平洋
第5章 市場-競合ベンチマーキングと企業プロファイル
- 競合ベンチマーキング
- 競合マトリックス
- 市場シェア分析
- 企業プロファイル
- Vaderstad Group
- YETTER MANUFACTURING CO., INC.
- Salford Group Inc.
- Great Plains Ag
- Deere & Company
- CNH Industrial N.V.
- AGCO Corporation
- KUBOTA Corporation
- Alamo Group Inc.
- Kinze Manufacturing
- Clean Seed Capital
- HORSCH LLC.
第6章 調査手法
List of Figures
- Figure 1: Scope Definition
- Figure 2: No-Till and Minimum-Till Equipment Market: Market Coverage
- Figure 3: Factors Driving the Need for No-Till and Minimum-Till Equipment Market
- Figure 4: Global No-Till and Minimum-Till Equipment Market, $Billion, 2022-2028
- Figure 5: Market Dynamics of the No-Till and Minimum-Till Equipment Market
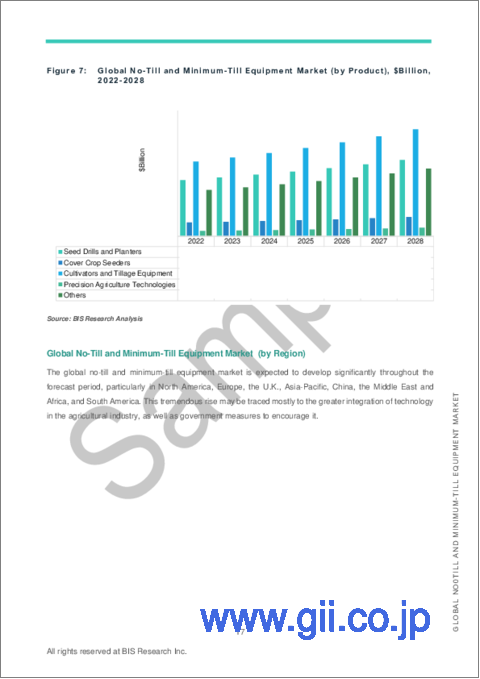
- Figure 6: Global No-Till and Minimum-Till Equipment Market (by Application), $Billion, 2022-2028
- Figure 7: Global No-Till and Minimum-Till Equipment Market (by Product), $Billion, 2022-2028
- Figure 8: Global No-Till and Minimum-Till Equipment Market (by Region), $Billion, 2022
- Figure 9: Soil Fertility Trends After 10 Years (2005-2015) of Conservation Tillage in Organic Farming
- Figure 10: Winter Runoff Analysis: Treatment Comparison and Phase-Specific Means with Standard Errors in the Four-Year Rotation
- Figure 11: Comparison of Average Crop Machinery Cost Per Acre from 2010-2014 using No-Till and Tilled
- Figure 12: Share of Key Market Strategies and Developments, January 2019-November 2023
- Figure 13: Share of Product Development and Innovations (by Company), January 2019-November 2023
- Figure 14: Share of Market Development (by Company), January 2019-November 2023
- Figure 15: Share of Mergers and Acquisitions (by Company), January 2019- November 2023
- Figure 16: Comparison of Percentage of Corn Acres and their Yield Levels in Advanced No-Till and Minimum-Tilled
- Figure 17: Salford Group Inc.(part of Linamar Corporation) - Case Study
- Figure 18: Kinze Manufacturing - Case Study
- Figure 19: Investment and Funding Landscape (by Year), $Million, January 2019-November 2023
- Figure 20: Investment and Funding Landscape (by Company), Share (%), January 2019-November 2023
- Figure 21: Investment and Funding Landscape (by Country), Share (%), January 2019-November 2023
- Figure 22: Supply Chain Analysis of No-Till and Minimum-Till Equipment Market
- Figure 23: Competitive Benchmarking for Key No-Till and Minimum-Till Equipment Providers
- Figure 24: Market Share Analysis of Global No-Till and Minimum-Till Equipment Market, 2022
- Figure 25: Vaderstad Group: Product and Customer Portfolio Analysis
- Figure 26: YETTER MANUFACTURING CO., INC.: Product and Customer Portfolio Analysis
- Figure 27: Salford Group Inc: Product and Customer Portfolio Analysis
- Figure 28: Great Plains Ag: Product and Customer Portfolio Analysis
- Figure 29: Deere & Company: Product and Customer Portfolio Analysis
- Figure 30: CNH Industrial N.V.: Product and Customer Portfolio Analysis
- Figure 31: AGCO Corporation: Product and Customer Portfolio Analysis
- Figure 32: Kubota Corporation: Product and Customer Portfolio Analysis
- Figure 33: Alamo Group Inc.: Product and Customer Portfolio Analysis
- Figure 34: Kinze Manufacturing: Product and Customer Portfolio Analysis
- Figure 35: Summers Manufacturing, Inc.: Product and Customer Portfolio Analysis
- Figure 36: HORSCH LLC.: Product and Customer Portfolio Analysis
- Figure 37: Data Triangulation
- Figure 38: Top-Down and Bottom-Up Approach
- Figure 39: Assumptions and Limitations
List of Tables
- Table 1: Key Consortiums and Associations in the No-Till and Minimum-Till Equipment Market
- Table 2: Description and Impact of Government Initiative
- Table 3: Price Range of Key Products Available in the Market
The Global No-Till and Minimum-Till Equipment Market Expected to Reach $8.87 Billion by 2028
Introduction to the No-Till and Minimum-Till Equipment Market
The market for no-till and minimum-till equipment is anticipated to grow quickly throughout the forecast period as a result of the ongoing technical advancements in the global agriculture industry. The global market for no-till and minimum-till equipment was estimated to be worth $6.58 billion in 2023 and is projected to grow at a compound annual growth rate (CAGR) of 6.15% to reach $8.87 billion in 2028.
| KEY MARKET STATISTICS | |
|---|---|
| Forecast Period | 2023 - 2028 |
| 2023 Evaluation | $6.58 Billion |
| 2028 Forecast | $8.87 Billion |
| CAGR | 6.15% |
By improving soil health and fertility, cover cropping strategies are propelling growth in the no-till and minimum-till equipment sectors. Legumes and grasses are examples of cover crops that farmers use to reduce erosion, control weeds, and improve organic matter. This enhances soil structure, increases biodiversity, and diversifies crop rotations. By helping with natural nitrogen fixation, cover crops help cut down on the need for chemical fertilizers. In response, producers provide customized add-ons that facilitate a smooth transition into environmentally conscious farming and encourage long-term soil conservation and environmental stewardship.
For this study, all consortiums and associations in the no-till and minimum-till equipment market have been categorized according to their focus area and functions. The majority of industries nowadays are backed by industrial consortiums and associations, which are made up of a number of government agencies, businesses, researchers, and veterans. Through events and yearly conferences, these industry groups serve as a repository of information and connections, promote research and development by honoring trailblazing technologists, and foster networking within the sector.
Market Segmentation:
Segmentation 1: by Application
- Farms and Agricultural Fields
- Orchards and Vineyards
- Pastures and Grazing Lands
- Nurseries and Urban Agriculture
- Others
Segmentation 2: by Product
- Seed Drills and Planters
- Cover Crop Seeders
- Cultivators and Tillage Equipment
- Precision Agriculture Technologies
- Others
Segmentation 3: by Region
- North America - U.S., Canada, Mexico
- Europe - Germany, France, Netherlands, Italy, Belgium, Ukraine, Switzerland, Greece, and Rest-of-Europe
- Asia-Pacific - Japan, South Korea, Australia, and Rest-of-Asia-Pacific
- China
- U.K.
- Middle East and Africa - Israel, South Africa, Turkey, Rest-of-Middle East and Africa
- South America - Brazil, Argentina, Rest-of-South America
Recent Developments in the No-Till and Minimum-Till Equipment Market
- In September 2023, Yetter Farm Equipment and Fast Ag Solutions partnered to develop DuraPlacer. DuraPlacer was positioned to enhance strip-till/freshening productivity combined with nutrient application. Fast's DuraPlacer line integrated efficient 60' or 40' strip-till or strip freshening with unmatched nutrient application productivity.
- In June 2023, Vaderstad, one of the key companies in tillage and seeding equipment manufacturing, expanded the facility of Vaderstad Components in Overum, Sweden.
- In February 2023, Great Plains introduced its true vertical tillage implement, the VT1100 Turbo-Max. The new VT1100 Turbo-Max has been redesigned to further its agronomic benefits while building on the Turbo-Max true vertical tillage legacy.
Demand - Drivers, Challenges, and Opportunities
Market Drivers:
Water conservation is one of the main forces behind the adoption of minimum- and no-till farming practices. By enhancing soil water retention, these methods lessen the frequency of irrigation. Farmers may maximize water use to ensure crops receive enough moisture without wasting too much by preserving soil structure and reducing water runoff. In addition to protecting a valuable resource, this emphasis on water efficiency supports sustainable agricultural methods and complies with international water conservation mandates. According to the USDA, no-till farming increases the amount of water that may penetrate the soil and benefit crops by reducing water runoff by 30% to 50%. In Australia, minimum-till farming has been shown to reduce irrigation water use by 40%, which has been very helpful in protecting water supplies in arid areas.
Market Challenges:
A major commercial challenge in the no-till and minimum-till equipment market is supply chain disruptions. A sophisticated international supply chain is involved in the manufacture and delivery of precision equipment and specialized agricultural machines. Events in geopolitics, natural disasters, or unanticipated crises (such as the COVID-19 pandemic) can cause supply chain disruptions that cause shortages of essential parts and delays in the delivery of equipment.
Manufacturers in this sector must take proactive steps to control and reduce these risks, such as strategic planning of the supply chain, supplier diversification, and backup plans. Unexpected interruptions can cause problems for the entire economic ecosystem by affecting farmers' access to critical equipment, raising expenses, and impacting production schedules.
Market Opportunities:
In the no-till and minimum-till equipment sector, developing and marketing cutting-edge agricultural equipment that causes the least amount of soil disturbance is a fantastic economic opportunity. Demand for cutting-edge equipment that functions well with minimal disturbance to the soil is developing as a result of the increased emphasis on sustainable farming. Examples of these tools include accurate cultivators and planters. Companies producing and delivering such cutting-edge machinery might gain a significant portion of the market, satisfying the demands of environmentally concerned farmers and fostering the expansion of sustainable agriculture. The USDA reports that in 2022, farmers using minimum- and no-till techniques adopted precision agricultural technologies at a rate of 15% higher than before. It is difficult to easily integrate these technologies into current machinery, necessitating additional expenditures for machinery upgrades or retrofits.
How can this report add value to an organization?
Product/Innovation Strategy: In the dynamic landscape of the no-till and minimum-till equipment market, significant advancements are revolutionizing agricultural practices, with a dedicated focus on optimizing farm performance. Harnessing cutting-edge solutions, including AI-driven analytics and real-time monitoring platforms, no-till and minimum-till equipment provide detailed insights into soil health, crop management, and resource utilization. Innovations such as precision agriculture techniques contribute to efficient farming practices, ensuring optimal crop yield and environmental sustainability. The market encompasses a diverse range of solutions, from state-of-the-art planting equipment to precision seeding systems, empowering farmers to enhance operational efficiency and minimize resource utilization effectively.
Growth/Marketing Strategy: The no-till and minimum-till equipment market is undergoing a remarkable transformation, mirroring the growth strategies observed in the server GPU sector. Key players in the industry are strategically expanding their business horizons, fostering collaborations, and entering partnerships to fortify their global presence. This trend aligns with the shift toward climate-smart agriculture, where companies are not only focused on technological advancements but also on sustainable farming practices. The synergy between technology firms and agricultural experts is driving the development of cutting-edge, climate-smart monitoring tools. Joint ventures and collaborative initiatives are instrumental in integrating diverse expertise, ultimately enhancing the market presence of these climate-smart solutions. This collaborative approach is pivotal in creating comprehensive, user-friendly, and efficient solutions for the evolving landscape of no-till and minimum-till agriculture.
Competitive Strategy: In the ever-evolving landscape of the no-till and minimum-till equipment market, manufacturers are diversifying their product offerings to address a wide range of agricultural needs and practices. Comprehensive competitive analysis underscores the specific capabilities of market participants, showcasing their tailored solutions and specialized knowledge in different regions. Collaborations with agricultural research institutions and technology organizations play a crucial role in fostering innovation and steering the continual transformation of the no-till and minimum-till equipment sector.
Research Methodology
The research methodology design adopted for this specific study includes a mix of data collected from primary and secondary research. Both primary sources (in-house experts, industry leaders, and market players) and secondary research (a host of paid and unpaid databases), along with analytical tools, are employed to build the forecast and predictive models.
Data Sources
The research methodology design adopted for this specific study includes a mix of data collected from primary and secondary research. Both primary sources (in-house experts, industry leaders, and market players) and secondary research (a host of paid and unpaid databases), along with analytical tools, are employed to build the forecast and predictive models.
Primary Data Sources
The primary sources involve the no-till and minimum-till industry experts and stakeholders such as equipment and device manufacturers and suppliers. Respondents such as vice presidents, CEOs, marketing directors, and technology and innovation directors have been interviewed to verify this research study's qualitative and quantitative aspects.
The key data points taken from primary sources include:
- validation and triangulation of all the numbers and graphs
- validation of reports segmentation and key qualitative findings
- understanding the competitive landscape
- validation of the numbers of various markets for market type
- percentage split of individual markets for region-wise analysis
Key Market Players and Competition Synopsis
The global agriculture sector has faced a looming labor crisis and environmental concerns such as soil conservation and carbon sequestration. The shift toward conservation tillage methods not only preserves the environment but also contributes to increased yields and cost savings for farmers. As the agricultural industry prioritizes sustainability, the no-till and minimum-till equipment market is poised for continued expansion. According to the United States Department of Agriculture (USDA), the adoption of no-till and minimum-tillage practices has steadily increased in North America. In the U.S., for instance, the USDA reports a substantial rise in the use of no-till farming methods, with over 35% of cropland employing these practices. This trend has been driven by government initiatives promoting sustainable agriculture and soil conservation.
Efficient farming relies largely on zero tillage, utilizing no-till machinery for crop management, harvesting, and site preparation. It enhances their quality of life and expands their employment options. Utilizing no-till machinery improves land preparation and soil health, freeing up farmers' time for other pursuits. A new trend in the no-till and minimum-till equipment market is precision in no-till farming. Through programs such as Pitch AgriHack, where the government introduces new technology to aid agricultural transformation, regions such as Africa are encouraging students to pursue careers in agriculture.
Some prominent names established in this market are as follows:
- Deere & Company
- CNH Industrial N.V.
- AGCO Corporation
- Great Plains AG
- Vaderstad Group
Table of Contents
Scope of the Study
Executive Summary
1 Markets
- 1.1 Industry Outlook
- 1.1.1 Ongoing Trends
- 1.1.1.1 Expansion of Cover Cropping Techniques for Soil Health Enhancement
- 1.1.1.2 Integration of Digital Farming Platforms for Data-Driven Decision-Making
- 1.1.1.3 Emerging Automation in No-Till and Minimum-Till Equipment
- 1.1.2 Ecosystem/Ongoing Programs
- 1.1.2.1 Consortiums and Associations
- 1.1.2.2 Government Initiatives and their Impacts
- 1.1.1 Ongoing Trends
- 1.2 Business Dynamics
- 1.2.1 Business Drivers
- 1.2.1.1 Environmental Sustainability and Soil Health
- 1.2.1.2 Water Conservation and Efficiency
- 1.2.1.3 Reduced Chemical Usage and Pesticide Management
- 1.2.1.4 Governmental Support and Policy Initiatives
- 1.2.2 Business Challenges
- 1.2.2.1 Initial Capital Investments
- 1.2.2.2 Supply Chain Disruptions in the No-Till and Minimum-Till Equipment Market
- 1.2.2.3 Knowledge and Skill Gap
- 1.2.3 Market Strategies and Developments
- 1.2.3.1 Business Strategies
- 1.2.3.1.1 Product Development and Innovations
- 1.2.3.1.2 Market Development
- 1.2.3.2 Corporate Strategies
- 1.2.3.2.1 Mergers and Acquisitions
- 1.2.3.2.2 Partnerships, Collaborations, Joint Ventures, and Alliances
- 1.2.3.2.3 Others
- 1.2.3.1 Business Strategies
- 1.2.4 Business Opportunities
- 1.2.4.1 Advanced No-Till and Minimum-Till Equipment Technology
- 1.2.4.2 Eco-Friendly Farming Input Supply Chain
- 1.2.5 Case Studies
- 1.2.1 Business Drivers
- 1.3 Funding and Investment Landscape
- 1.3.1 Funding Analysis (by Year)
- 1.3.2 Funding Analysis (by Company)
- 1.3.3 Funding Analysis (by Country)
2 Application
- 2.1 Global No-Till and Minimum-Till Equipment Market (by Application)
- 2.1.1 Farm and Agricultural Fields
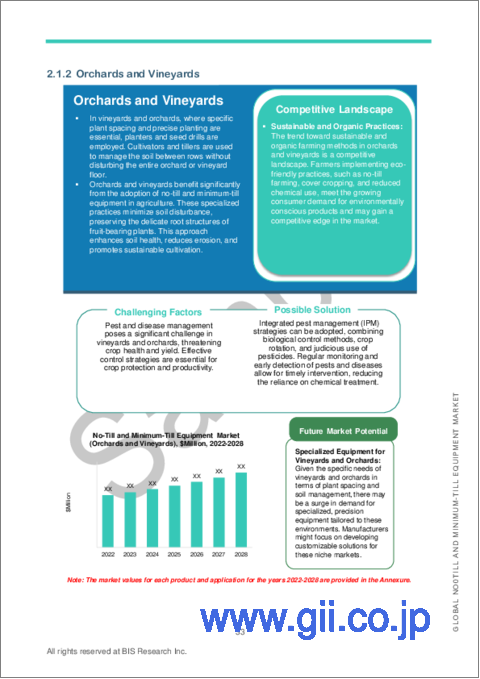
- 2.1.2 Orchards and Vineyards
- 2.1.3 Pastures and Grazing Lands
- 2.1.4 Nurseries and Urban Agriculture
- 2.1.5 Others
3 Products
- 3.1 Global No-Till and Minimum-Till Equipment Market (by Product)
- 3.1.1 Seed Drills and Planters
- 3.1.2 Cover Crop Seeders
- 3.1.3 Cultivators and Tillage Equipment
- 3.1.4 Precision Agriculture Technologies
- 3.1.5 Others
- 3.2 Supply Chain Analysis
- 3.3 Pricing Analysis
- 3.4 Patent Analysis
4 Regions
- 4.1 North America
- 4.1.1 North America (by Country)
- 4.1.1.1 U.S.
- 4.1.1.2 Canada
- 4.1.1.3 Mexico
- 4.1.1 North America (by Country)
- 4.2 South America
- 4.2.1 South America (by Country)
- 4.2.1.1 Brazil
- 4.2.1.2 Argentina
- 4.2.1.3 Rest-of-South America
- 4.2.1 South America (by Country)
- 4.3 Europe
- 4.3.1 Europe (by Country)
- 4.3.1.1 Italy
- 4.3.1.2 France
- 4.3.1.3 Germany
- 4.3.1.4 Netherland
- 4.3.1.5 Belgium
- 4.3.1.6 Switzerland
- 4.3.1.7 Greece
- 4.3.1.8 Ukraine
- 4.3.1.9 Rest-of-Europe
- 4.3.1 Europe (by Country)
- 4.4 U. K.
- 4.5 Middle East and Africa
- 4.5.1 Middle East and Africa (by Country)
- 4.5.1.1 Israel
- 4.5.1.2 South Africa
- 4.5.1.3 Turkey
- 4.5.1.4 Rest-of-Middle East and Africa
- 4.5.1 Middle East and Africa (by Country)
- 4.6 China
- 4.7 Asia-Pacific
- 4.7.1 Asia-Pacific (by Country)
- 4.7.1.1 South Korea
- 4.7.1.2 Australia
- 4.7.1.3 Japan
- 4.7.1.4 Rest-of Asia-Pacific
- 4.7.1 Asia-Pacific (by Country)
5 Markets - Competitive Benchmarking & Company Profiles
- 5.1 Competitive Benchmarking
- 5.1.1 Competitive Position Matrix
- 5.1.2 Market Share Analysis
- 5.2 Company Profiles
- 5.2.1 Vaderstad Group
- 5.2.1.1 Company Overview
- 5.2.1.2 Product and Customer Portfolio Analysis
- 5.2.2 YETTER MANUFACTURING CO., INC.
- 5.2.2.1 Company Overview
- 5.2.2.2 Product and Customer Portfolio Analysis
- 5.2.3 Salford Group Inc. (part of Linamar Corporation)
- 5.2.3.1 Company Overview
- 5.2.3.2 Product and Customer Portfolio Analysis
- 5.2.4 Great Plains Ag
- 5.2.4.1 Company Overview
- 5.2.4.2 Product and Customer Portfolio Analysis
- 5.2.5 Deere & Company
- 5.2.5.1 Company Overview
- 5.2.5.2 Product and Customer Portfolio Analysis
- 5.2.6 CNH Industrial N.V.
- 5.2.6.1 Company Overview
- 5.2.6.2 Product and Customer Portfolio Analysis
- 5.2.7 AGCO Corporation
- 5.2.7.1 Company Overview
- 5.2.7.2 Product and Customer Portfolio Analysis
- 5.2.8 KUBOTA Corporation
- 5.2.8.1 Company Overview
- 5.2.8.2 Product and Customer Portfolio Analysis
- 5.2.9 Alamo Group Inc.
- 5.2.9.1 Company Overview
- 5.2.9.2 Product and Customer Portfolio Analysis
- 5.2.10 Kinze Manufacturing
- 5.2.10.1 Company Overview
- 5.2.10.2 Product and Customer Portfolio Analysis
- 5.2.11 Clean Seed Capital
- 5.2.11.1 Company Overview
- 5.2.11.2 Product and Customer Portfolio Analysis
- 5.2.12 HORSCH LLC.
- 5.2.12.1 Company Overview
- 5.2.12.2 Product and Customer Portfolio Analysis
- 5.2.1 Vaderstad Group
6 Research Methodology
- 6.1 Data Sources
- 6.1.1 Primary Data Sources
- 6.1.2 Secondary Data Sources
- 6.2 Market Estimation and Forecast
- 6.2.1 Factors for Data Prediction and Modeling

