|
|
市場調査レポート
商品コード
1416210
欧州のバイオLNG市場 - 分析と予測(2023年~2032年)Europe Bio-LNG Market: Analysis and Forecast, 2023-2032 |
||||||
|
|
|||||||
|
● お客様のご希望に応じて、既存データの加工や未掲載情報(例:国別セグメント)の追加などの対応が可能です。 詳細はお問い合わせください。 |
|||||||


| 欧州のバイオLNG市場 - 分析と予測(2023年~2032年) |
|
出版日: 2024年01月26日
発行: BIS Research
ページ情報: 英文 119 Pages
納期: 1~5営業日
|
- 全表示
- 概要
- 図表
- 目次
| 主要市場統計 | |
|---|---|
| 予測期間 | 2023年~2032年 |
| 2023年評価 | 3億8,540万米ドル |
| 2032年予測 | 19億8,300万米ドル |
| CAGR | 20% |
欧州のバイオLNGの市場規模(英国を除く)は、2023年に3億8,540万米ドルとなりました。
同市場は、2032年には19億8,300万米ドルに達すると予測され、予測期間の2023年~2032年年のCAGRは20.0%になると見込まれています。バイオLNG市場は、自動車や海運のようなセクターからの需要増に牽引され、成長の態勢を整えています。さらに、自動車産業は、バイオLNGの生産と利用を促進することを目的とした政府の政策やインセンティブに支えられ、バイオLNGをますます受け入れるようになると予想されます。
欧州のバイオLNG市場は、いくつかの重要な要因により大きな成長を遂げています。第一に、この地域では、よりクリーンで持続可能な燃料オプションの必要性に対する認識が高まっています。再生可能な資源に由来するバイオLNGは、様々な産業において温室効果ガスの排出を削減するための実行可能なソリューションと見なされています。
第二に、二酸化炭素排出量の削減と再生可能エネルギー源の促進を含む欧州連合の野心的な気候変動目標が、バイオLNGの採用を後押ししています。これは、気候変動と闘い、より環境に優しい代替エネルギーへの移行を目指すこの地域のコミットメントと一致しています。
さらに、農業残渣や有機廃棄物など、バイオLNG生産のための原料供給源が入手可能であることも、市場の成長に寄与しています。これらの原料は、高度な技術とプロセスによってバイオLNGに変換することができます。
また、欧州のバイオLNG市場は、再生可能燃料の利用促進を目的とした政府の奨励策や政策に支えられており、業界関係者にとって有利な規制環境が整っています。
当レポートでは、欧州のバイオLNG市場について調査し、市場の概要とともに、用途別、原料別、国別の動向、および市場に参入する企業のプロファイルなどを提供しています。
目次
エグゼクティブサマリー
調査範囲
第1章 市場
- 業界の展望
- ビジネスダイナミクス
- スタートアップの情勢
第2章 地域
- 欧州
- 市場
- 用途
- 製品
- 欧州(国別)
- 英国
- 市場
- 用途
- 製品
第3章 市場- 競合ベンチマーキングと企業プロファイル
- 競合ベンチマーキング
- 競合マトリックス
- ソース別の主要企業の製品マトリックス
- 主要企業の市場シェア分析、2022年
- 企業プロファイル
- TotalEnergies SE
- Linde plc
- MAKEEN Energy
- Nordsol
- Flogas Britain Limited
- DBG Group B.V.
- Gasum Ltd
- RUHE Biogas Service GmbH
- LIQVIS GmbH
- Cycle0
- Titan LNG
- Alexela
- EnviTec Biogas AG
- Scandinavian Biogas Fuels International AB
- Scale Gas Solutions
- GREEN CREATE
- Biomet SpA
第4章 調査手法
List of Figures
- Figure 1: Europe Bio-LNG Market, $Million, 2022, 2023, and 2032
- Figure 2: Europe Bio-LNG Market (by Application), $Million, 2022, 2032
- Figure 3: Europe Bio-LNG Market (by Source), $Million, 2022, 2032
- Figure 4: Bio-LNG Market (by Region), $Million, 2022, 2032
- Figure 5: Conventional Fuel Prices, 2020, 2021
- Figure 6: Supply Chain Analysis of Bio-LNG Market
- Figure 7: Green Methanol Market Snapshot
- Figure 8: Global CO2 Emissions from Transport by Subsector, 2020, (%)
- Figure 9: New Registrations of Medium and Heavy Trucks Over 3.5 Tons by Fuel Type in the EU in 2020
- Figure 10: R&D Expenditure: TotalEnergies SE, 2020-2022
- Figure 11: R&D Expenditure: Linde plc, 2019-2021
- Figure 12: Research Methodology
- Figure 13: Top-Down and Bottom-Up Approach
- Figure 14: Bio-LNG Market Influencing Factors
- Figure 15: Assumptions and Limitations
List of Tables
- Table 1: List of Consortiums and Associations
- Table 2: List of Regulatory Bodies
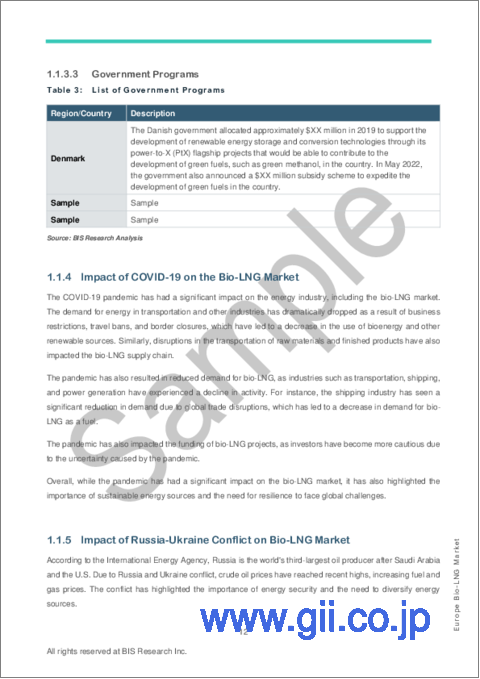
- Table 3: List of Government Programs
- Table 4: Key Product Developments
- Table 5: Key Market Developments
- Table 6: Key Mergers and Acquisitions
- Table 7: Key Partnerships and Joint Ventures
- Table 8: Bio-LNG Market (by Region), Kilo Tons, 2022-2032
- Table 9: Bio-LNG Market (by Region), $Million, 2022-2032
- Table 10: Europe Bio-LNG Market (by Application), Kilo Tons, 2022-2032
- Table 11: Europe Bio-LNG Market (by Application), $Million, 2022-2032
- Table 12: Europe Bio-LNG Market (by Source), Kilo Tons, 2022-2032
- Table 13: Europe Bio-LNG Market (by Source), $Million, 2022-2032
- Table 14: Germany Bio-LNG Market (by Application), Kilo Tons, 2022-2032
- Table 15: Germany Bio-LNG Market (by Application), $Million, 2022-2032
- Table 16: Germany Bio-LNG Market (by Source), Kilo Tons, 2022-2032
- Table 17: Germany Bio-LNG Market (by Source), $Million, 2022-2032
- Table 18: France Bio-LNG Market (by Application), Kilo Tons, 2022-2032
- Table 19: France Bio-LNG Market (by Application), $Million, 2022-2032
- Table 20: France Bio-LNG Market (by Source), Kilo Tons, 2022-2032
- Table 21: France Bio-LNG Market (by Source), $Million, 2022-2032
- Table 22: Netherlands Bio-LNG Market (by Application), Kilo Tons, 2022-2032
- Table 23: Netherlands Bio-LNG Market (by Application), $Million, 2022-2032
- Table 24: Netherlands Bio-LNG Market (by Source), Kilo Tons, 2022-2032
- Table 25: Netherlands Bio-LNG Market (by Source), $Million, 2022-2032
- Table 26: Italy Bio-LNG Market (by Application), Kilo Tons, 2022-2032
- Table 27: Italy Bio-LNG Market (by Application), $Million, 2022-2032
- Table 28: Italy Bio-LNG Market (by Source), Kilo Tons, 2022-2032
- Table 29: Italy Bio-LNG Market (by Source), $Million, 2022-2032
- Table 30: Scandinavian Bio-LNG Market (by Application), Kilo Tons, 2022-2032
- Table 31: Scandinavian Bio-LNG Market (by Application), $Million, 2022-2032
- Table 32: Scandinavian Bio-LNG Market (by Source), Kilo Tons, 2022-2032
- Table 33: Scandinavian Bio-LNG Market (by Source), $Million, 2022-2032
- Table 34: Rest-of-Europe Bio-LNG Market (by Application), Kilo Tons, 2022-2032
- Table 35: Rest-of-Europe Bio-LNG Market (by Application), $Million, 2022-2032
- Table 36: Rest-of-Europe Bio-LNG Market (by Source), Kilo Tons, 2022-2032
- Table 37: Rest-of-Europe Bio-LNG Market (by Source), $Million, 2022-2032
- Table 38: U.K. Bio-LNG Market (by Application), Kilo Tons, 2022-2032
- Table 39: U.K. Bio-LNG Market (by Application), $Million, 2022-2032
- Table 40: U.K. Bio-LNG Market (by Source), Kilo Tons, 2022-2032
- Table 41: U.K. Bio-LNG Market (by Source), $Million, 2022-2032
- Table 42: Product Matrix for Key Companies, By Source
- Table 43: Market Share of Key Companies, 2022
“The Europe Bio-LNG Market (excluding U.K.) Expected to Reach $1,983.0 Million by 2032.”
Introduction to Europe Bio-LNG Market
| KEY MARKET STATISTICS | |
|---|---|
| Forecast Period | 2023 - 2032 |
| 2023 Evaluation | $385.4 Million |
| 2032 Forecast | $1,983.0 Million |
| CAGR | 20% |
The Europe bio-LNG market (excluding U.K.) was valued at $385.4 million in 2023 and is anticipated to reach $1,983.0 million by 2032, witnessing a CAGR of 20.0% during the forecast period 2023-2032. The bio-LNG market is poised for growth, driven by rising demand from sectors like automotive and maritime. Additionally, the automobile industry is expected to increasingly embrace bio-LNG, supported by government policies and incentives aimed at promoting bio-LNG production and utilization in different geographic areas.
Market Introduction
The Europe Bio-LNG market is experiencing significant growth due to several key factors. First, there is a growing awareness of the need for cleaner and more sustainable fuel options in the region. Bio-LNG, derived from renewable sources, is seen as a viable solution to reduce greenhouse gas emissions in various industries.
Second, the European Union's ambitious climate goals, which include reducing carbon emissions and promoting renewable energy sources, are driving the adoption of bio-LNG. This aligns with the region's commitment to combat climate change and transition to greener energy alternatives.
Additionally, the availability of feedstock sources for bio-LNG production, such as agricultural residues and organic waste, is contributing to market growth. These feedstocks can be converted into bio-LNG through advanced technologies and processes.
Furthermore, the Europe Bio-LNG market is supported by government incentives and policies aimed at promoting the use of renewable fuels, creating a favorable regulatory environment for industry players.
Market Segmentation:
Segmentation 1: by Application
- Automotive
- Ships
- Others
Segmentation 2: by Source
- Agriculture Residues
- Industrial Waste
- Household Waste
- Others
Segmentation 3: by Country
- Germany
- France
- Netherlands
- Italy
- Scandinavian
- Rest-of-Europe
How can this report add value to an organization?
Product/Innovation Strategy: The product segment helps the reader to understand the different sources involved in producing bio-LNG. Moreover, the study provides the reader with a detailed understanding of the Europe bio-LNG market based on the application (automotive, ships, and others). Bio-LNG is gaining traction in different applications on the back of sustainability concerns and less nitrogen oxide emissions. They are also being used for controlling greenhouse gas (GHG) emissions.
Growth/Marketing Strategy: The Europe bio-LNG market has seen major development by key players operating in the market, such as business expansions, partnerships, collaborations, mergers and acquisitions, and joint ventures. The favored strategy for the companies has been product developments, business expansions, and acquisitions to strengthen their position in the Europe bio-LNG market.
Competitive Strategy: Key players in the Europe bio-LNG market analyzed and profiled in the study involve bio-LNG manufacturers and the overall ecosystem. Moreover, a detailed competitive benchmarking of the players operating in the Europe bio-LNG market has been done to help the reader understand how players stack against each other, presenting a clear market landscape. Additionally, comprehensive competitive strategies such as partnerships, agreements, acquisitions, and collaborations will aid the reader in understanding the untapped revenue pockets in the market.
Key Market Players and Competition Synopsis
The companies that are profiled have been selected based on inputs gathered from primary experts, analyzing company coverage, product portfolio, and market penetration.
Key Companies Profiled:
|
|
Table of Contents
Executive Summary
Scope of the Study
1. Markets
- 1.1. Industry Outlook
- 1.1.1. Trends: Current and Future
- 1.1.1.1. Favorable Government Policies Supporting Bio-LNG Production
- 1.1.1.2. Rise in Fossil Fuel-Based Alternative Price
- 1.1.2. Supply Chain Analysis
- 1.1.3. Ecosystem/Ongoing Programs
- 1.1.3.1. Consortiums and Associations
- 1.1.3.2. Regulatory Bodies
- 1.1.3.3. Government Programs
- 1.1.4. Impact of COVID-19 on the Bio-LNG Market
- 1.1.5. Impact of Russia-Ukraine Conflict on Bio-LNG Market
- 1.1.6. Comparative Analysis of Bio-LNG and its Substitutes
- 1.1.7. Snapshot of Green Methanol Market
- 1.1.7.1. Leading Countries in the Green Methanol Market
- 1.1.7.2. Leading Companies in Green Methanol Market
- 1.1.7.3. Green Methanol Projections
- 1.1.1. Trends: Current and Future
- 1.2. Business Dynamics
- 1.2.1. Business Drivers
- 1.2.1.1. Rising Environmental Concerns
- 1.2.1.2. Increasing Number of LNG Trucks
- 1.2.2. Business Challenges
- 1.2.2.1. Limited Availability of Feedstocks
- 1.2.2.2. High Price of Bio-LNG as Compared to LNG
- 1.2.3. Business Strategies
- 1.2.3.1. Product Developments
- 1.2.3.2. Market Developments
- 1.2.4. Corporate Strategies
- 1.2.4.1. Mergers and Acquisitions
- 1.2.4.2. Partnerships and Joint Ventures
- 1.2.5. Business Opportunities
- 1.2.5.1. Increase in Demand from Shipping Industry
- 1.2.5.2. Technological Advancement
- 1.2.1. Business Drivers
- 1.3. Start-Up Landscape
- 1.3.1. Key Start-Ups in the Ecosystem
2. Regions
- 2.1. Europe
- 2.1.1. Markets
- 2.1.1.1. Key Producers/ Suppliers in Europe
- 2.1.1.2. Business Drivers
- 2.1.1.3. Business Challenges
- 2.1.2. Application
- 2.1.2.1. Europe Bio-LNG Market (by Application), Volume and Value Data
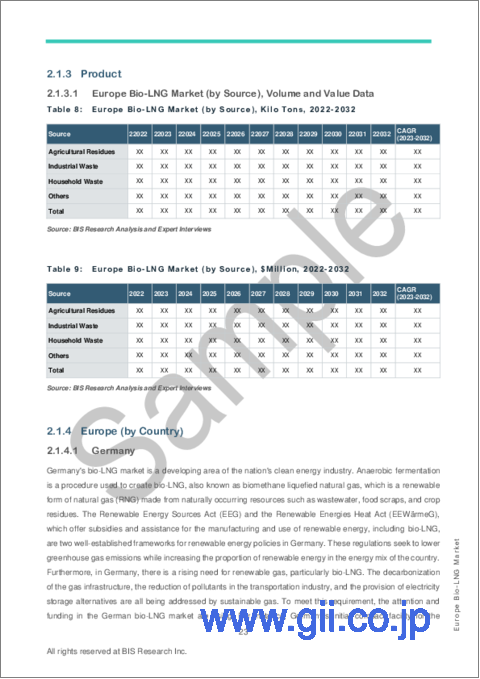
- 2.1.3. Product
- 2.1.3.1. Europe Bio-LNG Market (by Source), Volume and Value Data
- 2.1.4. Europe (by Country)
- 2.1.4.1. Germany
- 2.1.4.1.1. Market
- 2.1.4.1.1.1. Buyer Attributes
- 2.1.4.1.1.2. Key Producers and Suppliers in Germany
- 2.1.4.1.1.3. Regulatory Landscape
- 2.1.4.1.1.4. Business Drivers
- 2.1.4.1.1.5. Business Challenges
- 2.1.4.1.2. Application
- 2.1.4.1.2.1. Germany Bio-LNG Market (by Application), Volume and Value Data
- 2.1.4.1.3. Products
- 2.1.4.1.3.1. Germany Bio-LNG Market (by Source), Volume and Value Data
- 2.1.4.1.1. Market
- 2.1.4.2. France
- 2.1.4.2.1. Market
- 2.1.4.2.1.1. Buyer Attributes
- 2.1.4.2.1.2. Key Producers and Suppliers in France
- 2.1.4.2.1.3. Regulatory Landscape
- 2.1.4.2.1.4. Business Drivers
- 2.1.4.2.1.5. Business Challenges
- 2.1.4.2.2. Application
- 2.1.4.2.2.1. France Bio-LNG Market (by Application), Volume and Value Data
- 2.1.4.2.3. Product
- 2.1.4.2.3.1. France Bio-LNG Market (by Source), Volume and Value Data
- 2.1.4.2.1. Market
- 2.1.4.3. Netherlands
- 2.1.4.3.1. Markets
- 2.1.4.3.1.1. Buyer Attributes
- 2.1.4.3.1.2. Key Producers and Suppliers in the Netherlands
- 2.1.4.3.1.3. Regulatory Landscape
- 2.1.4.3.1.4. Business Drivers
- 2.1.4.3.1.5. Business Challenges
- 2.1.4.3.2. Application
- 2.1.4.3.2.1. Netherlands Bio-LNG Market (by Application), Volume and Value Data
- 2.1.4.3.3. Product
- 2.1.4.3.3.1. Netherlands Bio-LNG Market (by Source), Volume and Value Data
- 2.1.4.3.1. Markets
- 2.1.4.4. Italy
- 2.1.4.4.1. Market
- 2.1.4.4.1.1. Buyer Attributes
- 2.1.4.4.1.2. Key Producers and Suppliers in Italy
- 2.1.4.4.1.3. Regulatory Landscape
- 2.1.4.4.1.4. Business Drivers
- 2.1.4.4.1.5. Business Challenges
- 2.1.4.4.2. Application
- 2.1.4.4.2.1. Italy Bio-LNG Market (by Application), Volume and Value Data
- 2.1.4.4.3. Product
- 2.1.4.4.3.1. Italy Bio-LNG Market (by Source), Volume and Value Data
- 2.1.4.4.1. Market
- 2.1.4.5. Scandinavian
- 2.1.4.5.1. Market
- 2.1.4.5.1.1. Buyer Attributes
- 2.1.4.5.1.2. Key Producers and Suppliers in Scandinavian
- 2.1.4.5.1.3. Regulatory Landscape
- 2.1.4.5.1.4. Business Drivers
- 2.1.4.5.1.5. Business Challenges
- 2.1.4.5.2. Application
- 2.1.4.5.2.1. Scandinavian Bio-LNG Market (by Application), Volume and Value Data
- 2.1.4.5.3. Product
- 2.1.4.5.3.1. Scandinavian Bio-LNG Market (by Source), Volume and Value Data
- 2.1.4.5.1. Market
- 2.1.4.6. Rest-of-Europe (RoE)
- 2.1.4.6.1. Market
- 2.1.4.6.1.1. Buyer Attributes
- 2.1.4.6.1.2. Key Producers and Suppliers in Rest-of-Europe
- 2.1.4.6.1.3. Business Drivers
- 2.1.4.6.1.4. Business Challenges
- 2.1.4.6.2. Application
- 2.1.4.6.2.1. Rest-of-Europe Bio-LNG Market (by Application), Volume and Value Data
- 2.1.4.6.3. Product
- 2.1.4.6.3.1. Rest-of-Europe Bio-LNG Market (by Source), Volume and Value Data
- 2.1.4.6.1. Market
- 2.1.4.1. Germany
- 2.1.1. Markets
- 2.2. U.K.
- 2.2.1. Market
- 2.2.1.1. Buyer Attributes
- 2.2.1.2. Key Producers and Suppliers in the U.K.
- 2.2.1.3. Regulatory Landscape
- 2.2.1.4. Business Drivers
- 2.2.1.5. Business Challenges
- 2.2.2. Application
- 2.2.2.1. U.K. Bio-LNG Market (by Application), Volume and Value Data
- 2.2.3. Product
- 2.2.3.1. U.K. Bio-LNG Market (by Source), Volume and Value Data
- 2.2.1. Market
3. Markets - Competitive Benchmarking & Company Profiles
- 3.1. Competitive Benchmarking
- 3.1.1. Competitive Position Matrix
- 3.1.2. Product Matrix for Key Companies, By Source
- 3.1.3. Market Share Analysis of Key Companies, 2022
- 3.2. Company Profiles
- 3.2.1. TotalEnergies SE
- 3.2.1.1. Company Overview
- 3.2.1.2. Role of TotalEnergies SE in the Bio-LNG Market
- 3.2.1.3. Product Portfolio
- 3.2.1.4. Production Sites
- 3.2.1.5. Business Strategies
- 3.2.1.5.1. Market Developments
- 3.2.1.6. Corporate Strategies
- 3.2.1.6.1. Mergers, Acquisitions, Partnerships, and Joint Ventures
- 3.2.1.7. R&D Analysis
- 3.2.1.8. Analyst View
- 3.2.2. Linde plc
- 3.2.2.1. Company Overview
- 3.2.2.2. Role of Linde plc in the Bio-LNG Market
- 3.2.2.3. Product Portfolio
- 3.2.2.4. Production Sites
- 3.2.2.5. Business Strategies
- 3.2.2.5.1. Market Developments
- 3.2.2.6. R&D Analysis
- 3.2.2.7. Analyst View
- 3.2.3. MAKEEN Energy
- 3.2.3.1. Company Overview
- 3.2.3.2. Role of MAKEEN Energy in the Bio-LNG Market
- 3.2.3.3. Product Portfolio
- 3.2.3.4. Production Site
- 3.2.3.4.1. Market Developments
- 3.2.3.5. Analyst View
- 3.2.4. Nordsol
- 3.2.4.1. Company Overview
- 3.2.4.2. Role of Nordsol in the Bio-LNG Market
- 3.2.4.3. Product Portfolio
- 3.2.4.4. Production Site
- 3.2.4.5. Business Strategies
- 3.2.4.5.1. Market Developments
- 3.2.4.6. Corporate Strategies
- 3.2.4.6.1. Mergers, Acquisitions, Partnerships, and Joint Ventures
- 3.2.4.7. Analyst View
- 3.2.5. Flogas Britain Limited
- 3.2.5.1. Company Overview
- 3.2.5.2. Role of Flogas Britain Limited in the Bio-LNG Market
- 3.2.5.3. Product Portfolio
- 3.2.5.4. Production Site
- 3.2.5.5. Business Strategies
- 3.2.5.5.1. Product Developments
- 3.2.5.6. Analyst View
- 3.2.6. DBG Group B.V.
- 3.2.6.1. Company Overview
- 3.2.6.2. Role of DBG Group B.V. in the Bio-LNG Market
- 3.2.6.3. Product Portfolio
- 3.2.6.4. Production Site
- 3.2.6.5. Business Strategies
- 3.2.6.5.1. Product Developments
- 3.2.6.6. Analyst View
- 3.2.7. Gasum Ltd
- 3.2.7.1. Company Overview
- 3.2.7.2. Role of Gasum Ltd in the Bio-LNG Market
- 3.2.7.3. Product Portfolio
- 3.2.7.4. Production Site
- 3.2.7.5. Business Strategies
- 3.2.7.5.1. Product Developments
- 3.2.7.6. Analyst View
- 3.2.8. RUHE Biogas Service GmbH
- 3.2.8.1. Company Overview
- 3.2.8.2. Role of RUHE Biogas Service GmbH in the Bio-LNG Market
- 3.2.8.3. Product Portfolio
- 3.2.8.4. Production Site
- 3.2.8.5. Business Strategies
- 3.2.8.5.1. Product Developments
- 3.2.8.6. Analyst View
- 3.2.9. LIQVIS GmbH
- 3.2.9.1. Company Overview
- 3.2.9.2. Role of LIQVIS GmbH in the Bio-LNG Market
- 3.2.9.3. Product Portfolio
- 3.2.9.4. Production Site
- 3.2.9.5. Analyst View
- 3.2.10. Cycle0
- 3.2.10.1. Company Overview
- 3.2.10.2. Role of Cycle0 in the Bio-LNG Market
- 3.2.10.3. Product Portfolio
- 3.2.10.4. Production Site
- 3.2.10.5. Business Strategies
- 3.2.10.5.1. Product Developments
- 3.2.10.6. Analyst View
- 3.2.11. Titan LNG
- 3.2.11.1. Company Overview
- 3.2.11.2. Role of Titan LNG in the Bio-LNG Market
- 3.2.11.3. Product Portfolio
- 3.2.11.4. Production Site
- 3.2.11.5. Business Strategies
- 3.2.11.5.1. Product Developments
- 3.2.11.6. Analyst View
- 3.2.12. Alexela
- 3.2.12.1. Company Overview
- 3.2.12.2. Role of Alexela in the Bio-LNG Market
- 3.2.12.3. Product Portfolio
- 3.2.12.4. Production Site
- 3.2.12.5. Business Strategies
- 3.2.12.5.1. Product Developments
- 3.2.12.6. Analyst View
- 3.2.13. EnviTec Biogas AG
- 3.2.13.1. Company Overview
- 3.2.13.2. Role of EnviTec Biogas AG in the Bio-LNG Market
- 3.2.13.3. Product Portfolio
- 3.2.13.4. Production Site
- 3.2.13.5. Business Strategies
- 3.2.13.5.1. Product Developments
- 3.2.13.6. Analyst View
- 3.2.14. Scandinavian Biogas Fuels International AB
- 3.2.14.1. Company Overview
- 3.2.14.2. Role of Scandinavian Biogas Fuels International AB in the Bio-LNG Market
- 3.2.14.3. Product Portfolio
- 3.2.14.4. Production Site
- 3.2.14.5. Business Strategies
- 3.2.14.5.1. Product Developments
- 3.2.14.6. Analyst View
- 3.2.15. Scale Gas Solutions
- 3.2.15.1. Company Overview
- 3.2.15.2. Role of Scale Gas Solutions in the Bio-LNG Market
- 3.2.15.3. Product Portfolio
- 3.2.15.4. Production Sites
- 3.2.15.5. Analyst View
- 3.2.16. GREEN CREATE
- 3.2.16.1. Company Overview
- 3.2.16.2. Role of GREEN CREATE in the Bio-LNG Market
- 3.2.16.3. Product Portfolio
- 3.2.16.4. Production Site
- 3.2.16.5. Business Strategies
- 3.2.16.5.1. Product Developments
- 3.2.16.6. Analyst View
- 3.2.17. Biomet SpA
- 3.2.17.1. Company Overview
- 3.2.17.2. Role of Biomet SpA in the Bio-LNG Market
- 3.2.17.3. Product Portfolio
- 3.2.17.4. Production Site
- 3.2.17.5. Business Strategies
- 3.2.17.5.1. Product Developments
- 3.2.17.6. Analyst View
- 3.2.1. TotalEnergies SE