|
|
市場調査レポート
商品コード
1397351
マイクロキャリアの世界市場:バイオ医薬品製造、エンドユーザー、製品、12カ国超のデータへの焦点- 分析と予測、2024~2033年Global Microcarriers Market: Focus on Biopharmaceutical Production, End User, Products, and Over 12 Countries' Data - Analysis and Forecast, 2024-2033 |
||||||
|
|
|||||||
|
● お客様のご希望に応じて、既存データの加工や未掲載情報(例:国別セグメント)の追加などの対応が可能です。 詳細はお問い合わせください。 |
|||||||


| マイクロキャリアの世界市場:バイオ医薬品製造、エンドユーザー、製品、12カ国超のデータへの焦点- 分析と予測、2024~2033年 |
|
出版日: 2023年12月17日
発行: BIS Research
ページ情報: 英文 153 Pages
納期: 1~5営業日
|
- 全表示
- 概要
- 図表
- 目次
世界のマイクロキャリアの市場は、バイオテクノロジーの進歩と個別化医療への需要の拡大により、爆発的な成長を示すと予測されています。
また、細胞ベースのワクチンや治療に対する需要の高まり、生物製剤やバイオシミラー産業の急速な台頭、細胞治療研究のためのR&D費や資金の増加といった要因も同市場を牽引しています。
マイクロキャリアは、大規模製造時の固定費および変動費を削減し、費用対効果の高い細胞生産を支援します。現代の状況は技術改良により変化し、細胞治療におけるマイクロキャリアの重要性が高まっています。
当レポートでは、世界のマイクロキャリアの市場を調査し、市場の背景・概要、市場成長への各種影響因子の分析、特許動向、法規制環境、市場規模の推移・予測、各種区分・地域別の詳細分析、競合情勢、主要企業の分析などをまとめています。
目次
エグゼクティブサマリー
範囲と定義
第1章 市場
- 動向:現在および将来の影響評価
- サプライチェーンの概要
- バリューチェーン分析
- マーケットマップ
- R&Dレビュー
- 国・企業別の特許出願動向
- 規制状況
- 主要な世界的出来事の影響分析:COVID-19
- 市場力学の概要
- 市場促進要因
- 市場抑制要因
- 市場機会
第2章 用途
- 用途の分類
- 用途の概要
- 世界のマイクロキャリア市場 (バイオ医薬品製造区分別)
- ワクチン製造
- 治療用タンパク質製造
- 組織工学・再生
- その他
- 世界のマイクロキャリア市場 (エンドユーザー別)
- バイオ医薬品企業
- 受託研究・製造機関
- 学術・研究機関
- 細胞バンク
- その他
第3章 製品
- 製品の分類
- 製品概要
- 世界のマイクロキャリア市場 (製品別)
- 市場概要
- 世界のマイクロキャリア市場 (製品別)
- 消耗品
- 機器
第4章 地域
- 地域概要
- 促進要因・抑制要因
- 北米
- 欧州
- アジア太平洋
- ラテンアメリカ
- 中東・アフリカ
第5章 市場:競合ベンチマーキング・企業プロファイル
- 次のフロンティア
- 地域的評価
- Teijin Ltd
- Bio-Rad Laboratories, Inc.
- Sartorius Stedim Biotech S.A.
- Thermo FIsher Scientific Inc.
- Eppendorf AG
- Danaher Corporation
- Corning Incorporated
- Beckton, Dickson & Company
- Lonza AG
- Entegris, Inc.
- Fujifilm Holdings Corporation
- Asahhi Kasei Corporation
- Percell Biolytica AB
第6章 調査手法
List of Figures
- Figure 1. Region/country Largest Share of Market
- Figure 2. Global Microcarriers Market, by Application Type, 2022, 2026 and 2033
- Figure 3. Global Microcarriers Market, by End User, 2022, 2026 and 2033
- Figure 4. Global Microcarriers Market, by Product, 2022, 2026 and 2033
- Figure 5. Global Microcarriers Market, Recent Developments
- Figure 6. Supply chain and Identifying Risks within the Supply Chain
- Figure 7. Global Microcarriers Market, by Country, January 2020-December 2023
- Figure 8. Global Microcarriers Market, by Company, January 2020-December 2023
- Figure 9. Impact Analysis of Market Navigating Factors
- Figure 10. U.S. Microcarriers Market, By End User ($ Million), 2022, 2026 and 2033
- Figure 11. U.S. Microcarriers Market, By Product Type ($ Million), 2022, 2026 and 2033
- Figure 12. Canada Microcarriers Market, By End User ($ Million), 2022, 2026 and 2033
- Figure 13. Canada Microcarriers Market, By Product Type ($ Million), 2022, 2026 and 2033
- Figure 14. France Microcarriers Market, By End User ($ Million), 2022, 2026 and 2033
- Figure 15. France Microcarriers Market, By Product Type ($ Million), 2022, 2026 and 2033
- Figure 16. Germany Microcarriers Market, By End User ($ Million), 2022, 2026 and 2033
- Figure 17. Germany Microcarriers Market, By Product Type ($ Million), 2022, 2026 and 2033
- Figure 18. U.K. Microcarriers Market, By End User ($ Million), 2022, 2026 and 2033
- Figure 19. U.K. Microcarriers Market, By Product Type ($ Million), 2022, 2026 and 2033
- Figure 20. Italy Microcarriers Market, By End User ($ Million), 2022, 2026 and 2033
- Figure 21. Italy Microcarriers Market, By Product Type ($ Million), 2022, 2026 and 2033
- Figure 22. Spain Microcarriers Market, By End User ($ Million), 2022, 2026 and 2033
- Figure 23. Spain Microcarriers Market, By Product Type ($ Million), 2022, 2026 and 2033
- Figure 24. Rest-of-Europe Microcarriers Market, By End User ($ Million), 2022, 2026 and 2033
- Figure 25. Rest-of-Europe Microcarriers Market, By Product Type ($ Million), 2022, 2026 and 2033
- Figure 26. China Microcarriers Market, By End User ($ Million), 2022, 2026 and 2033
- Figure 27. China Microcarriers Market, By Product Type ($ Million), 2022, 2026 and 2033
- Figure 28. India Microcarriers Market, By End User ($ Million), 2022, 2026 and 2033
- Figure 29. India Microcarriers Market, By Product Type ($ Million), 2022, 2026 and 2033
- Figure 30. Japan Microcarriers Market, By End User ($ Million), 2022, 2026 and 2033
- Figure 31. Japan Microcarriers Market, By Product Type ($ Million), 2022, 2026 and 2033
- Figure 32. Australia Microcarriers Market, By End User ($ Million), 2022, 2026 and 2033
- Figure 33. Australia Microcarriers Market, By Product Type ($ Million), 2022, 2026 and 2033
- Figure 34. Rest-of-Asia-Pacific Microcarriers Market, By End User ($ Million), 2022, 2026 and 2033
- Figure 35. Rest-of-Asia-Pacific Microcarriers Market, By Product Type ($ Million), 2022, 2026 and 2033
- Figure 36. Argentina Microcarriers Market, By End User ($ Million), 2022, 2026 and 2033
- Figure 37. Argentina Microcarriers Market, By Product Type ($ Million), 2022, 2026 and 2033
- Figure 38. Brazil Microcarriers Market, By End User ($ Million), 2022, 2026 and 2033
- Figure 39. Brazil Microcarriers Market, By Product Type ($ Million), 2022, 2026 and 2033
- Figure 40. Mexico Microcarriers Market, By End User ($ Million), 2022, 2026 and 2033
- Figure 41. Mexico Microcarriers Market, By Product Type ($ Million), 2022, 2026 and 2033
- Figure 42. Rest-of-Latin America Microcarriers Market, By End User ($ Million), 2022-2033
- Figure 43. Rest-of-Latin America Microcarriers Market, By Product Type ($ Million), 2022-2033
- Figure 44. Strategic Initiatives, 2020 - 2023
- Figure 45. Share of Strategic Initiatives
- Figure 46. Data Triangulation
- Figure 47. Top-Down and Bottom-Up Approach
- Figure 48. Assumptions and Limitations
List of Tables
- Table 1: Market Snapshot
- Table 2: Global Microcarriers Market, Opportunities
- Table 3: Global Microcarriers Market, by ProductType $ Million, 2022-2033
- Table 4: Global Microcarriers Market, By Region, ($ Million), 2022-2033
- Table 5: North America Microcarriers Market, By End User ($ Million), 2022-2033
- Table 6: North America Microcarriers Market, By Product Type ($ Million), 2022-2033
- Table 7: U.S. Microcarriers Market, By End User ($ Million), 2022-2033
- Table 8: U.S. Microcarriers Market, By Product Type ($ Million), 2022-2033
- Table 9: Canada Microcarriers Market, By End User ($ Million), 2022-2033
- Table 10: Canada Microcarriers Market, By Product Type ($ Million), 2022-2033
- Table 11: Europe Microcarriers Market, By End User ($ Million), 2022-2033
- Table 12: Europe Microcarriers Market, By Product Type ($ Million), 2022-2033
- Table 13: France Microcarriers Market, By End User ($ Million), 2022-2033
- Table 14: France Microcarriers Market, By Product Type ($ Million), 2022-2033
- Table 15: Germany Microcarriers Market, By End User ($ Million), 2022-2033
- Table 16: Germany Microcarriers Market, By Product Type ($ Million), 2022-2033
- Table 17: U.K. Microcarriers Market, By End User ($ Million), 2022-2033
- Table 18: U.K. Microcarriers Market, By Product Type ($ Million), 2022-2033
- Table 19: Italy Microcarriers Market, By End User ($ Million), 2022-2033
- Table 20: Italy Microcarriers Market, By Product Type ($ Million), 2022-2033
- Table 21: Spain Microcarriers Market, By End User ($ Million), 2022-2033
- Table 22: Spain Microcarriers Market, By Product Type ($ Million), 2022-2033
- Table 23: Rest-of-Europe Microcarriers Market, By End User ($ Million), 2022-2033
- Table 24: Rest-of-Europe Microcarriers Market, By Product Type ($ Million), 2022-2033
- Table 25: Asia Pacific Microcarriers Market, By End User ($ Million), 2022-2033
- Table 26: Asia Pacific Microcarriers Market, By Product Type ($ Million), 2022-2033
- Table 27: China Microcarriers Market, By End User ($ Million), 2022-2033
- Table 28: China Microcarriers Market, By Product Type ($ Million), 2022-2033
- Table 29: India Microcarriers Market, By End User ($ Million), 2022-2033
- Table 30: India Microcarriers Market, By Product Type ($ Million), 2022-2033
- Table 31: Japan Microcarriers Market, By End User ($ Million), 2022-2033
- Table 32: Japan Microcarriers Market, By Product Type ($ Million), 2022-2033
- Table 33: Australia Microcarriers Market, By End User ($ Million), 2022-2033
- Table 34: Australia Microcarriers Market, By Product Type ($ Million), 2022-2033
- Table 35: Rest-of-Asia-Pacific Microcarriers Market, By End User ($ Million), 2022-2033
- Table 36: Rest-of-Asia-Pacific Microcarriers Market, By Product Type ($ Million), 2022-2033
- Table 37: Latin America Microcarriers Market, By End User ($ Million), 2022-2033
- Table 38: Latin America Microcarriers Market, By Product Type ($ Million), 2022-2033
- Table 39: Argentina Microcarriers Market, By End User ($ Million), 2022-2033
- Table 40: Argentina Microcarriers Market, By Product Type ($ Million), 2022-2033
- Table 41: Brazil Microcarriers Market, By End User ($ Million), 2022-2033
- Table 42: Brazil Microcarriers Market, By Product Type ($ Million), 2022-2033
- Table 43: Mexico Microcarriers Market, By End User ($ Million), 2022-2033
- Table 44: Mexico Microcarriers Market, By Product Type ($ Million), 2022-2033
- Table 45: Rest-of-Latin America Microcarriers Market, By End User ($ Million), 2022-2033
- Table 46: Rest-of-Latin America Microcarriers Market, By Product Type ($ Million), 2022-2033
- Table 47: Middle East and Africa Microcarriers Market, By End User ($ Million), 2022-2033
- Table 48: Middle East and Africa Microcarriers Market, By Product Type ($ Million), 2022-2033
- Table 49: Market Share
“Global Microcarrier Market Set for Explosive Growth, Driven by Biotech Advancements and Rising Demand for Personalized Medicine.”
The Global Microcarriers Market Analysis and Forecast report offer a comprehensive overview of the microcarriers market, highlighting key trends, growth drivers, challenges, and opportunities shaping this dynamic industry. The report provides insights into the market's present scenario and future projections, catering to stakeholders, investors, and decision-makers seeking to understand market dynamics and make informed business decisions.
This report delves into various facets of the microcarriers market, including market segmentation by type, end-user, application, and product type. It explores the latest advancements in microcarrier technology and assesses their impact on industries such as biopharmaceuticals, cell therapy, regenerative medicine, and more.
Regional analysis covering North America, Europe, Asia Pacific, Latin America, and the Middle East & Africa, with insights into market trends and growth opportunities in each region is also included in this report. Competitive landscape profiling major players, such as Lonza AG, Teijin Ltd, Eppendorf AG, their market share, strategic initiatives, and future outlook provide a comprehensive understanding of the market landscape, empowering stakeholders to strategize and capitalize on opportunities while navigating challenges in this evolving market.
Factors such as rising demand for cell-based vaccines and therapies, the rapid rise of the biologics and biosimilar industry, and increased R&D and funding available for cell therapy research are driving the microcarrier market.
Microcarriers aid to cost-effective cell production by lowering both fixed and variable costs during large-scale manufacturing. The contemporary landscape has changed as a result of technical improvements, and the importance of microcarriers in cell treatment has grown. There are currently on the market dissolvable microcarriers made of cross-linked polysaccharide polymers that can be efficiently dissolved during the cell harvest stage. Because the microcarriers are totally dissolved, there is no need for separation, and the downstream process proceeds smoothly. As a result, these microcarriers are regarded as advantageous beads for large-scale cell manufacturing or cell treatment applications.
In addition to the remarks made above, another element driving the rise of cell therapy applications of microcarriers is that companies are presently focusing on the provision of microcarriers that contribute to large-scale and cost-effective production. Corning Incorporated, for example, offers dissolvable microcarriers. These variables contribute to the expansion of cell therapy applications.
Key Questions Answered in this Report:
- What are the focus areas of the global microcarriers market in the upcoming years?
- What is the value of revenue generated from microcarriers market across the globe and at what rate is the demand expected to grow during the forecast period?
- Which product(s) is poised to be the primary revenue generator in the global microcarriers market?
- Among microcarriers segments, which is projected to capture the largest market share?
- In terms of applications, which segment is forecasted to experience the highest Compound Annual Growth Rate (CAGR) during the forecast period?
- Which end-user segment accounted for the largest share of the microcarriers market?
- What are the key growth factors of this market? What are the major opportunities for existing market players and new entrants in the global microcarriers market? What are the major challenges faced by the existing players in the market?
- Who are the major players dominating in the global microcarriers market space?
- Which regions/countries are expected to offer significant growth opportunities for the vendors operating in the microcarriers market for the forecast period?
Table of Contents
Executive Summary
Scope and Definition
1. Markets
- 1.1. Trends: Current and Future Impact Assessment
- 1.1.1. Sample Text
- 1.1.2. Trend 1
- 1.1.3. Trend 2
- 1.1.4. Trend 3
- 1.2. Supply Chain Overview
- 1.2.1. Value Chain Analysis
- 1.2.2. Market Map
- 1.3. Research and Development Review
- 1.3.1. Patent Filing Trend (by Country, Company)
- 1.4. Regulatory Landscape
- 1.5. Impact Analysis for Key Global Events- Covid-19
- 1.6. Market Dynamics Overview
- 1.6.1. Market Drivers
- 1.6.2. Market Restraints
- 1.6.3. Market Opportunities
2. Application
- 2.1. Application Segmentation
- 2.2. Application Summary
- 2.3. Global Microcarriers Market (by Biopharmaceutical Production)
- 2.3.1. Vaccine Production
- 2.3.2. Therapeutic Protein Production
- 2.3.3. Tissue Engineering and Regenerative
- 2.3.3.1. By Therapy Type
- 2.3.3.1.1. Cell and Gene Therapy
- 2.3.3.1.2. Other Therapies
- 2.3.3.2. by Cell Type
- 2.3.3.2.1. Stem Cells
- 2.3.3.2.2. Immune Cells
- 2.3.3.2.3. Other Cell Types
- 2.3.3.1. By Therapy Type
- 2.3.4. Others
- 2.4. Global Microcarriers Market (by End User)
- 2.4.1. Biopharmaceutical Companies
- 2.4.2. Contract Research and Manufacturing Organisations
- 2.4.3. Academic and Research Institutes
- 2.4.4. Cell Banks
- 2.4.5. Others
3. Products
- 3.1. Product Segmentation
- 3.2. Product Summary
- 3.3. Global Microcarriers Market - (by Product)
- 3.3.1. Market Overview
- 3.3.1.1. Analyst View
- 3.3.1. Market Overview
- 3.4. Global Microcarriers Market (by Product)
- 3.4.1. Consumables
- 3.4.1.1. Media
- 3.4.1.1.1. Serum-based Media
- 3.4.1.1.2. Serum-free Media
- 3.4.1.2. Other Media
- 3.4.1.3. Reagents
- 3.4.1.4. Microcarrier Beads
- 3.4.1.4.1. Collagen-coated Beads
- 3.4.1.4.2. Cationic Beads
- 3.4.1.4.3. Protein-coated Beads
- 3.4.1.4.4. Untreated Beads
- 3.4.1.4.5. Other Microcarrier Beads
- 3.4.1.5. Others
- 3.4.1.1. Media
- 3.4.2. Equipments
- 3.4.2.1. Bioreactors
- 3.4.2.1.1. Stainless-steel Bioreactors
- 3.4.2.1.2. Single-use Bioreactors
- 3.4.2.2. Culture Vessels
- 3.4.2.3. Cell Counters
- 3.4.2.4. Others
- 3.4.2.1. Bioreactors
- 3.4.1. Consumables
4. Regions
- 4.1. Regional Summary
- 4.2. Drivers and Restraints
- 4.3. North America
- 4.3.1. Regional Overview
- 4.3.2. Driving Factors for Market Growth
- 4.3.3. Factors Challenging the Market
- 4.3.4. Application
- 4.3.5. Product
- 4.3.6. U.S.
- 4.3.7. Application
- 4.3.8. Product
- 4.3.9. U.S. Microcarriers Market by Application
- 4.3.10. U.S. Microcarriers Market by Product
- 4.3.11. Canada
- 4.3.12. Application
- 4.3.13. Product
- 4.3.14. Canada Microcarriers Market by Application
- 4.3.15. Canada Microcarriers Market by Product
- 4.4. Europe
- 4.4.1. Regional Overview
- 4.4.2. Driving Factors for Market Growth
- 4.4.3. Factors Challenging the Market
- 4.4.4. Application
- 4.4.5. Product
- 4.4.6. France
- 4.4.7. Application
- 4.4.8. Product
- 4.4.9. France Microcarriers Market by Application
- 4.4.10. France Microcarriers Market by Product
- 4.4.11. Germany
- 4.4.12. Application
- 4.4.13. Product
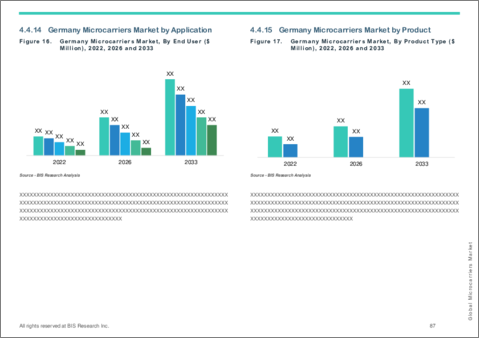
- 4.4.14. Germany Microcarriers Market by Application
- 4.4.15. Germany Microcarriers Market by Product
- 4.4.16. U.K.
- 4.4.17. Application
- 4.4.18. Product
- 4.4.19. U.K. Microcarriers Market by Application
- 4.4.20. U.K. Microcarriers Market by Product
- 4.4.21. Italy
- 4.4.22. Application
- 4.4.23. Product
- 4.4.24. Italy Microcarriers Market by Application
- 4.4.25. Italy Microcarriers Market by Product
- 4.4.26. Spain
- 4.4.27. Application
- 4.4.28. Product
- 4.4.29. Spain Microcarriers Market by Application
- 4.4.30. Spain Microcarriers Market by Product
- 4.4.31. Rest of Europe
- 4.4.32. Application
- 4.4.33. Product
- 4.4.34. Rest-of-Europe Microcarriers Market by Application
- 4.4.35. Rest-of-Europe Microcarriers Market by Product
- 4.5. Asia Pacific
- 4.5.1. Regional Overview
- 4.5.2. Driving Factors for Market Growth
- 4.5.3. Factors Challenging the Market
- 4.5.4. Application
- 4.5.5. Product
- 4.5.6. China
- 4.5.7. Application
- 4.5.8. Product
- 4.5.9. China Microcarriers Market by Application
- 4.5.10. China Microcarriers Market by Product
- 4.5.11. India
- 4.5.12. Application
- 4.5.13. Product
- 4.5.14. India Microcarriers Market by Application
- 4.5.15. India Microcarriers Market by Product
- 4.5.16. Japan
- 4.5.17. Application
- 4.5.18. Product
- 4.5.19. Japan Microcarriers Market by Application
- 4.5.20. Japan Microcarriers Market by Product
- 4.5.21. Australia
- 4.5.22. Application
- 4.5.23. Product
- 4.5.24. Australia Microcarriers Market by Application
- 4.5.25. Australia Microcarriers Market by Product
- 4.5.26. Rest-of-Asia-Pacific
- 4.5.27. Application
- 4.5.28. Product
- 4.5.29. Rest-of-Asia-Pacific Microcarriers Market by Application
- 4.5.30. Rest-of-Asia-Pacific Microcarriers Market by Product
- 4.6. Latin America
- 4.6.1. Regional Overview
- 4.6.2. Driving Factors for Market Growth
- 4.6.3. Factors Challenging the Market
- 4.6.4. Application
- 4.6.5. Product
- 4.6.6. Argentina
- 4.6.7. Application
- 4.6.8. Product
- 4.6.9. Argentina Microcarriers Market by Application
- 4.6.10. Argentina Microcarriers Market by Product
- 4.6.11. Brazil
- 4.6.12. Application
- 4.6.13. Product
- 4.6.14. Brazil Microcarriers Market by Application
- 4.6.15. Brazil Microcarriers Market by Product
- 4.6.16. Mexico
- 4.6.17. Application
- 4.6.18. Product
- 4.6.19. Mexico Microcarriers Market by Application
- 4.6.20. Mexico Microcarriers Market by Product
- 4.6.21. Rest-of-Latin America
- 4.6.22. Application
- 4.6.23. Product
- 4.6.24. Rest-of-Latin America Microcarriers Market by Application
- 4.6.25. Rest-of-Latin America Microcarriers Market by Product
- 4.7. Middle East and Africa
- 4.7.1. Regional Overview
- 4.7.2. Driving Factors for Market Growth
- 4.7.3. Factors Challenging the Market
- 4.7.4. Application
- 4.7.5. Product
5. Markets - Competitive Benchmarking & Company Profiles
- 5.1. Next Frontiers…..
- 5.2. Geographic Assessment
- 5.2.1. Teijin Ltd
- 5.2.1.1. Overview
- 5.2.1.2. Top Products / Product Portfolio
- 5.2.1.3. Top Competitors
- 5.2.1.4. Target Customers
- 5.2.1.5. Key Personnel
- 5.2.1.6. Analyst View
- 5.2.1.7. Market Share
- 5.2.2. Bio-Rad Laboratories, Inc.
- 5.2.2.1. Overview
- 5.2.2.2. Top Products / Product Portfolio
- 5.2.2.3. Top Competitors
- 5.2.2.4. Target Customers
- 5.2.2.5. Key Personnel
- 5.2.2.6. Analyst View
- 5.2.2.7. Market Share
- 5.2.3. Sartorius Stedim Biotech S.A.
- 5.2.3.1. Overview
- 5.2.3.2. Top Products / Product Portfolio
- 5.2.3.3. Top Competitors
- 5.2.3.4. Target Customers
- 5.2.3.5. Key Personnel
- 5.2.3.6. Analyst View
- 5.2.3.7. Market Share
- 5.2.4. Thermo FIsher Scientific Inc.
- 5.2.4.1. Overview
- 5.2.4.2. Top Products / Product Portfolio
- 5.2.4.3. Top Competitors
- 5.2.4.4. Target Customers
- 5.2.4.5. Key Personnel
- 5.2.4.6. Analyst View
- 5.2.4.7. Market Share
- 5.2.5. Eppendorf AG
- 5.2.5.1. Overview
- 5.2.5.2. Top Products / Product Portfolio
- 5.2.5.3. Top Competitors
- 5.2.5.4. Target Customers
- 5.2.5.5. Key Personnel
- 5.2.5.6. Analyst View
- 5.2.5.7. Market Share
- 5.2.6. Danaher Corporation
- 5.2.6.1. Overview
- 5.2.6.2. Top Products / Product Portfolio
- 5.2.6.3. Top Competitors
- 5.2.6.4. Target Customers
- 5.2.6.5. Key Personnel
- 5.2.6.6. Analyst View
- 5.2.6.7. Market Share
- 5.2.7. Corning Incorporated
- 5.2.7.1. Overview
- 5.2.7.2. Top Products / Product Portfolio
- 5.2.7.3. Top Competitors
- 5.2.7.4. Target Customers
- 5.2.7.5. Key Personnel
- 5.2.7.6. Analyst View
- 5.2.7.7. Market Share
- 5.2.8. Beckton, Dickson & Company
- 5.2.8.1. Overview
- 5.2.8.2. Top Products / Product Portfolio
- 5.2.8.3. Top Competitors
- 5.2.8.4. Target Customers
- 5.2.8.5. Key Personnel
- 5.2.8.6. Analyst View
- 5.2.8.7. Market Share
- 5.2.9. Lonza AG
- 5.2.9.1. Overview
- 5.2.9.2. Top Products / Product Portfolio
- 5.2.9.3. Top Competitors
- 5.2.9.4. Target Customers
- 5.2.9.5. Key Personnel
- 5.2.9.6. Analyst View
- 5.2.9.7. Market Share
- 5.2.10. Entegris, Inc.
- 5.2.10.1. Overview
- 5.2.10.2. Top Products / Product Portfolio
- 5.2.10.3. Top Competitors
- 5.2.10.4. Target Customers
- 5.2.10.5. Key Personnel
- 5.2.10.6. Analyst View
- 5.2.10.7. Market Share
- 5.2.11. Fujifilm Holdings Corporation
- 5.2.11.1. Overview
- 5.2.11.2. Top Products / Product Portfolio
- 5.2.11.3. Top Competitors
- 5.2.11.4. Target Customers
- 5.2.11.5. Key Personnel
- 5.2.11.6. Analyst View
- 5.2.11.7. Market Share
- 5.2.12. Asahhi Kasei Corporation
- 5.2.12.1. Overview
- 5.2.12.2. Top Products / Product Portfolio
- 5.2.12.3. Top Competitors
- 5.2.12.4. Target Customers
- 5.2.12.5. Key Personnel
- 5.2.12.6. Analyst View
- 5.2.12.7. Market Share
- 5.2.13. Percell Biolytica AB
- 5.2.13.1. Overview
- 5.2.13.2. Top Products / Product Portfolio
- 5.2.13.3. Top Competitors
- 5.2.13.4. Target Customers
- 5.2.13.5. Key Personnel
- 5.2.13.6. Analyst View
- 5.2.13.7. Market Share
- 5.2.1. Teijin Ltd
6. Research Methodology
- 6.1. Data Sources
- 6.1.1. Primary Data Sources
- 6.1.2. Secondary Data Sources
- 6.1.3. Data Triangulation
- 6.2. Market Estimation and Forecast