|
|
市場調査レポート
商品コード
1397349
生物農薬市場:世界および地域分析 (2023-2033年)Biorational Pesticides Market: A Global and Regional Analysis, 2023-2033 |
||||||
|
|
|||||||
カスタマイズ可能
|
|||||||


| 生物農薬市場:世界および地域分析 (2023-2033年) |
|
出版日: 2023年12月17日
発行: BIS Research
ページ情報: 英文 232 Pages
納期: 1~5営業日
|

- 全表示
- 概要
- 目次
世界の生物農薬の市場は、農業の実践が持続可能で環境に優しいソリューションへとシフトする中で、大きな成長を遂げています。
生物農薬は、植物、微生物、生化学物質などの天然素材に由来する害虫管理製品であり、これらの製品は、有益な生物への害を最小限に抑え、環境への影響を低減し、有機農業や持続可能な農業への需要の高まりに対応しながら、害虫を選択的に標的にするように設計されています。従来の化学農薬が環境や健康に与える影響に対する懸念が高まる中、農家や関係者は総合的な害虫管理戦略の一環として生物農薬を採用するケースが増えています。
世界の生物農薬市場の成長を促進する主な要因には、これらの製品に関連する生態系と健康上の利点に対する意識の高まりがあります。生物農薬は、従来の化学農薬に代わる環境に優しい農薬であり、生物多様性の保全に貢献し、食品への化学物質の残留リスクを低減します。さらに、厳しい規制や持続可能な方法で生産された食品に対する消費者の需要の高まりも、農家に生物農薬によるソリューションの採用を促しています。農業において環境に配慮した取り組みが優先される中で、世界の生物農薬市場は今後数年間、持続的な成長を示すと予測されています。
当レポートでは、世界の生物農薬の市場を調査し、市場の背景・概要、市場成長への各種影響因子の分析、特許動向、法規制環境、使用事例、市場規模の推移・予測、各種区分・地域別の詳細分析、競合情勢、主要企業の分析などをまとめています。
市場の分類
セグメンテーション1:由来別
- 植物由来
- 微生物由来
- 非有機由来
- その他
セグメンテーション2:タイプ別
- 生物殺虫剤
- 生物殺菌剤
- 生物殺線虫剤
- 生物除草剤
- その他
セグメンテーション3:作物タイプ別
- 果物・野菜
- 穀物・穀類
- 油糧種子・豆類
- その他
セグメンテーション4:製剤別
- 液体
- 乾燥
セグメンテーション5:地域別
- 北米
- 欧州
- アジア太平洋
- その他の地域
目次
エグゼクティブサマリー
範囲と定義
市場・製品の定義
主な質問への回答
分析と予測に関する注記
第1章 市場:業界の展望
- 動向:現在および将来の影響評価
- 有機食品需要の高まり
- 主要企業による微生物研究の進歩
- サプライチェーンの概要
- バリューチェーン分析
- マーケットマップ
- 価格予測
- R&Dレビュー
- 国・企業別の特許出願動向
- 規制状況
- ステークホルダーの分析
- 使用事例
- エンドユーザーと購入基準
- 主要な世界的出来事の影響:COVID-19・ロシア/ウクライナ・中東危機
- 従来型農薬と生物農薬の比較分析
- 生物農薬の最近の開発
- 市場力学の概要
- 市場促進要因
- 市場抑制要因
- 市場機会
第2章 用途
- 用途の分類
- 用途の概要
- 世界の生物農薬市場:由来別
- 植物由来
- 微生物由来
- 非有機由来
- その他
第3章 製品
- 製品の分類
- 製品概要
- 世界の生物農薬市場:タイプ別
- 生物殺虫剤
- 生物殺菌剤
- 生物殺線虫剤
- 生物除草剤
- その他
- 世界の生物農薬市場:作物タイプ別
- 果物・野菜
- 穀物・穀類
- 油糧種子・豆類
- その他
- 世界の生物農薬市場:散布方法別
- 葉面散布
- 土壌処理
- 種子処理
- その他
- 世界の生物農薬市場:製剤別
- 液体
- 乾燥
第4章 地域
- 地域概要
- 促進要因・抑制要因
- 北米
- 欧州
- アジア太平洋
- その他の地域
第5章 市場:競合情勢・企業プロファイル
- 競合情勢
- 企業プロファイル
- Andermatt Group AG
- AgriLife Private Limited
- BASF SE
- Bayer AG
- Biobest Group
- Bionema
- Biotalys NV
- FMC Corporation
- Gowan Company
- Isagro SAP
- Koppert
- Marrone Bio Innovations
- Monsanto Bioag
- Russell IPM
- Sumitomo Chemical Co., Ltd.
- その他の主要参入企業
第6章 成長機会と推奨事項
第7章 調査手法
“Global Biorational Pesticides Market Surges as Sustainable Agriculture Takes Center Stage.”
The global market for biorational pesticides is experiencing significant growth as agricultural practices shift towards sustainable and environmentally friendly solutions. Biorational pesticides are a category of pest management products derived from natural materials, such as plants, microorganisms, and biochemicals. These products are designed to target pests selectively while minimizing harm to beneficial organisms, reducing environmental impact, and meeting the increasing demand for organic and sustainable agriculture. With growing concerns about the environmental and health impacts of conventional chemical pesticides, farmers and agricultural stakeholders are increasingly adopting biorational pesticides as part of integrated pest management strategies.
Key factors driving the growth of global biorational pesticides market include a rising awareness of the ecological and health benefits associated with these products. Biorational pesticides offer an eco-friendly alternative to traditional chemical pesticides, contributing to biodiversity conservation and reducing the risk of chemical residues in food. Additionally, stringent regulations and increasing consumer demand for sustainably produced food are prompting farmers to adopt biorational solutions. As the agriculture industry continues to prioritize environmentally responsible practices, the global biorational pesticides market is expected to witness sustained growth in the coming years.
Market Segmentation:
Segmentation 1: by Source
- Botanical
- Microbials
- Non-Organic
- Others
Segmentation 2: by Type
- Biorational Insecticides
- Biorational Fungicides
- Biorational Nematicides
- Biorational Herbicides
- Others
Segmentation 3: by Crop Type
- Fruits and Vegetables
- Cereals and Grains
- Oil Seeds and Pulses
- Others
Segmentation 4: by Formulation
- Liquid
- Dry
Segmentation 5: by Region
- North America
- Europe
- Asia-Pacific
- Rest-of-the-World
Key Questions Answered:
- What are the main factors driving the demand for global biorational pesticides market?
- What are the major patents filed by the companies active in the global biorational pesticides market?
- What are the strategies adopted by the key companies to gain a competitive edge in biorational pesticides industry?
- What is the futuristic outlook for the biorational pesticides industry in terms of growth potential?
- Which application, and product segment is expected to lead the market over the forecast period (2023-2033)?
- Which region and country is expected to lead the market over the forecast period (2023-2033)?
Table of Contents
Executive Summary
Scope and Definition
Market/Product Definition
Key Questions Answered
Analysis and Forecast Note
1. Markets: Industry Outlook
- 1.1. Trends: Current and Future Impact Assessment
- 1.1.1. Rising Demand of Organic Food Products
- 1.1.2. Advancements in Microbial Research by Key Players Across Regions
- 1.2. Supply Chain Overview
- 1.2.1. Value chain Analysis
- 1.2.2. Market Map
- 1.2.3. Pricing Forecast
- 1.3. R&D Review
- 1.3.1. Patent Filing Trend by Country, by Company
- 1.4. Regulatory Landscape
- 1.5. Stakeholder Analysis
- 1.5.1. Use case
- 1.5.2. End User and buying criteria
- 1.6. Impact analysis for Key Global Events-covid19, Russia/Ukraine or Middle East crisis
- 1.7. Comparative Analysis Between Conventional and Biorational Pesticides
- 1.8. Recent Developments Made in Biorational Pesticides
- 1.9. Market Dynamics Overview
- 1.9.1. Market Drivers
- 1.9.2. Market Restraints
- 1.9.3. Market Opportunities
2. Application
- 2.1. Application Segmentation
- 2.2. Application Summary
- 2.3. Global Biorational Pesticides Market - by Source
- 2.3.1. Botanical
- 2.3.2. Microbials
- 2.3.3. Non-Organic
- 2.3.4. Others
3. Product
- 3.1. Product Segmentation
- 3.2. Product Summary
- 3.3. Global Biorational Pesticides Market - by Type
- 3.3.1. Biorational Insecticides
- 3.3.2. Biorational Fungicides
- 3.3.3. Biorational Nematicides
- 3.3.4. Biorational Herbicides
- 3.3.5. Others
- 3.4. Global Biorational Pesticides Market - by Crop Type
- 3.4.1. Fruits and Vegetables
- 3.4.2. Cereals and Grains
- 3.4.3. Oil Seeds and Pulses
- 3.4.4. Others
- 3.5. Global Biorational Pesticides Market - by Application Method
- 3.5.1. Foliar Spray
- 3.5.2. Soil Treatment
- 3.5.3. Seed Treatment
- 3.5.4. Others
- 3.6. Global Biorational Pesticides Market - by Formulation
- 3.6.1. Liquid
- 3.6.2. Dry
4. Region
- 4.1. Regional Summary
Table: Global Biorational Pesticides Market, By Region, (Tons), 2022-2033
Table: Global Biorational Pesticides Market, By Region, ($ Million), 2022-2033
- 4.2. Drivers and Restraints
- 4.3. North America
- 4.3.1. Key Market Participants in North America
- 4.3.2. Business Drivers
- 4.3.3. Business Challenges
- 4.3.4. Application
Table: North America Biorational Pesticides Market, By Source (Tons), 2022-2033
Table: North America Biorational Pesticides Market, By Source ($ Million), 2022-2033
- 4.3.5. Product
Table: North America Biorational Pesticides Market, By Type (Tons), 2022-2033
Table: North America Biorational Pesticides Market, By Type ($ Million), 2022-2033
Table: North America Biorational Pesticides Market, By Crop Type (Tons), 2022-2033
Table: North America Biorational Pesticides Market, By Crop Type ($ Million), 2022-2033
Table: North America Biorational Pesticides Market, By Application Method (Tons), 2022-2033
Table: North America Biorational Pesticides Market, By Application Method ($ Million), 2022-2033
Table: North America Biorational Pesticides Market, By Formulation (Tons), 2022-2033
Table: North America Biorational Pesticides Market, By Formulation ($ Million), 2022-2033
- 4.3.6. North America Biorational Pesticides Market (by Country)
- 4.3.6.1. U.S.
Table: U.S. Biorational Pesticides Market, By Source (Tons), 2022-2033
Table: U.S. Biorational Pesticides Market, By Source ($ Million), 2022-2033
Table: U.S. Biorational Pesticides Market, By Type (Tons), 2022-2033
Table: U.S. Biorational Pesticides Market, By Type ($ Million), 2022-2033
Table: U.S. Biorational Pesticides Market, By Crop Type (Tons), 2022-2033
Table: U.S. Biorational Pesticides Market, By Crop Type ($ Million), 2022-2033
Table: U.S. Biorational Pesticides Market, By Application Method (Tons), 2022-2033
Table: U.S. Biorational Pesticides Market, By Application Method ($ Million), 2022-2033
Table: U.S. Biorational Pesticides Market, By Formulation (Tons), 2022-2033
Table: U.S. Biorational Pesticides Market, By Formulation ($ Million), 2022-2033
- 4.3.6.2. Canada
Table: Canada Biorational Pesticides Market, By Source (Tons), 2022-2033
Table: Canada Biorational Pesticides Market, By Source ($ Million), 2022-2033
Table: Canada Biorational Pesticides Market, By Type (Tons), 2022-2033
Table: Canada Biorational Pesticides Market, By Type ($ Million), 2022-2033
Table: Canada Biorational Pesticides Market, By Crop Type (Tons), 2022-2033
Table: Canada Biorational Pesticides Market, By Crop Type ($ Million), 2022-2033
Table: Canada Biorational Pesticides Market, By Application Method (Tons), 2022-2033
Table: Canada Biorational Pesticides Market, By Application Method ($ Million), 2022-2033
Table: Canada Biorational Pesticides Market, By Formulation (Tons), 2022-2033
Table: Canada Biorational Pesticides Market, By Formulation ($ Million), 2022-2033
- 4.3.6.3. Mexico
Table: Mexico Biorational Pesticides Market, By Source (Tons), 2022-2033
Table: Mexico Biorational Pesticides Market, By Source ($ Million), 2022-2033
Table: Mexico Biorational Pesticides Market, By Type (Tons), 2022-2033
Table: Mexico Biorational Pesticides Market, By Type ($ Million), 2022-2033
Table: mexico Biorational Pesticides Market, By Crop Type (Tons), 2022-2033
Table: mexico Biorational Pesticides Market, By Crop Type ($ Million), 2022-2033
Table: mexico Biorational Pesticides Market, By Application Method (Tons), 2022-2033
Table: mexico Biorational Pesticides Market, By Application Method ($ Million), 2022-2033
Table: mexico Biorational Pesticides Market, By Formulation (Tons), 2022-2033
Table: mexico Biorational Pesticides Market, By Formulation ($ Million), 2022-2033
- 4.4. Europe
- 4.4.1. Key Market Participants in Europe
- 4.4.2. Business Drivers
- 4.4.3. Business Challenges
- 4.4.4. Application
Table: Europe Biorational Pesticides Market, By Source (Tons), 2022-2033
Table: Europe Biorational Pesticides Market, By Source ($ Million), 2022-2033
- 4.4.5. Product
Table: Europe Biorational Pesticides Market, By Type (Tons), 2022-2033
Table: Europe Biorational Pesticides Market, By Type ($ Million), 2022-2033
Table: Europe Biorational Pesticides Market, By Crop Type (Tons), 2022-2033
Table: Europe Biorational Pesticides Market, By Crop Type ($ Million), 2022-2033
Table: Europe Biorational Pesticides Market, By Application Method (Tons), 2022-2033
Table: Europe Biorational Pesticides Market, By Application Method ($ Million), 2022-2033
Table: Europe Biorational Pesticides Market, By Formulation (Tons), 2022-2033
Table: Europe Biorational Pesticides Market, By Formulation ($ Million), 2022-2033
- 4.4.6. Europe Biorational Pesticides Market (by Country)
- 4.4.6.1. Germany
Table: Germany Biorational Pesticides Market, By Source (Tons), 2022-2033
Table: Germany Biorational Pesticides Market, By Source ($ Million), 2022-2033
Table: Germany Biorational Pesticides Market, By Type (Tons), 2022-2033
Table: Germany Biorational Pesticides Market, By Type ($ Million), 2022-2033
Table: Germany Biorational Pesticides Market, By Crop Type (Tons), 2022-2033
Table: Germany Biorational Pesticides Market, By Crop Type ($ Million), 2022-2033
Table: Germany Biorational Pesticides Market, By Application Method (Tons), 2022-2033
Table: Germany Biorational Pesticides Market, By Application Method ($ Million), 2022-2033
Table: Germany Biorational Pesticides Market, By Formulation (Tons), 2022-2033
Table: Germany Biorational Pesticides Market, By Formulation ($ Million), 2022-2033
- 4.4.6.2. France
Table: France Biorational Pesticides Market, By Source (Tons), 2022-2033
Table: France Biorational Pesticides Market, By Source ($ Million), 2022-2033
Table: France Biorational Pesticides Market, By Type (Tons), 2022-2033
Table: France Biorational Pesticides Market, By Type ($ Million), 2022-2033
Table: France Biorational Pesticides Market, By Crop Type (Tons), 2022-2033
Table: France Biorational Pesticides Market, By Crop Type ($ Million), 2022-2033
Table: France Biorational Pesticides Market, By Application Method (Tons), 2022-2033
Table: France Biorational Pesticides Market, By Application Method ($ Million), 2022-2033
Table: France Biorational Pesticides Market, By Formulation (Tons), 2022-2033
Table: France Biorational Pesticides Market, By Formulation ($ Million), 2022-2033
- 4.4.6.3. Italy
Table: Italy Biorational Pesticides Market, By Source (Tons), 2022-2033
Table: Italy Biorational Pesticides Market, By Source ($ Million), 2022-2033
Table: Italy Biorational Pesticides Market, By Type (Tons), 2022-2033
Table: Italy Biorational Pesticides Market, By Type ($ Million), 2022-2033
Table: Italy Biorational Pesticides Market, By Crop Type (Tons), 2022-2033
Table: Italy Biorational Pesticides Market, By Crop Type ($ Million), 2022-2033
Table: Italy Biorational Pesticides Market, By Application Method (Tons), 2022-2033
Table: Italy Biorational Pesticides Market, By Application Method ($ Million), 2022-2033
Table: Italy Biorational Pesticides Market, By Formulation (Tons), 2022-2033
Table: Italy Biorational Pesticides Market, By Formulation ($ Million), 2022-2033
- 4.4.6.4. Spain
Table: Spain Biorational Pesticides Market, By Source (Tons), 2022-2033
Table: Spain Biorational Pesticides Market, By Source ($ Million), 2022-2033
Table: Spain Biorational Pesticides Market, By Type (Tons), 2022-2033
Table: Spain Biorational Pesticides Market, By Type ($ Million), 2022-2033
Table: Spain Biorational Pesticides Market, By Crop Type (Tons), 2022-2033
Table: Spain Biorational Pesticides Market, By Crop Type ($ Million), 2022-2033
Table: Spain Biorational Pesticides Market, By Application Method (Tons), 2022-2033
Table: Spain Biorational Pesticides Market, By Application Method ($ Million), 2022-2033
Table: Spain Biorational Pesticides Market, By Formulation (Tons), 2022-2033
Table: Spain Biorational Pesticides Market, By Formulation ($ Million), 2022-2033
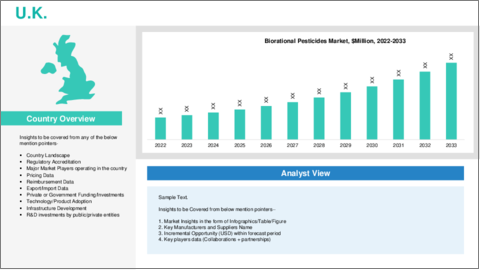
- 4.4.6.5. U.K.
Table: U.K. Biorational Pesticides Market, By Source (Tons), 2022-2033
Table: U.K. Biorational Pesticides Market, By Source ($ Million), 2022-2033
Table: U.K. Biorational Pesticides Market, By Type (Tons), 2022-2033
Table: U.K. Biorational Pesticides Market, By Type ($ Million), 2022-2033
Table: U.K. Biorational Pesticides Market, By Crop Type (Tons), 2022-2033
Table: U.K. Biorational Pesticides Market, By Crop Type ($ Million), 2022-2033
Table: U.K. Biorational Pesticides Market, By Application Method (Tons), 2022-2033
Table: U.K. Biorational Pesticides Market, By Application Method ($ Million), 2022-2033
Table: U.K. Biorational Pesticides Market, By Formulation (Tons), 2022-2033
Table: U.K. Biorational Pesticides Market, By Formulation ($ Million), 2022-2033
- 4.4.6.6. Rest-of-Europe
Table: Rest-of-Europe Biorational Pesticides Market, By Source (Tons), 2022-2033
Table: Rest-of-Europe Biorational Pesticides Market, By Source ($ Million), 2022-2033
Table: Rest-of-Europe Biorational Pesticides Market, By Type (Tons), 2022-2033
Table: Rest-of-Europe Biorational Pesticides Market, By Type ($ Million), 2022-2033
Table: Rest-of-Europe Biorational Pesticides Market, By Crop Type (Tons), 2022-2033
Table: Rest-of-Europe Biorational Pesticides Market, By Crop Type ($ Million), 2022-2033
Table: Rest-of-Europe Biorational Pesticides Market, By Application Method (Tons), 2022-2033
Table: Rest-of-Europe Biorational Pesticides Market, By Application Method ($ Million), 2022-2033
Table: Rest-of-Europe Biorational Pesticides Market, By Formulation (Tons), 2022-2033
Table: Rest-of-Europe Biorational Pesticides Market, By Formulation ($ Million), 2022-2033
- 4.5. Asia-Pacific
- 4.5.1. Key Market Participants in Asia-Pacific
- 4.5.2. Business Drivers
- 4.5.3. Business Challenges
- 4.5.4. Application
Table: Asia-Pacific Biorational Pesticides Market, By Source (Tons), 2022-2033
Table: Asia-Pacific Biorational Pesticides Market, By Source ($ Million), 2022-2033
- 4.5.5. Product
Table: Asia-Pacific Biorational Pesticides Market, By Type (Tons), 2022-2033
Table: Asia-Pacific Biorational Pesticides Market, By Type ($ Million), 2022-2033
Table: Asia-Pacific Biorational Pesticides Market, By Crop Type (Tons), 2022-2033
Table: Asia-Pacific Biorational Pesticides Market, By Crop Type ($ Million), 2022-2033
Table: Asia-Pacific Biorational Pesticides Market, By Application Method (Tons), 2022-2033
Table: Asia-Pacific Biorational Pesticides Market, By Application Method ($ Million), 2022-2033
Table: Asia-Pacific Biorational Pesticides Market, By Formulation (Tons), 2022-2033
Table: Asia-Pacific Biorational Pesticides Market, By Formulation ($ Million), 2022-2033
- 4.5.6. Asia-Pacific Biorational Pesticides Market (by Country)
- 4.5.6.1. China
Table: China Biorational Pesticides Market, By Source (Tons), 2022-2033
Table: China Biorational Pesticides Market, By Source ($ Million), 2022-2033
Table: China Biorational Pesticides Market, By Type (Tons), 2022-2033
Table: China Biorational Pesticides Market, By Type ($ Million), 2022-2033
Table: China Biorational Pesticides Market, By Crop Type (Tons), 2022-2033
Table: China Biorational Pesticides Market, By Crop Type ($ Million), 2022-2033
Table: China Biorational Pesticides Market, By Application Method (Tons), 2022-2033
Table: China Biorational Pesticides Market, By Application Method ($ Million), 2022-2033
Table: China Biorational Pesticides Market, By Formulation (Tons), 2022-2033
Table: China Biorational Pesticides Market, By Formulation ($ Million), 2022-2033
- 4.5.6.2. Japan
Table: Japan Biorational Pesticides Market, By Source (Tons), 2022-2033
Table: Japan Biorational Pesticides Market, By Source ($ Million), 2022-2033
Table: Japan Biorational Pesticides Market, By Type (Tons), 2022-2033
Table: Japan Biorational Pesticides Market, By Type ($ Million), 2022-2033
Table: Japan Biorational Pesticides Market, By Crop Type (Tons), 2022-2033
Table: Japan Biorational Pesticides Market, By Crop Type ($ Million), 2022-2033
Table: Japan Biorational Pesticides Market, By Application Method (Tons), 2022-2033
Table: Japan Biorational Pesticides Market, By Application Method ($ Million), 2022-2033
Table: Japan Biorational Pesticides Market, By Formulation (Tons), 2022-2033
Table: Japan Biorational Pesticides Market, By Formulation ($ Million), 2022-2033
- 4.5.6.3. India
Table: India Biorational Pesticides Market, By Source (Tons), 2022-2033
Table: India Biorational Pesticides Market, By Source ($ Million), 2022-2033
Table: India Biorational Pesticides Market, By Type (Tons), 2022-2033
Table: India Biorational Pesticides Market, By Type ($ Million), 2022-2033
Table: India Biorational Pesticides Market, By Crop Type (Tons), 2022-2033
Table: India Biorational Pesticides Market, By Crop Type ($ Million), 2022-2033
Table: India Biorational Pesticides Market, By Application Method (Tons), 2022-2033
Table: India Biorational Pesticides Market, By Application Method ($ Million), 2022-2033
Table: India Biorational Pesticides Market, By Formulation (Tons), 2022-2033
Table: India Biorational Pesticides Market, By Formulation ($ Million), 2022-2033
- 4.5.6.3. South Korea
Table: South Korea Biorational Pesticides Market, By Source (Tons), 2022-2033
Table: South Korea Biorational Pesticides Market, By Source ($ Million), 2022-2033
Table: South Korea Biorational Pesticides Market, By Type (Tons), 2022-2033
Table: South Korea Biorational Pesticides Market, By Type ($ Million), 2022-2033
Table: South Korea Biorational Pesticides Market, By Crop Type (Tons), 2022-2033
Table: South Korea Biorational Pesticides Market, By Crop Type ($ Million), 2022-2033
Table: South Korea Biorational Pesticides Market, By Application Method (Tons), 2022-2033
Table: South Korea Biorational Pesticides Market, By Application Method ($ Million), 2022-2033
Table: South Korea Biorational Pesticides Market, By Formulation (Tons), 2022-2033
Table: South Korea Biorational Pesticides Market, By Formulation ($ Million), 2022-2033
- 4.5.6.4. Rest-of-Asia-Pacific
Table: Rest-of-Asia-Pacific Biorational Pesticides Market, By Source (Tons), 2022-2033
Table: Rest-of-Asia-Pacific Biorational Pesticides Market, By Source ($ Million), 2022-2033
Table: Rest-of-Asia-Pacific Biorational Pesticides Market, By Type (Tons), 2022-2033
Table: Rest-of-Asia-Pacific Biorational Pesticides Market, By Type ($ Million), 2022-2033
Table: Rest-of-Asia-Pacific Biorational Pesticides Market, By Crop Type (Tons), 2022-2033
Table: Rest-of-Asia-Pacific Biorational Pesticides Market, By Crop Type ($ Million), 2022-2033
Table: Rest-of-Asia-Pacific Biorational Pesticides Market, By Application Method (Tons), 2022-2033
Table: Rest-of-Asia-Pacific Biorational Pesticides Market, By Application Method ($ Million), 2022-2033
Table: Rest-of-Asia-Pacific Biorational Pesticides Market, By Formulation (Tons), 2022-2033
Table: Rest-of-Asia-Pacific Biorational Pesticides Market, By Formulation ($ Million), 2022-2033
- 4.6. Rest-of-the-World
- 4.6.1. Key Market Participants in Rest-of-the-World
- 4.6.2. Business Drivers
- 4.6.3. Business Challenges
- 4.6.4. Application
Table: Rest-of-the-World Biorational Pesticides Market, By Source (Tons), 2022-2033
Table: Rest-of-the-World Biorational Pesticides Market, By Source ($ Million), 2022-2033
- 4.6.5. Product
Table: Rest-of-the-World Biorational Pesticides Market, By Type (Tons), 2022-2033
Table: Rest-of-the-World Biorational Pesticides Market, By Type ($ Million), 2022-2033
Table: Rest-of-the-World Biorational Pesticides Market, By Crop Type (Tons), 2022-2033
Table: Rest-of-the-World Biorational Pesticides Market, By Crop Type ($ Million), 2022-2033
Table: Rest-of-the-World Biorational Pesticides Market, By Application Method (Tons), 2022-2033
Table: Rest-of-the-World Biorational Pesticides Market, By Application Method ($ Million), 2022-2033
Table: Rest-of-the-World Biorational Pesticides Market, By Formulation (Tons), 2022-2033
Table: Rest-of-the-World Biorational Pesticides Market, By Formulation ($ Million), 2022-2033
- 4.6.6. Rest-of-the-World Biorational Pesticides Market (By Region)
- 4.6.6.1. The Middle East and Africa
Table: The Middle East and Africa Biorational Pesticides Market, By Source (Tons), 2022-2033
Table: The Middle East and Africa Biorational Pesticides Market, By Source ($ Million), 2022-2033
Table: The Middle East and Africa Biorational Pesticides Market, By Type (Tons), 2022-2033
Table: The Middle East and Africa Biorational Pesticides Market, By Type ($ Million), 2022-2033
Table: The Middle East and Africa Biorational Pesticides Market, By Crop Type (Tons), 2022-2033
Table: The Middle East and Africa Biorational Pesticides Market, By Crop Type ($ Million), 2022-2033
Table: The Middle East and Africa Biorational Pesticides Market, By Application Method (Tons), 2022-2033
Table: The Middle East and Africa Biorational Pesticides Market, By Application Method ($ Million), 2022-2033
Table: The Middle East and Africa Biorational Pesticides Market, By Formulation (Tons), 2022-2033
Table: The Middle East and Africa Biorational Pesticides Market, By Formulation ($ Million), 2022-2033
- 4.6.6.2. South America
Table: South America Biorational Pesticides Market, By Source (Tons), 2022-2033
Table: South America Biorational Pesticides Market, By Source ($ Million), 2022-2033
Table: South America Biorational Pesticides Market, By Type (Tons), 2022-2033
Table: South America Biorational Pesticides Market, By Type ($ Million), 2022-2033
Table: South America Biorational Pesticides Market, By Crop Type (Tons), 2022-2033
Table: South America Biorational Pesticides Market, By Crop Type ($ Million), 2022-2033
Table: South America Biorational Pesticides Market, By Application Method (Tons), 2022-2033
Table: South America Biorational Pesticides Market, By Application Method ($ Million), 2022-2033
Table: South America Biorational Pesticides Market, By Formulation (Tons), 2022-2033
Table: South America Biorational Pesticides Market, By Formulation ($ Million), 2022-2033
5. Markets - Competitive Landscape & Company Profiles
- 5.1. Competitive Landscape
- 5.2. Company Profiles
- 5.2.1. Andermatt Group AG
- 5.2.1.1. Overview
- 5.2.1.2. Top Products / Product Portfolio
- 5.2.1.3. Top Competitors
- 5.2.1.4. Target Customers/End-Users
- 5.2.1.5. Key Personnel
- 5.2.1.6. Analyst View
- 5.2.1.7. Market Share
- 5.2.2. AgriLife Private Limited
- 5.2.2.1. Overview
- 5.2.2.2. Top Products / Product Portfolio
- 5.2.2.3. Top Competitors
- 5.2.2.4. Target Customers/End-Users
- 5.2.2.5. Key Personnel
- 5.2.2.6. Analyst View
- 5.2.2.7. Market Share
- 5.2.3. BASF SE
- 5.2.3.1. Overview
- 5.2.3.2. Top Products / Product Portfolio
- 5.2.3.3. Top Competitors
- 5.2.3.4. Target Customers/End-Users
- 5.2.3.5. Key Personnel
- 5.2.3.6. Analyst View
- 5.2.3.7. Market Share
- 5.2.4. Bayer AG
- 5.2.4.1. Overview
- 5.2.4.2. Top Products / Product Portfolio
- 5.2.4.3. Top Competitors
- 5.2.4.4. Target Customers/End-Users
- 5.2.4.5. Key Personnel
- 5.2.4.6. Analyst View
- 5.2.4.7. Market Share
- 5.2.5. Biobest Group
- 5.2.5.1. Overview
- 5.2.5.2. Top Products / Product Portfolio
- 5.2.5.3. Top Competitors
- 5.2.5.4. Target Customers/End-Users
- 5.2.5.5. Key Personnel
- 5.2.5.6. Analyst View
- 5.2.5.7. Market Share
- 5.2.6. Bionema
- 5.2.6.1. Overview
- 5.2.6.2. Top Products / Product Portfolio
- 5.2.6.3. Top Competitors
- 5.2.6.4. Target Customers/End-Users
- 5.2.6.5. Key Personnel
- 5.2.6.6. Analyst View
- 5.2.6.7. Market Share
- 5.2.7. Biotalys NV
- 5.2.7.1. Overview
- 5.2.7.2. Top Products / Product Portfolio
- 5.2.7.3. Top Competitors
- 5.2.7.4. Target Customers/End-Users
- 5.2.7.5. Key Personnel
- 5.2.7.6. Analyst View
- 5.2.7.7. Market Share
- 5.2.8. FMC Corporation
- 5.2.8.1. Overview
- 5.2.8.2. Top Products / Product Portfolio
- 5.2.8.3. Top Competitors
- 5.2.8.4. Target Customers/End-Users
- 5.2.8.5. Key Personnel
- 5.2.8.6. Analyst View
- 5.2.8.7. Market Share
- 5.2.9. Gowan Company
- 5.2.9.1. Overview
- 5.2.9.2. Top Products / Product Portfolio
- 5.2.9.3. Top Competitors
- 5.2.9.4. Target Customers/End-Users
- 5.2.9.5. Key Personnel
- 5.2.9.6. Analyst View
- 5.2.9.7. Market Share
- 5.2.10. Isagro SAP
- 5.2.10.1. Overview
- 5.2.10.2. Top Products / Product Portfolio
- 5.2.10.3. Top Competitors
- 5.2.10.4. Target Customers/End-Users
- 5.2.10.5. Key Personnel
- 5.2.10.6. Analyst View
- 5.2.10.7. Market Share
- 5.2.11. Koppert
- 5.2.11.1. Overview
- 5.2.11.2. Top Products / Product Portfolio
- 5.2.11.3. Top Competitors
- 5.2.11.4. Target Customers/End-Users
- 5.2.11.5. Key Personnel
- 5.2.11.6. Analyst View
- 5.2.11.7. Market Share
- 5.2.12. Marrone Bio Innovations
- 5.2.12.1. Overview
- 5.2.12.2. Top Products / Product Portfolio
- 5.2.12.3. Top Competitors
- 5.2.12.4. Target Customers/End-Users
- 5.2.12.5. Key Personnel
- 5.2.12.6. Analyst View
- 5.2.12.7. Market Share
- 5.2.13. Monsanto Bioag
- 5.2.13.1. Overview
- 5.2.13.2. Top Products / Product Portfolio
- 5.2.13.3. Top Competitors
- 5.2.13.4. Target Customers/End-Users
- 5.2.13.5. Key Personnel
- 5.2.13.6. Analyst View
- 5.2.13.7. Market Share
- 5.2.14. Russell IPM
- 5.2.14.1. Overview
- 5.2.14.2. Top Products / Product Portfolio
- 5.2.14.3. Top Competitors
- 5.2.14.4. Target Customers/End-Users
- 5.2.14.5. Key Personnel
- 5.2.14.6. Analyst View
- 5.2.14.7. Market Share
- 5.2.15. Sumitomo Chemical Co., Ltd.
- 5.2.15.1. Overview
- 5.2.15.2. Top Products / Product Portfolio
- 5.2.15.3. Top Competitors
- 5.2.15.4. Target Customers/End-Users
- 5.2.15.5. Key Personnel
- 5.2.15.6. Analyst View
- 5.2.15.7. Market Share
- 5.2.1. Andermatt Group AG
- 5.3. Other Key Market Participants
