|
|
市場調査レポート
商品コード
1396603
欧州のPEM電解槽市場の分析・予測:2022-2031年Europe PEM Electrolyzer Market - Analysis and Forecast, 2022-2031 |
||||||
|
|
|||||||
カスタマイズ可能
|
|||||||

| 欧州のPEM電解槽市場の分析・予測:2022-2031年 |
|
出版日: 2023年12月15日
発行: BIS Research
ページ情報: 英文 139 Pages
納期: 1~5営業日
|

全表示
- 概要
- 図表
- 目次
欧州のPEM電解槽の市場規模は、2022年の6,780万米ドルから、予測期間中は36.5%のCAGRで推移し、2031年には11億1,790万米ドルの規模に成長すると予測されています。
PEM電解槽のニーズは、アンモニア生産、輸送、電力・エネルギー貯蔵、メタノールなど、さまざまなエンドユーザー産業からの需要の増加の結果、欧州地域で急増すると予想されています。PEM電解槽を使用したグリーン水素の生成は、官民による再生可能エネルギー源への大規模な支出に後押しされ、大幅に増加すると予測されています。しかし、輸送や貯蔵施設といった水素関連インフラが存在しないため、同地域における成長は抑制される可能性があります。
| 主要市場統計 | |
|---|---|
| 予測期間 | 2022-2031年 |
| 2022年評価 | 6,780万米ドル |
| 2031年予測 | 11億1,790万米ドル |
| CAGR | 36.5% |
燃料電池自動車の普及と、脱炭素化と温室効果ガス排出量削減への注力の拡大が、同市場の成長予測の主な理由です。温室効果ガスの排出削減を目的とした政府規制の強化や、さまざまなエンドユーザー産業からの需要の急増が、環境に優しい燃料へのニーズの高まりに寄与すると予想されています。
当レポートでは、欧州のPEM電解槽の市場を調査し、市場の背景・概要、市場成長への各種影響因子の分析、市場規模の推移・予測、各種区分・主要国別の詳細分析、競合情勢、主要企業の分析などをまとめています。
市場セグメンテーション:
セグメンテーション1:エンドユーザー別
- 精製産業
- 電力・エネルギー貯蔵
- アンモニア製造
- メタノール製造
- 輸送
- その他
セグメンテーション2:材料タイプ別
- イリジウム
- プラチナ
- その他
セグメンテーション別3:国別
- ドイツ
- オランダ
- スペイン
- フランス
- その他
目次
エグゼクティブサマリー
調査範囲
第1章 市場
- 業界の展望
- 動向:現在と未来
- サプライチェーン分析
- エコシステム/進行中のプログラム
- COVID-19がPEM電解槽市場に与える影響
- ロシアとウクライナの紛争がPEM電解槽市場に与える影響
- イリジウムの需給ギャップがPEM電解槽市場に与える影響
- 世界のイリジウムの需給ギャップ
- PEM電解槽市場シナリオ
- イリジウムの需給ギャップ緩和に向けPEM電解槽主要10社が講じた重要な措置:詳細分析
- 事業力学
- 事業促進要因
- 事業上の課題
- 事業戦略
- 経営戦略
- 事業チャンス
- スタートアップ/新興製造業者の情勢
第2章 地域
- 欧州
- 市場
- 用途
- 製品
- 欧州(国別)
- 英国
- 市場
- 用途
- 製品
第3章 市場:競合ベンチマーキング・企業プロファイル
- 競合ベンチマーキング
- 競合マトリックス
- 主要企業の製品マトリックス
- 主要企業の市場シェア分析
- 企業プロファイル
- Siemens Energy AG
- Hystar
- Nel ASA
- ITM Power PLC
- H-TEC SYSTEMS GmbH
- H2GREEM S.L.
- Oort Energy Ltd.
- iGas energy GmbH
- IMI Critical Engineering
第4章 調査手法
List of Figures
- Figure 1: PEM Electrolyzer Market, $Million, 2021, 2022, and 2031
- Figure 2: PEM Electrolyzer Market (by End User), $Million, 2021 and 2031
- Figure 3: PEM Electrolyzer Market (by Material Type), $Million, 2021 and 2031
- Figure 4: PEM Electrolyzer Market (by Region), $Million, 2021 and 2031
- Figure 5: Technological Possibilities for Green Hydrogen Production Under $1.5/kg by 2050
- Figure 6: Anticipated Capacity for Producing Electrolyzers (by region), 2021-2031
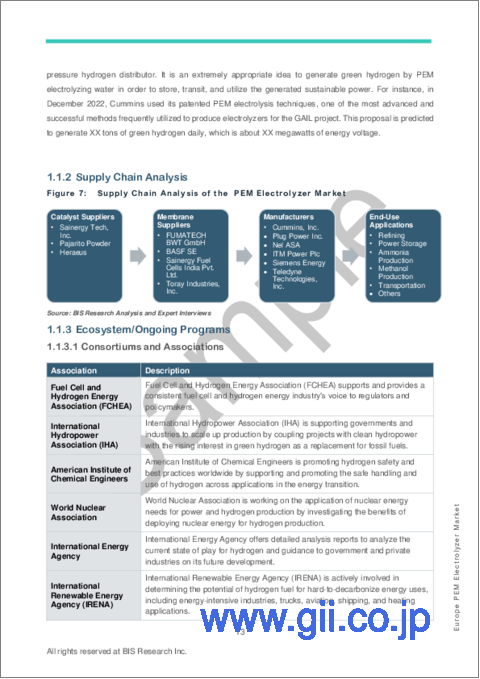
- Figure 7: Supply Chain Analysis of the PEM Electrolyzer Market
- Figure 8: Global Iridium Market Supply and Demand, Tons, 2021-2031
- Figure 9: PEM Electrolyzer Market Volume based on Historical, Optimistic, and Realistic Scenario, MW, 2021-2031
- Figure 10: Number of Fuel Cell Vehicles and Hydrogen Refuelling Stations Worldwide, 2021
- Figure 11: Distribution of Fuel Cell Electric Vehicle Stock (by Region and Mode), 2021
- Figure 12: Distribution of All Fuel Cell Vehicles on Roads as of the End of 2020 (by Country)
- Figure 13: Distribution of Different Fuel Cell Vehicle Types Worldwide as of the End of 2020
- Figure 14: Research Methodology
- Figure 15: Top-Down and Bottom-Up Approach
- Figure 16: PEM Electrolyzer Market Influencing Factors
- Figure 17: Assumptions and Limitations
List of Tables
- Table 1: List of Green Hydrogen Programs by Major Countries
- Table 2: Comparison Table of Various Fuel Sources
- Table 3: Iridium Usage based on Application.
- Table 4: U.K. Import and Export Data
- Table 5: List of Players Involved in Iridium Manufacturing and Distribution
- Table 6: List of Key Players Involved in the Manufacturing of PEM Electrolyzer Systems
- Table 7: Required Activities to Enhance the Efficiency of PEM Electrolyzers
- Table 8: Iridium, Osmium, and Ruthenium: Import Analysis by Key Countries, $Thousand, 2017-2021
- Table 9: Iridium, Osmium, and Ruthenium: Export Analysis by Key Countries, $Thousand, 2017-2021
- Table 10: PEM Electrolyzer Market Volume based on Historical, Optimistic, and Realistic Scenario, MW, 2021-2031
- Table 11: Key Market Developments
- Table 12: Key Partnerships, Collaborations, and Joint Ventures
- Table 13: Key Start-Ups in PEM Electrolyzer Market
- Table 14: Product Offerings by Key Start-Ups in PEM Electrolyzer Market
- Table 15: Europe PEM Electrolyzer Market (by End User), MW, 2021-2031
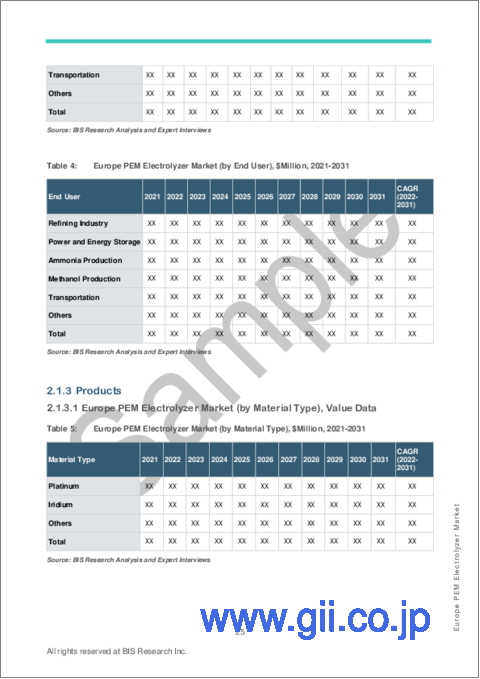
- Table 16: Europe PEM Electrolyzer Market (by End User), $Million, 2021-2031
- Table 17: Europe PEM Electrolyzer Market (by Material Type), $Million, 2021-2031
- Table 18: Germany PEM Electrolyzer Market (by End User), MW, 2021-2031
- Table 19: Germany PEM Electrolyzer Market (by End User), $Million, 2021-2031
- Table 20: Germany PEM Electrolyzer Market (by Material Type), $Million, 2021-2031
- Table 21: France PEM Electrolyzer Market (by End User), MW, 2021-2031
- Table 22: France PEM Electrolyzer Market (by End User), $Million, 2021-2031
- Table 23: France PEM Electrolyzer Market (by Material Type), $Million, 2021-2031
- Table 24: Netherlands PEM Electrolyzer Market (by End User), MW, 2021-2031
- Table 25: Netherlands PEM Electrolyzer Market (by End User), $Million, 2021-2031
- Table 26: Netherlands PEM Electrolyzer Market (by Material Type), $Million, 2021-2031
- Table 27: Spain PEM Electrolyzer Market (by End User), MW, 2021-2031
- Table 28: Spain PEM Electrolyzer Market (by End User), $Million, 2021-2031
- Table 29: Spain PEM Electrolyzer Market (by Material Type), $Million, 2021-2031
- Table 30: Rest-of-Europe PEM Electrolyzer Market (by End User), MW, 2021-2031
- Table 31: Rest-of-Europe PEM Electrolyzer Market (by End User), $Million, 2021-2031
- Table 32: Rest-of-Europe PEM Electrolyzer Market (by Material Type), $Million, 2021-2031
- Table 33: U.K. PEM Electrolyzer Market (by End User), MW, 2021-2031
- Table 34: U.K. PEM Electrolyzer Market (by End User), $Million, 2021-2031
- Table 35: U.K. PEM Electrolyzer Market (by Material Type), $Million, 2021-2031
- Table 36: Product Matrix for Key Companies
- Table 37: Market Share of Key Companies
“The Europe PEM Electrolyzer Market (excluding U.K.) Expected to Reach $1,117.9 Million by 2031.”
Introduction to Europe PEM Electrolyzer Market
The Europe PEM electrolyzer market is projected to reach $1,117.9 million by 2031 from $67.8 million in 2022, growing at a CAGR of 36.5% during the forecast period 2022-2031. The need for PEM electrolyzers is anticipated to surge in the European region as a result of rising demands from a range of end-use industries, including the production of ammonia, transportation, electricity and energy storage, and methanol. It is projected that the generation of green hydrogen using PEM electrolyzers would rise significantly, bolstered by large expenditures in renewable energy sources from the public and private sectors. The absence of hydrogen-related infrastructure, such as transportation and storage facilities, could, nevertheless, soon impede the growth of the PEM electrolyzer business in the area.
| KEY MARKET STATISTICS | |
|---|---|
| Forecast Period | 2022 - 2031 |
| 2022 Evaluation | $67.8 Million |
| 2031 Forecast | $1,117.9 Million |
| CAGR | 36.5% |
Market Introduction
The Europe market is seeing a rise in the sales of proton exchange membrane (PEM) electrolyzers as a result of several significant causes. Fuel cell vehicle popularity and the growing emphasis on decarbonization and reducing greenhouse gas emissions are the main reasons behind the market's predicted growth. Stronger government regulations aimed at lowering greenhouse gas emissions and a surge in demand from a range of end-user industries are expected to contribute to the growing need for environmentally friendly fuels. The global PEM electrolyzer market, which is also anticipated to benefit from it, is predicted to rise at a faster rate due to the growing need for green hydrogen. Fuel cell electric vehicles are making PEM electrolyzers more and more essential.
Market Segmentation:
Segmentation 1: by End User
- Refining Industry
- Power and Energy Storage
- Ammonia Production
- Methanol Production
- Transportation
- Others
Segmentation 2: by Material Type
- Iridium
- Platinum
- Others
Segmentation 3: by Country
- Germany
- Netherlands
- Spain
- France
- Rest-of-Europe
How can this report add value to an organization?
Product/Innovation Strategy: The product segment helps the reader understand the different material types involved in the production of PEM electrolyzers. Moreover, the study provides the reader with a detailed understanding of the global PEM electrolyzer market based on the end user (refining industry, ammonia production, methanol production, power and energy storage, transportation, and others). PEM electrolyzers are gaining traction in end-user industries on the back of sustainability concerns and their high-power density properties. They are also being used for controlling GHG emissions.
Growth/Marketing Strategy: The Europe PEM electrolyzer market has seen major development by key players operating in the market, such as business expansions, partnerships, collaborations, mergers and acquisitions, and joint ventures. The favored strategy for the companies has been product developments, business expansions, and acquisitions to strengthen their position in the Europe PEM electrolyzer market.
Competitive Strategy: Key players in the Europe PEM electrolyzer market analyzed and profiled in the study involve PEM electrolyzer manufacturers and the overall ecosystem. Moreover, a detailed competitive benchmarking of the players operating in the Europe PEM electrolyzer market has been done to help the reader understand how players stack against each other, presenting a clear market landscape.
Key Market Players and Competition Synopsis
The companies that are profiled have been selected based on inputs gathered from primary experts and analysing company coverage, product portfolio, and market penetration.
Some of the prominent names established in this market are:
|
|
Table of Contents
Executive Summary
Scope of the Study
1. Markets
- 1.1. Industry Outlook
- 1.1.1. Trends: Current and Future
- 1.1.1.1. Rising Government Efforts to Construct Low-Carbon Infrastructure
- 1.1.1.2. Surge in Sustainable Hydrogen Economy
- 1.1.1.3. Rising Demand for Advanced Electrolysis Technologies
- 1.1.2. Supply Chain Analysis
- 1.1.3. Ecosystem/Ongoing Programs
- 1.1.3.1. Consortiums and Associations
- 1.1.3.2. Regulatory Bodies
- 1.1.3.3. Government Programs
- 1.1.3.4. Programs by Research Institutions and Universities
- 1.1.4. Impact of COVID-19 on the PEM Electrolyzer Market
- 1.1.5. Impact of Russia-Ukraine Conflict on the PEM Electrolyzer Market
- 1.1.5.1. Impact on the Supply Chain of the PEM Electrolyzer Market
- 1.1.5.2. Sanctions on Russia and Evaluation of These Sanctions
- 1.1.5.2.1. Effect of Sanctions on Russia
- 1.1.5.2.2. Impact of Sanctions on other Countries
- 1.1.5.3. The Road Ahead
- 1.1.5.3.1. Key Metal Importers from Russia
- 1.1.5.3.2. New Sourcing Avenues for Key Metal Importers from Russia
- 1.1.6. Impact of Iridium Demand-Supply Gap on the PEM Electrolyzer Market
- 1.1.6.1. Global Iridium Demand-Regional Analysis and Specification
- 1.1.6.1.1. North America
- 1.1.6.1.2. Europe
- 1.1.6.1.3. U.K.
- 1.1.6.2. Proposed Activities to Enhance the Efficiency of PEM Electrolyzers
- 1.1.6.3. Iridium, Osmium, and Ruthenium: Import and Export Analysis by key Countries, (2017-2021)
- 1.1.6.1. Global Iridium Demand-Regional Analysis and Specification
- 1.1.7. Global Iridium Supply and Demand Gap
- 1.1.8. PEM Electrolyzer Market Scenario: Historical vs Realistic vs Optimistic, MW, 2021-2031
- 1.1.9. Detailed Analysis of Key Steps Taken by Key 10 PEM Electrolyzer Manufacturers to Mitigate Iridium Demand-Supply Gap
- 1.1.9.1. Plug Power Inc.
- 1.1.9.1.1. Iridium Procurement Analysis
- 1.1.9.1.1.1. Key Challenges Faced by the Company
- 1.1.9.1.1.2. Key Steps to Mitigate Iridium Demand-Supply Gap
- 1.1.9.1.2. Plug Power Inc.: SWOT Analysis
- 1.1.9.1.1. Iridium Procurement Analysis
- 1.1.9.2. ITM Power PLC
- 1.1.9.2.1. Company Overview
- 1.1.9.2.2. Iridium Procurement Analysis
- 1.1.9.2.2.1. Key Challenges Faced by the Company
- 1.1.9.2.2.2. Key Steps to Mitigate Iridium Demand-Supply Gap
- 1.1.9.2.3. ITM Power PLC: SWOT Analysis
- 1.1.9.3. Cummins Inc.
- 1.1.9.3.1. Company Overview
- 1.1.9.3.2. Iridium Procurement Analysis
- 1.1.9.3.2.1. Key Challenges Faced by the Company
- 1.1.9.3.2.2. Key Steps to Mitigate Iridium Demand-Supply Gap
- 1.1.9.3.3. Cummins Inc.: SWOT Analysis
- 1.1.9.4. Siemens Energy AG
- 1.1.9.4.1. Company Overview
- 1.1.9.4.2. Iridium Procurement Analysis
- 1.1.9.4.2.1. Key Challenges Faced by the Company
- 1.1.9.4.2.2. Key Steps to Mitigate Iridium Demand-Supply Gap
- 1.1.9.4.3. Siemens Energy AG: SWOT Analysis
- 1.1.9.5. Ohmium International, Inc.
- 1.1.9.5.1. Company Overview
- 1.1.9.5.2. Iridium Procurement Analysis
- 1.1.9.5.2.1. Key Challenges Faced by the Company
- 1.1.9.5.2.2. Key Steps to Mitigate Iridium Demand-Supply Gap
- 1.1.9.5.3. Ohmium International, Inc.: SWOT Analysis
- 1.1.9.6. Hystar
- 1.1.9.6.1. Company Overview
- 1.1.9.6.2. Iridium Procurement Analysis
- 1.1.9.6.2.1. Key Challenges Faced by the Company
- 1.1.9.6.2.2. Key Steps to Mitigate Iridium Demand-Supply Gap
- 1.1.9.6.3. Hystar: SWOT Analysis
- 1.1.9.7. Nel ASA
- 1.1.9.7.1. Company Overview
- 1.1.9.7.2. Iridium Procurement Analysis
- 1.1.9.7.2.1. Key Challenges Faced by the Company
- 1.1.9.7.2.2. Key Steps to Mitigate Iridium Demand-Supply Gap
- 1.1.9.7.3. Nel ASA: SWOT Analysis
- 1.1.9.8. Hitachi Zosen Corporation
- 1.1.9.8.1. Company Overview
- 1.1.9.8.2. Iridium Procurement Analysis
- 1.1.9.8.2.1. Key Challenges Faced by the Company
- 1.1.9.8.2.2. Key Steps to Mitigate Iridium Demand-Supply Gap
- 1.1.9.8.3. Hitachi Zosen Corporation: SWOT Analysis
- 1.1.9.9. Elogen
- 1.1.9.9.1. Company Overview
- 1.1.9.9.2. Iridium Procurement Analysis
- 1.1.9.9.2.1. Key Challenges Faced by the Company
- 1.1.9.9.2.2. Key Steps to Mitigate Iridium Demand-Supply Gap
- 1.1.9.9.3. Elogen: SWOT Analysis
- 1.1.9.10. H-TEC SYSTEMS GmbH
- 1.1.9.10.1. Company Overview
- 1.1.9.10.2. Iridium Procurement Analysis
- 1.1.9.10.2.1. Key Challenges Faced by the Company
- 1.1.9.10.2.2. Key Steps to Mitigate Iridium Demand-Supply Gap
- 1.1.9.10.3. H-TEC SYSTEMS GmbH: SWOT Analysis
- 1.1.9.1. Plug Power Inc.
- 1.1.1. Trends: Current and Future
- 1.2. Business Dynamics
- 1.2.1. Business Drivers
- 1.2.1.1. Increasing Demand for Green Hydrogen
- 1.2.1.2. Rising Adoption of Fuel Cell Electric Vehicles (FCEVs)
- 1.2.1.3. Prevailing Research and Development Initiatives for Technological Advancements
- 1.2.2. Business Challenges
- 1.2.2.1. High Energy Losses during Production Process
- 1.2.2.2. High Cost of Production due to Usage of Precious Metals in PEM Technology
- 1.2.3. Business Strategies
- 1.2.3.1. Market Developments
- 1.2.4. Corporate Strategies
- 1.2.4.1. Partnerships, Collaborations, and Joint Ventures
- 1.2.5. Business Opportunities
- 1.2.5.1. Rising Need for Hydrogen Energy Storage Infrastructure
- 1.2.5.2. Rising Demand for Green Fuel Technologies and Green Fertilizers
- 1.2.1. Business Drivers
- 1.3. Start-Up/Emerging Manufacturer Landscape
- 1.3.1. Key Start-Ups/Emerging Manufacturers in the Ecosystem
- 1.3.2. New Products/Offerings
2. Regions
- 2.1. Europe
- 2.1.1. Market
- 2.1.1.1. Key Producers and Suppliers in Europe
- 2.1.1.2. Business Drivers
- 2.1.1.3. Business Challenges
- 2.1.2. Applications
- 2.1.2.1. Europe PEM Electrolyzer Market (by End User), Volume and Value Data
- 2.1.3. Products
- 2.1.3.1. Europe PEM Electrolyzer Market (by Material Type), Value Data
- 2.1.4. Europe (by Country)
- 2.1.4.1. Germany
- 2.1.4.1.1.1. Buyer Attributes
- 2.1.4.1.1.2. Key Producers and Suppliers in Germany
- 2.1.4.1.1.3. Regulatory Landscape
- 2.1.4.1.1.4. Business Drivers
- 2.1.4.1.1.5. Business Challenges
- 2.1.4.1.2. Applications
- 2.1.4.1.2.1. Germany PEM Electrolyzer Market (by End User), Volume and Value Data
- 2.1.4.1.3. Products
- 2.1.4.1.3.1. Germany PEM Electrolyzer Market (by Material Type), Value Data
- 2.1.4.2. France
- 2.1.4.2.1. Market
- 2.1.4.2.1.1. Buyer Attributes
- 2.1.4.2.1.2. Key Producers and Suppliers in France
- 2.1.4.2.1.3. Regulatory Landscape
- 2.1.4.2.1.4. Business Drivers
- 2.1.4.2.1.5. Business Challenges
- 2.1.4.2.2. Applications
- 2.1.4.2.2.1. France PEM Electrolyzer Market (by End User), Volume and Value Data
- 2.1.4.2.3. Products
- 2.1.4.2.3.1. France PEM Electrolyzer Market (by Material Type), Value Data
- 2.1.4.2.1. Market
- 2.1.4.3. Netherlands
- 2.1.4.3.1. Market
- 2.1.4.3.1.1. Buyer Attributes
- 2.1.4.3.1.2. Key Producers and Suppliers in the Netherlands
- 2.1.4.3.1.3. Regulatory Landscape
- 2.1.4.3.1.4. Business Drivers
- 2.1.4.3.1.5. Business Challenges
- 2.1.4.3.2. Applications
- 2.1.4.3.2.1. Netherlands PEM Electrolyzer Market (by End User), Volume and Value Data
- 2.1.4.3.3. Products
- 2.1.4.3.3.1. Netherlands PEM Electrolyzer Market (by Material Type), Value Data
- 2.1.4.3.1. Market
- 2.1.4.4. Spain
- 2.1.4.4.1. Market
- 2.1.4.4.1.1. Buyer Attributes
- 2.1.4.4.1.2. Key Producers and Suppliers in Spain
- 2.1.4.4.1.3. Regulatory Landscape
- 2.1.4.4.1.4. Business Drivers
- 2.1.4.4.1.5. Business Challenges
- 2.1.4.4.2. Applications
- 2.1.4.4.2.1. Spain PEM Electrolyzer Market (by End User), Volume and Value Data
- 2.1.4.4.3. Products
- 2.1.4.4.3.1. Spain PEM Electrolyzer Market (by Material Type), Value Data
- 2.1.4.4.1. Market
- 2.1.4.5. Rest-of-Europe
- 2.1.4.5.1. Market
- 2.1.4.5.1.1. Buyer Attributes
- 2.1.4.5.1.2. Key Producers and Suppliers in Rest-of-Europe
- 2.1.4.5.1.3. Business Drivers
- 2.1.4.5.1.4. Business Challenges
- 2.1.4.5.2. Applications
- 2.1.4.5.2.1. Rest-of-Europe PEM Electrolyzer Market (by End User), Volume and Value Data
- 2.1.4.5.3. Products
- 2.1.4.5.3.1. Rest-of-Europe PEM Electrolyzer Market (by Material Type), Value Data
- 2.1.4.5.1. Market
- 2.1.4.1. Germany
- 2.1.1. Market
- 2.2. U.K.
- 2.2.1. Market
- 2.2.1.1. Buyer Attributes
- 2.2.1.2. Key Producers and Suppliers in the U.K.
- 2.2.1.3. Regulatory Landscape
- 2.2.1.4. Business Drivers
- 2.2.1.5. Business Challenges
- 2.2.2. Applications
- 2.2.2.1. U.K. PEM Electrolyzer Market (by End User), Volume and Value Data
- 2.2.3. Products
- 2.2.3.1. U.K. PEM Electrolyzer Market (by Material Type), Value Data
- 2.2.1. Market
3. Markets - Competitive Benchmarking & Company Profiles
- 3.1. Competitive Benchmarking (2021)
- 3.1.1. Competitive Position Matrix (2021)
- 3.1.2. Product Matrix for Key Companies
- 3.1.3. Market Share Analysis of Key Companies, 2021
- 3.2. Company Profiles
- 3.2.1. Siemens Energy AG
- 3.2.1.1. Company Overview
- 3.2.1.1.1. Role of Siemens Energy AG in the PEM Electrolyzer Market
- 3.2.1.1.2. Product Portfolio
- 3.2.1.1.3. Production Site
- 3.2.1.2. Business Strategies
- 3.2.1.2.1. Market Developments
- 3.2.1.3. Corporate Strategies
- 3.2.1.3.1. Partnerships, Collaboration, and Joint Ventures
- 3.2.1.4. R & D Analysis
- 3.2.1.5. Analyst View
- 3.2.1.1. Company Overview
- 3.2.2. Hystar
- 3.2.2.1. Company Overview
- 3.2.2.1.1. Role of Hystar in the PEM Electrolyzer Market
- 3.2.2.1.2. Product Portfolio
- 3.2.2.1.3. Production Site
- 3.2.2.2. Business Strategies
- 3.2.2.2.1. Market Developments
- 3.2.2.3. Corporate Strategies
- 3.2.2.3.1. Partnerships, Collaborations, and Joint Ventures
- 3.2.2.4. Analyst View
- 3.2.2.1. Company Overview
- 3.2.3. Nel ASA
- 3.2.3.1. Company Overview
- 3.2.3.1.1. Role of Nel ASA in the PEM Electrolyzer Market
- 3.2.3.1.2. Product Portfolio
- 3.2.3.1.3. Production Site
- 3.2.3.2. Business Strategies
- 3.2.3.2.1. Market Developments
- 3.2.3.2.2. Partnerships, Collaborations, and Joint Venture
- 3.2.3.3. Analyst View
- 3.2.3.1. Company Overview
- 3.2.4. ITM Power PLC
- 3.2.4.1. Company Overview
- 3.2.4.1.1. Role of ITM Power PLC in the PEM Electrolyzer Market
- 3.2.4.1.2. Product Portfolio
- 3.2.4.1.3. Production Site
- 3.2.4.2. Business Strategies
- 3.2.4.2.1. Market Developments
- 3.2.4.3. Corporate Strategies
- 3.2.4.3.1. Merger and Acquisitions
- 3.2.4.4. R&D Analysis
- 3.2.4.5. Analyst View
- 3.2.4.1. Company Overview
- 3.2.5. H-TEC SYSTEMS GmbH
- 3.2.5.1. Company Overview
- 3.2.5.1.1. Role of H-TEC SYSTEMS GmbH in the PEM Electrolyzer Market
- 3.2.5.1.2. Product Portfolio
- 3.2.5.2. Business Strategies
- 3.2.5.2.1. Market Developments
- 3.2.5.3. Analyst View
- 3.2.5.1. Company Overview
- 3.2.6. H2GREEM S.L.
- 3.2.6.1. Company Overview
- 3.2.6.1.1. Role of H2GREEM S.L. in the PEM Electrolyzer Market
- 3.2.6.1.2. Product Portfolio
- 3.2.6.2. Business Strategies
- 3.2.6.2.1. Market Developments
- 3.2.6.3. Analyst View
- 3.2.6.1. Company Overview
- 3.2.7. Oort Energy Ltd.
- 3.2.7.1. Company Overview
- 3.2.7.1.1. Role of Oort Energy Ltd. in the PEM Electrolyzer Market
- 3.2.7.1.2. Product Portfolio
- 3.2.7.2. Corporate Strategies
- 3.2.7.2.1. Partnerships, Collaborations, and Joint Ventures
- 3.2.7.3. Analyst View
- 3.2.7.1. Company Overview
- 3.2.8. iGas energy GmbH
- 3.2.8.1. Company Overview
- 3.2.8.1.1. Role of iGas energy GmbH in the PEM Electrolyzer Market
- 3.2.8.1.2. Product Portfolio
- 3.2.8.2. Analyst View
- 3.2.8.1. Company Overview
- 3.2.9. IMI Critical Engineering
- 3.2.9.1. Company Overview
- 3.2.9.1.1. Role of IMI Critical Engineering in the PEM Electrolyzer Market
- 3.2.9.1.2. Product Portfolio
- 3.2.9.2. Business Strategies
- 3.2.9.2.1. Product Developments
- 3.2.9.2.2. Market Developments
- 3.2.9.3. Analyst View
- 3.2.9.1. Company Overview
- 3.2.1. Siemens Energy AG

