|
|
市場調査レポート
商品コード
1385523
インターベンショナルイメージングの世界市場 (2023-2033年):提供、用途、エンドユーザー、地域別の分析・予測・競合分析・企業プロファイルInterventional Imaging Market - A Global and Regional Analysis: Focus on Offering, Application, End User, Region, and Competitive Insights and Company Profiles - Analysis and Forecast, 2023-2033 |
||||||
|
|
|||||||
カスタマイズ可能
|
|||||||

| インターベンショナルイメージングの世界市場 (2023-2033年):提供、用途、エンドユーザー、地域別の分析・予測・競合分析・企業プロファイル |
|
出版日: 2023年11月21日
発行: BIS Research
ページ情報: 英文 256 Pages
納期: 1~5営業日
|

全表示
- 概要
- 図表
- 目次
世界のインターベンショナルイメージングの市場規模は、2022年の86億6,000万米ドルから、予測期間中は6.71%のCAGRで推移し、2023年には169億3,000万米ドルの規模に成長すると予測されています。
同市場の成長は、新技術の採用の増加や慢性疾患の流行、低侵襲手技の需要の増加などの要因によって推進されています。
提供区分別では、システムの部門が2022年の市場で優位を示しました。低侵襲処置および診断のためにインターベンショナルイメージングの利用が増加していることから、同部門は今後も大きな成長を遂げると予測されています。
用途別では、循環器の部門が2022年に優位を示しました。同部門の成長は、心疾患の有病率の上昇、心疾患の診断のための放射線治療の利用率の上昇、高齢者人口の拡大など、いくつかの要因に起因しています。電離放射線を使用しない心臓MRIは、心臓疾患の検出とモニタリングにますます使用されるようになっています。
地域別では、2022年のアジア太平洋市場で中国が35.47%のシェアを示しました。また、アジア太平洋地域は、予測期間中に最大の8.18%のCAGRを記録すると予測されています。同地域の市場は、高齢化の進行とヘルスケアニーズの増加など、さまざまな要因によって大きな成長を遂げています。
当レポートでは、世界のインターベンショナルイメージングの市場を調査し、市場概要、市場成長への各種影響因子の分析、法規制環境、特許動向、市場規模の推移・予測、各種区分・地域/主要国別の詳細分析、競合情勢、主要企業の分析などをまとめています。
世界のインターベンショナルイメージング市場:概要
| 主要市場統計 | |
|---|---|
| 予測期間 | 2023-2033年 |
| 2023年評価 | 88億4,000万米ドル |
| 2033年予測 | 169億3,000万米ドル |
| CAGR | 6.71% |
主要企業:
|
|
上記のリストに含まれない企業も、本レポートのさまざまなセクション (該当する場合) で紹介しています。
目次
第1章 市場
第2章 世界のインターベンショナルイメージング市場:概要
- 市場概要
- 市場規模と成長の可能性
- インターベンショナルイメージングの現在と将来の状況
第3章 産業の展望
- 主要動向
- 特許分析
- COVID-19による世界のインターベンショナルイメージング市場への影響
- 規制要件
- 製品ベンチマーキング
第4章 世界のインターベンショナルイメージング市場:市場力学
- 影響分析
- 市場促進要因
- 市場抑制要因
- 市場機会
第5章 競合情勢
- 概要
- 主要な戦略と展開
- 市場シェア分析:企業別
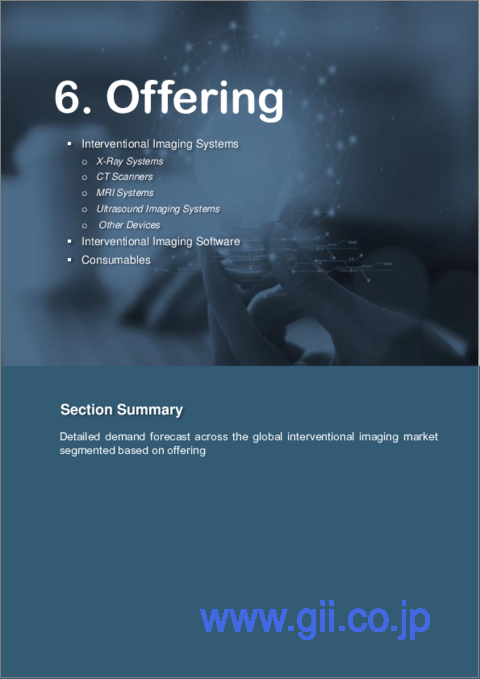
第6章 世界のインターベンショナルイメージング市場:提供別
- 概要
- 成長シェア分析
- インターベンショナルイメージングシステム
- CTスキャナ
- X線システム
- MRIシステム
- 超音波画像診断システム
- インターベンショナルイメージングソフトウェア
- 消耗品
第7章 世界のインターベンショナルイメージング市場:用途別
- 概要
- 成長シェア分析
- 循環器
- 神経内科
- 筋骨格系
- 腫瘍
- 泌尿器科
- 消化器科
- 産科
- 婦人科
- その他
第8章 世界のインターベンショナルイメージング市場:エンドユーザー別
- 概要
- 成長シェア分析
- 病院
- クリニック
- 外来手術センター
第9章 世界のインターベンショナルイメージング市場:地域別
- 概要
- 北米
- 市場規模・予測
- 米国
- カナダ
- 欧州
- 市場規模・予測
- 英国
- ドイツ
- フランス
- イタリア
- スペイン
- ロシア
- 欧州のその他の地域
- アジア太平洋
- 市場規模・予測
- 日本
- 中国
- オーストラリア
- 韓国
- インド
- シンガポール
- アジア太平洋地域のその他の地域
- ラテンアメリカ
- 市場規模・予測
- ブラジル
- メキシコ
- ラテンアメリカのその他の地域
- 世界のその他の地域
- 市場規模・予測
第10章 企業プロファイル
- インターベンショナルイメージング市場のアクティブ企業
List of Figures
- Figure 1: Global Prevalence of Chronic Disease, 2022
- Figure 2: Global Interventional Imaging Market, $Billion, 2022-2033
- Figure 3: Global Interventional Imaging Market, Market Dynamics
- Figure 4: Global Interventional Imaging Market (by Offering), % Share, 2022 and 2033
- Figure 5: Global Interventional Imaging Market (by Application), %Share, 2022 and 2033
- Figure 6: Global Interventional Imaging Market (by End User), %Share, 2022 and 2033
- Figure 7: Global Interventional Imaging Market (by Region), $Billion, 2022 and 2033
- Figure 8: Impact of COVID-19 on Manufacturers
- Figure 9: Global Interventional Imaging Market Segmentation
- Figure 10: Global Interventional Imaging Market: Research Methodology
- Figure 11: Primary Research Methodology
- Figure 12: Bottom-Up Approach (Segment-Wise Analysis)
- Figure 13: Top-Down Approach (Segment-Wise Analysis)
- Figure 14: Global Interventional Imaging Market, $Billion, 2022-2033
- Figure 15: Global Interventional Imaging Market, Key Trends
- Figure 16: Global Interventional Imaging Market, Patent Analysis (by Year), January 2020-December 2022
- Figure 17: Global Interventional Imaging Market, Patent Analysis (by Country), January 2020-December 2022
- Figure 18: Factors Contributing to the Decline in the Global Interventional Imaging Market
- Figure 19: Global Interventional Imaging Market, Impact Analysis
- Figure 20: Advantages of 4K Medical Imaging
- Figure 21: Incidence of Cancer (by Region), 2020-2040
- Figure 22: Synergistic Activities, 2021-2023
- Figure 23: Mergers and Acquisitions, by Company, 2020-2023
- Figure 24: Factors Contributing to Adverse Events in Minimally Invasive Surgical Procedures
- Figure 25: Medicare National Reimbursement Values for Interventional Radiology Procedures, 2016-2020
- Figure 26: Key Players Integration of AI and Interventional Imaging
- Figure 27: Examples of Integration of AI in Interventional Imaging, 2022-2023
- Figure 28: Other Technological Advancements
- Figure 29: Share of Key Developments and Strategies, January 2020-September 2023
- Figure 30: Number of Synergistic Activities (by Year), January 2020-September 2023
- Figure 31: Number of Product Launches (by Year), January 2020-September 2023
- Figure 32: Number of Regulatory Accreditations (by Year), January 2020-September 2023
- Figure 33: Number of Mergers and Acquisitions (by Year), January 2020-September 2023
- Figure 34: Number of Regulatory Approvals (by Year), January 2020-September 2023
- Figure 35: Market Share Analysis for Global Interventional Imaging Market (by Company), 2022
- Figure 36: Global Interventional Imaging Market (by Offering)
- Figure 37: Global Interventional Imaging Market (by Offering), $Billion, 2022 and 2033
- Figure 38: Growth-Share Analysis for Global Interventional Imaging Market (by Offering), 2023-2033
- Figure 39: Global Interventional Imaging Market (Interventional Imaging Systems), $Billion, 2022-2033
- Figure 40: Global Interventional Imaging Market (CT Scanners), $Billion, 2022-2033
- Figure 41: Global Interventional Imaging Market (X-Ray Systems), $Billion, 2022-2033
- Figure 42: Global Interventional Imaging Market (MRI Systems), $Million, 2022-2033
- Figure 43: Global Interventional Imaging Market (Ultrasound Imaging Systems), $Billion, 2022-2033
- Figure 44: Global Interventional Imaging Market (Interventional Imaging Software), $Billion, 2022-2033
- Figure 45: Global Interventional Imaging Market (Consumables), $Billion, 2022-2033
- Figure 46: Global Interventional Imaging Market (by Application)
- Figure 47: Global Interventional Imaging Market (by Application), $Million, 2022 and 2033
- Figure 48: Growth-Share Analysis for Global Interventional Imaging Market (by Application), 2023-2033
- Figure 49: Global Interventional Imaging Market (Cardiology), $Billion, 2022-2033
- Figure 50: Global Interventional Imaging Market (Neurology), $Billion, 2022-2033
- Figure 51: Global Interventional Imaging Market (Musculoskeletal), $Billion, 2022-2033
- Figure 52: Global Interventional Imaging Market (Oncology), $Billion, 2022-2033
- Figure 53: Global Interventional Imaging Market (Urology), $Billion, 2022-2033
- Figure 54: Global Interventional Imaging Market (Gastroenterology), $Billion, 2022-2033
- Figure 55: Global Interventional Imaging Market (Obstetrics), $Billion, 2022-2033
- Figure 56: Global Interventional Imaging Market (Gynecology), $Billion, 2022-2033
- Figure 57: Global Interventional Imaging Market (Others), $Billion, 2022-2033
- Figure 58: Global Interventional Imaging Market (by End User)
- Figure 59: Global Interventional Imaging Market (by End User), $Million, 2022 and 2033
- Figure 60: Growth-Share Analysis for Global Interventional Imaging Market (by End User), 2023-2033
- Figure 61: Global Interventional Imaging Market (Hospitals), $Billion, 2022-2033
- Figure 62: Global Interventional Imaging Market (Clinics), $Billion, 2022-2033
- Figure 63: Global Interventional Imaging Market (Ambulatory Surgical Centers), $Billion, 2022-2033
- Figure 64: Global Interventional Imaging Market (by Region)
- Figure 65: Incidence of Total Cancer in North America (by Country), 2020 vs. 2040
- Figure 66: North America Interventional Imaging Market, $Billion, 2022-2033
- Figure 67: North America Interventional Imaging Market (by Offering), $Million, 2022-2033
- Figure 68: North America Interventional Imaging Market (by Application), $Million, 2022-2033
- Figure 69: North America Interventional Imaging Market (by End User), $Million, 2022-2033
- Figure 70: Estimated New Cases and Deaths, U.S., 2023
- Figure 71: U.S. Interventional Imaging Market, $Million, 2022-2033
- Figure 72: U.S. Interventional Imaging Market (by Offering), $Million, 2022-2033
- Figure 73: U.S. Interventional Imaging Market (by Application), $Million, 2022-2033
- Figure 74: U.S. Interventional Imaging Market (by End User), $Million, 2022-2033
- Figure 75: Canada Interventional Imaging Market, $Million, 2022-2033
- Figure 76: Canada Interventional Imaging Market (by Offering), $Million, 2022-2033
- Figure 77: Canada Interventional Imaging Market (by Application), $Million, 2022-2033
- Figure 78: Canada Interventional Imaging Market (by End User), $Million, 2022-2033
- Figure 79: Incidence of Cancer, EU5, 2020-2040
- Figure 80: Europe Interventional Imaging Market, $Billion, 2022-2033
- Figure 81: Europe Interventional Imaging Market (by Offering), $Million, 2022-2033
- Figure 82: Europe Interventional Imaging Market (by Application), $Million, 2022-2033
- Figure 83: Europe Interventional Imaging Market (by End User), $Million, 2022-2033
- Figure 84: Incidence of Cancer, U.K., 2020-2040
- Figure 85: U.K. Interventional Imaging Market, $Billion, 2022-2033
- Figure 86: U.K. Interventional Imaging Market (by Offering), $Million, 2022-2033
- Figure 87: U.K. Interventional Imaging Market (by Application), $Million, 2022-2033
- Figure 88: U.K. Interventional Imaging Market (by End User), $Million, 2022-2033
- Figure 89: Incidence of Cancer and Mortality, Germany, 2020-2040
- Figure 90: Germany Interventional Imaging Market, $Million, 2022-2033
- Figure 91: Germany Interventional Imaging Market (by Offering), $Million, 2022-2033
- Figure 92: Germany Interventional Imaging Market (by Application), $Million, 2022-2033
- Figure 93: Germany Interventional Imaging Market (by End User), $Million, 2022-2033
- Figure 94: France Interventional Imaging Market, $Million, 2022-2033
- Figure 95: France Interventional Imaging Market (by Offering), $Million, 2022-2033
- Figure 96: France Interventional Imaging Market (by Application), $Million, 2022-2033
- Figure 97: France Interventional Imaging Market (by End User), $Million, 2022-2033
- Figure 98: Incidence of Cancer, Italy, 2020-2040
- Figure 99: Italy Interventional Imaging Market, $Million, 2022-2033
- Figure 100: Italy Interventional Imaging Market (by Offering), $Million, 2022-2033
- Figure 101: Italy Interventional Imaging Market (by Application), $Million, 2022-2033
- Figure 102: Italy Interventional Imaging Market (by End User), $Million, 2022-2033
- Figure 103: Incidence of Cancer, France, 2020-2040
- Figure 104: Spain Interventional Imaging Market, $Million, 2022-2033
- Figure 105: Spain Interventional Imaging Market (by Offering), $Million, 2022-2033
- Figure 106: Spain Interventional Imaging Market (by Application), $Million, 2022-2033
- Figure 107: Spain Interventional Imaging Market (by End User), $Million, 2022-2033
- Figure 108: Russia Interventional Imaging Market, $Million, 2022-2033
- Figure 109: Russia Interventional Imaging Market (by Offering), $Million, 2022-2033
- Figure 110: Russia Interventional Imaging Market (by Application), $Million, 2022-2033
- Figure 111: Russia Interventional Imaging Market (by End User), $Million, 2022-2033
- Figure 112: Rest-of-Europe Interventional Imaging Market, $Million, 2022-2033
- Figure 113: Rest-of-Europe Interventional Imaging Market (by Offering), $Million, 2022-2033
- Figure 114: Rest-of-Europe Interventional Imaging Market (by Application), $Million, 2022-2033
- Figure 115: Rest-of-Europe Interventional Imaging Market (by End User), $Million, 2022-2033
- Figure 116: Incidence of Prostate Cancer, Asia, 2020-2040
- Figure 117: Asia-Pacific Interventional Imaging Market, $Billion, 2022-2033
- Figure 118: Asia-Pacific Interventional Imaging Market (by Offering), $Million, 2022-2033
- Figure 119: Asia-Pacific Interventional Imaging Market (by Application), $Million, 2022-2033
- Figure 120: Asia-Pacific Interventional Imaging Market (by End User), $Million, 2022-2033
- Figure 121: Japan Interventional Imaging Market, $Million, 2022-2033
- Figure 122: Japan Interventional Imaging Market (by Offering), $Million, 2022-2033
- Figure 123: Japan Interventional Imaging Market (by Application), $Million, 2022-2033
- Figure 124: Japan Interventional Imaging Market (by End User), $Million, 2022-2033
- Figure 125: Incidence of Cancer, China, 2020-2040
- Figure 126: China Interventional Imaging Market, $Million, 2022-2033
- Figure 127: China Interventional Imaging Market (by Offering), $Million, 2022-2033
- Figure 128: China Interventional Imaging Market (by Application), $Million, 2022-2033
- Figure 129: China Interventional Imaging Market (by End User), $Million, 2022-2033
- Figure 130: Australia Interventional Imaging Market, $Million, 2022-2033
- Figure 131: Australia Interventional Imaging Market (by Offering), $Million, 2022-2033
- Figure 132: Australia Interventional Imaging Market (by Application), $Million, 2022-2033
- Figure 133: Australia Interventional Imaging Market (by End User), $Million, 2022-2033
- Figure 134: South Korea Interventional Imaging Market, $Million, 2022-2033
- Figure 135: South Korea Interventional Imaging Market (by Offering), $Million, 2022-2033
- Figure 136: South Korea Interventional Imaging Market (by Application), $Million, 2022-2033
- Figure 137: South Korea Interventional Imaging Market (by End User), $Million, 2022-2033
- Figure 138: Incidence of Cancer, India, 2020-2040
- Figure 139: India Interventional Imaging Market, $Million, 2022-2033
- Figure 140: India Interventional Imaging Market (by Offering), $Million, 2022-2033
- Figure 141: India Interventional Imaging Market (by Application), $Million, 2022-2033
- Figure 142: India Interventional Imaging Market (by End User), $Million, 2022-2033
- Figure 143: Singapore Interventional Imaging Market, $Billion, 2022-2033
- Figure 144: Singapore Interventional Imaging Market (by Offering), $Million, 2022-2033
- Figure 145: Singapore Interventional Imaging Market (by Application), $Million, 2022-2033
- Figure 146: Singapore Interventional Imaging Market (by End User), $Million, 2022-2033
- Figure 147: Incidence of Cancer, Rest-of-Asia-Pacific, 2020-2040
- Figure 148: Rest-of-Asia-Pacific Interventional Imaging Market, $Million, 2022-2033
- Figure 149: Rest-of-Asia-Pacific Interventional Imaging Market (by Offering), $Million, 2022-2033
- Figure 150: Rest-of-Asia-Pacific Interventional Imaging Market (by Application), $Million, 2022-2033
- Figure 151: Rest-of-Asia-Pacific Interventional Imaging Market (by End User), $Million, 2022-2033
- Figure 152: Latin America Interventional Imaging Market, $Billion, 2022-2033
- Figure 153: Latin America Interventional Imaging Market (by Offering), $Million, 2022-2033
- Figure 154: Latin America Interventional Imaging Market (by Application), $Million, 2022-2033
- Figure 155: Latin America Interventional Imaging Market (by End User), $Million, 2022-2033
- Figure 156: Brazil Interventional Imaging Market, $Million, 2022-2033
- Figure 157: Brazil Interventional Imaging Market (by Offering), $Million, 2022-2033
- Figure 158: Brazil Interventional Imaging Market (by Application), $Million, 2022-2033
- Figure 159: Brazil Interventional Imaging Market (by End User), $Million, 2022-2033
- Figure 160: Mexico Interventional Imaging Market, $Million, 2022-2033
- Figure 161: Mexico Interventional Imaging Market (by Offering), $Million, 2022-2033
- Figure 162: Mexico Interventional Imaging Market (by Application), $Million, 2022-2033
- Figure 163: Mexico Interventional Imaging Market (by End User), $Million, 2022-2033
- Figure 164: Rest-of-Latin America Interventional Imaging Market, $Million, 2022-2033
- Figure 165: Rest-of-Latin America Interventional Imaging Market (by Offering), $Million, 2022-2033
- Figure 166: Rest-of-Latin America Interventional Imaging Market (by Application), $Million, 2022-2033
- Figure 167: Rest-of-Latin America Interventional Imaging Market (by End User), $Million, 2022-2033
- Figure 168: Rest-of-the-World Interventional Imaging Market, $Billion, 2022-2033
- Figure 169: Rest-of-the-World Interventional Imaging Market (by Offering), $Million, 2022-2033
- Figure 170: Rest-of-the-World Interventional Imaging Market (by Application), $Million, 2022-2033
- Figure 171: Rest-of-the-World Interventional Imaging Market (by End User), $Billion, 2022-2033
- Figure 172: Total Number of Companies Profiled
- Figure 173: Company Overview
- Figure 174: Company Overview
- Figure 175: Company Overview
- Figure 176: Company Overview
- Figure 177: Company Overview
- Figure 178: Company Overview
- Figure 179: Company Overview
- Figure 180: Company Overview
- Figure 181: Company Overview
- Figure 182: Company Overview
- Figure 183: Company Overview
- Figure 184: Company Overview
- Figure 185: Company Overview
- Figure 186: Company Overview
List of Tables
- Table 1: Global Interventional Imaging Market, Impact Analysis
- Table 2: Global Interventional Imaging Market, Key Developments Analysis, January 2020-September 2023
- Table 3: Key Questions Answered in the Report
- Table 4: Current and Future State of Interventional Imaging in Industry
- Table 5: Global Interventional Imaging Market, Product Benchmarking
- Table 6: Areas Affected by Innovations in Interventional Imaging Increasing Minimally Invasive Procedures
- Table 7: Key Players Utilizing 4K Imaging Technology
- Table 8: Interventional Imaging System Utilizing 3D Imaging.
- Table 9: Interventional Imaging System Utilizing 4D Imaging.
- Table 10: Cardiovascular Indication and Interventional Imaging Procedure Utilized
- Table 11: Major Cancer Indications and Interventional Imaging Procedure Utilized
- Table 12: Example of Chronic Diseases and Interventional Imaging Procedure
- Table 13: Average Price of Few Interventional Imaging Systems
- Table 14: Interventional Imaging Ecosystem Active Players
“Global Interventional Imaging Market Expected to Reach $16.93 Billion by 2033.”
Global Interventional Imaging Market Overview
| KEY MARKET STATISTICS | |
|---|---|
| Forecast Period | 2023 - 2033 |
| 2023 Evaluation | $8.84 Billion |
| 2033 Forecast | $16.93 Billion |
| CAGR | 6.71% |
The global interventional imaging market is projected to experience substantial growth over the forecast period 2023-2033. Moreover, the market value for 2022 was estimated to be $8.66 billion and is expected to reach $16.93 billion by 2023, showcasing a CAGR of 6.71% during the forecast period. This growth can be attributed to the increasing demand for minimally invasive procedures, along with the increasing adoption of new technologies and the prevalence of chronic diseases. The market includes various procedures, consumables, systems, and software's designed for diagnosis and treatment of chronic diseases.
Market Lifecycle Stage
The global interventional imaging market is in a growth and expansion stage of development phase. The recent years have seen improvements and innovations in imaging, particularly with the advent of 3D and 4D imaging and the 4k imaging (for high quality image visualization). New technologies and devices that offer faster, more efficient, point-of-care, or more cost-effective imaging could rejuvenate the market further.
Industry Impact
The interventional imaging market has proven to be a cornerstone in the evolution of imaging systems. One of the most profound impacts is felt within the realm of medical diagnostics and treatment. The ability to efficiently diagnose has paved the way for the detect diseases at much earlier stages. This early detection often translates to more effective treatments and better prognosis for patients. The interventional imaging technology has transformed the idea of treatment in addition to detection.
In essence, the Global interventional imaging market has not just supported but catalyzed numerous breakthroughs in both diagnosis and treatment. Its influence continues to grow as the methods become more refined and accessible, promising even more revolutionary findings in the future.
Market Segmentation:
Segmentation 1: by Offering
- Interventional Imaging Systems
- Interventional Imaging Software
- Consumables
Interventional Imaging Systems to Dominate the Global Interventional Imaging Market (by Offering)
Based on offering , the interventional imaging systems segment dominated the global interventional imaging market in FY2022. The interventional imaging systems constitute the prevalent offering type owing to their widespread use in almost all applications related to the global interventional imaging market. Due to the increasing utilization of interventional imaging for minimally invasive procedures and diagnosis the market is anticipated that this segment will continue to witness significant growth in the coming years.
Segmentation 2: by Application
- Cardiology
- Neurology
- Musculoskeletal
- Oncology
- Urology
- Gastroenterology
- Obstetrics
- Gynaecology
- Others
Cardiology to Dominate the Global Interventional Imaging Market (by Application)
Based on application, the global interventional imaging market was dominated by the cardiology segment in FY2022. The growth of this segment can be attributed to several factors, including the elevated prevalence of cardiac diseases, the heightened utilization of radiology procedures for diagnosing cardiac conditions, and the expanding elderly population. Cardiac MRI, which does not employ ionizing radiation, is increasingly used for detecting and monitoring cardiac diseases. It facilitates the assessment of both cardiac anatomy and functionality in individuals with heart ailments.
Segmentation 3: by End User
- Hospitals
- Ambulatory Surgical Centres
- Clinics
Hospitals Segment to Dominate the Global Interventional Imaging Market Based on End User
Based on end user, the hospitals segment accounted for the largest share of the global interventional imaging market in FY2022. Interventional imaging is a rapidly growing field of medicine that uses image-guided procedures to diagnose and treat a wide range of conditions. Interventional imaging is performed in hospitals in dedicated imaging suites called catheterization labs (Cath labs).
Segmentation 4: by Region
- North America
- Europe
- Asia-Pacific
- Latin America
- Rest-of-the-World
China dominated the Asia-Pacific market in 2022 with a share of 35.47%. Moreover, Asia-Pacific is expected to register the highest CAGR of 8.18% during the forecast period 2023-2033. The interventional imaging market in the Asia-Pacific (APAC) region is witnessing significant growth, driven by various factors, including increasing demand for aging population, with increasing healthcare needs. This demographic shift drives demand for interventional imaging procedures, including diagnostic angiography and vascular interventions.
The economic growth in countries like China and India is resulting in increased healthcare spending. Patients are increasingly seeking high-quality medical care, including interventional imaging services. This presents substantial opportunities for market expansion. Furthermore, technological advancement and adoption are on the rise.
Recent Developments in the Global Interventional Imaging Market
- In October 2023, Koninklijke Philips NV revealed its most recent advancements in point-of-care ultrasound technology at the 2023 American College of Emergency Physicians Scientific Assembly in Philadelphia, U.S.
- In July 2023, Stryker Corporation launched the Q Guidance System, along with the cranial guidance software. This system is created to assist surgeons by providing image-based planning and real-time guidance during cranial surgeries.
- In February 2020, Guerbet obtained official registration from Taiwan's Ministry of Health & Welfare for its groundbreaking interventional oncology system known as Vectorio.
- In August 2022, Becton Dickinson Korea announced the acquisition of Bard Korea and the subsequent integration of Bard Korea's legal entity into Becton Dickinson Korea. This strategic merger enabled the company to enhance its portfolio by consolidating Bard's thriving medical device divisions specializing in surgery, interventional procedures, and oncology.
Demand - Drivers, Restraints, and Opportunities
Market Demand Drivers:
Increasing Demand for Minimally Invasive Surgical Procedures: Interventional imaging allows rapid image capture and top-notch image clarity, elevating the overall patient experience. These breakthroughs, used across various medical fields, enhance efficiency, and diagnostic precision, and can expedite the diagnosis process. Moreover, improvements in imaging have played a crucial role in the growth of minimally invasive surgical procedures, minimizing the necessity for invasive surgeries, thereby lowering risks and speeding up patient recovery times.
Market Restraints:
Shortages of Skilled Professionals: Lack of training is one of the key barriers to the growth of the conventional technologies market. The challenge can be distinctly divided into two types - lack of formal training opportunities and sufficient operating time. In almost all cases, despite receiving advanced minimally invasive surgical training, the surgeon is highly unlikely to perform the procedure immediately afterward. The adoption of minimally invasive surgical procedures involves a steep learning curve.
Market Opportunities:
Integration of AI in Interventional Imaging: The integration of artificial intelligence (AI) in interventional imaging has opened up a multitude of prospects within the global interventional imaging market. Numerous key players are actively developing imaging software leveraging AI, which is poised to elevate the market further. Interventional imaging platforms that are enabled with AI offer high accuracy in assisting surgical procedures, enhanced decision-making, and workflow automation in reducing the variations that could affect the health of the patients.
How can this report add value to an organization?
Workflow/Innovation Strategy: The global interventional imaging market (by offering) has been segmented into detailed segments, including different types of interventional imaging systems, namely X-ray, CT scanners, MRI systems, and ultrasound imaging systems. Moreover, the study provides the reader with a detailed understanding of the different applications of these products.
Growth/Marketing Strategy: Global interventional imaging process is being used for diagnosis and treatment procedures, which are further used for many applications such as cardiology, neurology, musculoskeletal, oncology, urology, gastroenterology, obstetrics, gynecology, and others. Various companies are providing systems, software, and consumables for the global interventional imaging market.
Competitive Strategy: Key players in the global interventional imaging market have been analyzed and profiled in the study, including manufacturers involved in new product launches, acquisitions, expansions, and strategic collaborations. Moreover, a detailed competitive benchmarking of the players operating in the global interventional imaging market has been done to help the reader understand how players stack against each other, presenting a clear market landscape. Additionally, comprehensive competitive strategies such as partnerships, agreements, and collaborations will aid the reader in understanding the untapped revenue pockets in the market.
Methodology
Key Considerations and Assumptions in Market Engineering and Validation
- The base year considered for the calculation of the market size is 2022. The historical year analysis has been done from FY2020 to FY2021, and the market size has been calculated for FY2022 and projected for the period 2023-2033.
- The geographical distribution of the market revenue is estimated to be the same as the company's net revenue distribution. All the numbers are adjusted off to two digits after decimal for report presentation reasons. However, the real figures have been utilized for compound annual growth rate (CAGR) estimation. CAGR is calculated from 2023 to 2033.
- The market has been mapped based on different types of products available in the market and based on several indications. All the key manufacturing companies that have a significant number of offerings to the global interventional imaging market have been considered and profiled in the report.
- In the study, the primary respondent's verification has been considered to finalize the estimated market for the global interventional imaging market.
- The latest annual reports of each market player have been taken into consideration for market revenue calculation.
- Market strategies and developments of key players have been considered for the calculation of sub-segment split.
- The base currency considered for the market analysis is US$. Currencies other than the US$ have been converted to the US$ for all statistical calculations, considering the average conversion rate for that particular year. The currency conversion rate has been taken from the historical exchange rate of the Oanda website or from the annual reports of the respective company, if stated.
Primary Research
The key data points taken from the primary sources include:
- Validation and triangulation of all the numbers and graphs
- Validation of the report's segmentation and key qualitative findings
- Understanding of the numbers of the various markets for market type
- Percentage split of individual markets for regional analysis
Secondary Research
Open Sources
- National Center for Biotechnology Information (NCBI), PubMed, Science Direct, World Bank Group, Organisation for Economic Co-operation and Development (OECD), Centers for Disease Control and Prevention (CDC), Global Burden Disease (GBD), and World Health Organization (WHO)
- Annual reports, SEC filings, and investor presentations of the leading market players
- Company websites and detailed study of their portfolio
- Gold standard magazines, journals, whitepapers, press releases, and news articles
- Databases
The key data points taken from the secondary sources include:
- Segmentations, split-ups, and percentage shares
- Data for market value
- Key industry trends of the top players in the market
- Qualitative insights into various aspects of the market, key trends, and emerging areas of innovation
- Quantitative data for mathematical and statistical calculations
Key Market Players and Competition Synopsis
Medical procedure that utilizes image-guided, minimally invasive techniques for both diagnosing and treating a wide range of diseases. Interventional imaging depends on tools such as angiography, mobile C-arm systems, and fluoroscopy imaging to carry out procedures like thrombolysis, embolization, and biopsies, as well as various vascular and other minimally invasive interventions. These approaches have the potential to significantly decrease recovery periods, lower risks, and reduce overall medical expenses.
The interventional imaging market refers to the interventional imaging systems, interventional imaging software, and consumables to guide minimally invasive interventions and are involved in the diagnosis and treatment of chronic diseases.
Some of the prominent companies in this market are:
|
|
Companies that are not a part of the aforementioned pool have been well represented across different sections of the report (wherever applicable).
Table of Contents
1 Markets
- 1.1 Product Definition
- 1.2 Inclusion and Exclusion
- 1.3 Key Findings
2 Global Interventional Imaging Market: Overview
- 2.1 Market Introduction
- 2.2 Market Footprint and Growth Potential, $Billion, 2022-2033
- 2.3 Current and Future State of Interventional Imaging in Industry
3 Industry Outlook
- 3.1 Key Trends
- 3.2 Patent Analysis
- 3.2.1 Patent Analysis (by Year)
- 3.2.2 Patent Analysis (by Country)
- 3.3 COVID-19 Impact on Global Interventional Imaging Market
- 3.3.1 COVID-19 Impact: Current Scenario of the Market
- 3.3.2 Pre- and During-COVID-19 Impact Assessment
- 3.3.2.1 Pre-COVID-19
- 3.3.2.2 During-COVID-19
- 3.4 Regulatory Requirements
- 3.4.1 Regulatory and Legal Requirements and Framework in the U.S.
- 3.4.2 Regulatory and Legal Requirements and Framework in Europe
- 3.4.3 Regulatory and Legal Requirements and Framework in Asia-Pacific
- 3.4.3.1 China
- 3.4.3.2 Japan
- 3.4.3.3 India
- 3.4.3.4 Australia
- 3.5 Product Benchmarking
4 Global Interventional Imaging Market Dynamics
- 4.1 Impact Analysis
- 4.2 Market Drivers
- 4.2.1 Increasing Demand for Minimally Invasive Surgical Procedures
- 4.2.2 Technological Advancements in Surgical Procedures and Imaging Technologies
- 4.2.2.1 Rising Adoption of 4K Imaging Technologies
- 4.2.2.2 3D and 4D Imaging
- 4.2.3 Upsurge in Incidence of Chronic Diseases Leading to Growth in the Adoption of Interventional Imaging
- 4.2.3.1 Cardiovascular Diseases
- 4.2.3.2 Cancer
- 4.2.4 Increasing Adoption of Inorganic Growth Strategies in the Market
- 4.3 Market Restraints
- 4.3.1 Shortages of Skilled Professionals
- 4.3.2 Restrictive Reimbursement Landscape
- 4.3.3 High Cost of Interventional Imaging Systems
- 4.4 Market Opportunities
- 4.4.1 Integration of AI in Interventional Imaging
- 4.4.2 Collaboration with Hospitals, Clinics, and Other Healthcare Facilities for Development of Interventional Imaging Solutions
5 Competitive Landscape
- 5.1 Overview
- 5.2 Key Strategies and Developments
- 5.2.1 Synergistic Activities
- 5.2.2 Product Launches
- 5.2.3 Regulatory Accreditations
- 5.2.4 Mergers and Acquisitions
- 5.2.5 Regulatory Approvals
- 5.2.6 Funding Activities
- 5.3 Market Share Analysis (by Company), 2022
6 Global Interventional Imaging Market: by Offering
- 6.1 Overview
- 6.2 Growth-Share Analysis
- 6.3 Interventional Imaging Systems
- 6.3.1 CT Scanners
- 6.3.2 X-Ray Systems
- 6.3.3 MRI Systems
- 6.3.4 Ultrasound Imaging Systems
- 6.4 Interventional Imaging Software
- 6.5 Consumables
7 Global Interventional Imaging Market: by Application
- 7.1 Overview
- 7.2 Growth-Share Analysis
- 7.3 Cardiology
- 7.4 Neurology
- 7.5 Musculoskeletal
- 7.6 Oncology
- 7.7 Urology
- 7.8 Gastroenterology
- 7.9 Obstetrics
- 7.1 Gynecology
- 7.11 Others
8 Global Interventional Imaging Market: by End Users
- 8.1 Overview
- 8.2 Growth-Share Analysis
- 8.3 Hospitals
- 8.4 Clinics
- 8.5 Ambulatory Surgical Centers
9 Global Interventional Imaging Market (by Region), ($Billion), 2022-2033
- 9.1 Overview
- 9.2 North America
- 9.2.1 Market Sizing and Forecast
- 9.2.1.1 North America Interventional Imaging Market (by Offering)
- 9.2.1.2 North America Interventional Imaging Market (by Application)
- 9.2.1.3 North America Interventional Imaging Market (by End User)
- 9.2.2 U.S.
- 9.2.2.1 Market Sizing and Forecast
- 9.2.2.1.1 U.S. Interventional Imaging Market (by Offering)
- 9.2.2.1.2 U.S. Interventional Imaging Market (by Application)
- 9.2.2.1.3 U.S. Interventional Imaging Market (by End User)
- 9.2.2.1 Market Sizing and Forecast
- 9.2.3 Canada
- 9.2.3.1 Market Sizing and Forecast
- 9.2.3.1.1 Canada Interventional Imaging Market (by Offering)
- 9.2.3.1.2 Canada Interventional Imaging Market (by Application)
- 9.2.3.1.3 Canada Interventional Imaging Market (by End User)
- 9.2.3.1 Market Sizing and Forecast
- 9.2.1 Market Sizing and Forecast
- 9.3 Europe
- 9.3.1 Market Sizing and Forecast
- 9.3.1.1 Europe Interventional Imaging Market (by Offering)
- 9.3.1.2 Europe Interventional Imaging Market (by Application)
- 9.3.1.3 Europe Interventional Imaging Market (by End User)
- 9.3.2 U.K.
- 9.3.2.1 Market Sizing and Forecast
- 9.3.2.1.1 U.K. Interventional Imaging Market (by Offering)
- 9.3.2.1.2 U.K. Interventional Imaging Market (by Application)
- 9.3.2.1.3 U.K. Interventional Imaging Market (by End User)
- 9.3.2.1 Market Sizing and Forecast
- 9.3.3 Germany
- 9.3.3.1 Market Sizing and Forecast
- 9.3.3.1.1 Germany Interventional Imaging Market (by Offering)
- 9.3.3.1.2 Germany Interventional Imaging Market (by Application)
- 9.3.3.1.3 Germany Interventional Imaging Market (by End User)
- 9.3.3.1 Market Sizing and Forecast
- 9.3.4 France
- 9.3.4.1 Market Sizing and Forecast
- 9.3.4.1.1 France Interventional Imaging Market (by Offering)
- 9.3.4.1.2 France Interventional Imaging Market (by Application)
- 9.3.4.1.3 France Interventional Imaging Market (by End User)
- 9.3.4.1 Market Sizing and Forecast
- 9.3.5 Italy
- 9.3.5.1 Market Sizing and Forecast
- 9.3.5.1.1 Italy Interventional Imaging Market (by Offering)
- 9.3.5.1.2 Italy Interventional Imaging Market (by Application)
- 9.3.5.1.3 Italy Interventional Imaging Market (by End User)
- 9.3.5.1 Market Sizing and Forecast
- 9.3.6 Spain
- 9.3.6.1 Market Sizing and Forecast
- 9.3.6.1.1 Spain Interventional Imaging Market (by Offering)
- 9.3.6.1.2 Spain Interventional Imaging Market (by Application)
- 9.3.6.1.3 Spain Interventional Imaging Market (by End User)
- 9.3.6.1 Market Sizing and Forecast
- 9.3.7 Russia
- 9.3.7.1 Market Sizing and Forecast
- 9.3.7.1.1 Russia Interventional Imaging Market (by Offering)
- 9.3.7.1.2 Russia Interventional Imaging Market (by Application)
- 9.3.7.1.3 Russia Interventional Imaging Market (by End User)
- 9.3.7.1 Market Sizing and Forecast
- 9.3.8 Rest-of-Europe
- 9.3.8.1 Market Sizing and Forecast
- 9.3.8.1.1 Rest-of-Europe Interventional Imaging Market (by Offering)
- 9.3.8.1.2 Rest-of-Europe Interventional Imaging Market (by Application)
- 9.3.8.1.3 Rest-of-Europe Interventional Imaging Market (by End User)
- 9.3.8.1 Market Sizing and Forecast
- 9.3.1 Market Sizing and Forecast
- 9.4 Asia-Pacific
- 9.4.1 Market Sizing and Forecast
- 9.4.1.1 Asia-Pacific Interventional Imaging Market (by Offering)
- 9.4.1.2 Asia-Pacific Interventional Imaging Market (by Application)
- 9.4.1.3 Asia-Pacific Interventional Imaging Market (by End User)
- 9.4.2 Japan
- 9.4.2.1 Market Sizing and Forecast
- 9.4.2.1.1 Japan Interventional Imaging Market (by Offering)
- 9.4.2.1.2 Japan Interventional Imaging Market (by Application)
- 9.4.2.1.3 Japan Interventional Imaging Market (by End User)
- 9.4.2.1 Market Sizing and Forecast
- 9.4.3 China
- 9.4.3.1 Market Sizing and Forecast
- 9.4.3.1.1 China Interventional Imaging Market (by Offering)
- 9.4.3.1.2 China Interventional Imaging Market (by Application)
- 9.4.3.1.3 China Interventional Imaging Market (by End User)
- 9.4.3.1 Market Sizing and Forecast
- 9.4.4 Australia
- 9.4.4.1 Market Sizing and Forecast
- 9.4.4.1.1 Australia Interventional Imaging Market (by Offering)
- 9.4.4.1.2 Australia Interventional Imaging Market (by Application)
- 9.4.4.1.3 Australia Interventional Imaging Market (by End User)
- 9.4.4.1 Market Sizing and Forecast
- 9.4.5 South Korea
- 9.4.5.1 Market Sizing and Forecast
- 9.4.5.1.1 South Korea Interventional Imaging Market (by Offering)
- 9.4.5.1.2 South Korea Interventional Imaging Market (by Application)
- 9.4.5.1.3 South Korea Interventional Imaging Market (by End User)
- 9.4.5.1 Market Sizing and Forecast
- 9.4.6 India
- 9.4.6.1 Market Sizing and Forecast
- 9.4.6.1.1 India Interventional Imaging Market (by Offering)
- 9.4.6.1.2 India Interventional Imaging Market (by Application)
- 9.4.6.1.3 India Interventional Imaging Market (by End User)
- 9.4.6.1 Market Sizing and Forecast
- 9.4.7 Singapore
- 9.4.7.1 Market Sizing and Forecast
- 9.4.7.1.1 Singapore Interventional Imaging Market (by Offering)
- 9.4.7.1.2 Singapore Interventional Imaging Market (by Application)
- 9.4.7.1.3 Singapore Interventional Imaging Market (by End User)
- 9.4.7.1 Market Sizing and Forecast
- 9.4.8 Rest-of-Asia-Pacific
- 9.4.8.1 Market Sizing and Forecast
- 9.4.8.1.1 Rest-of-Asia-Pacific Interventional Imaging Market (by Offering)
- 9.4.8.1.2 Rest-of-Asia-Pacific Interventional Imaging Market (by Application)
- 9.4.8.1.3 Rest-of-Asia-Pacific Interventional Imaging Market (by End User)
- 9.4.8.1 Market Sizing and Forecast
- 9.4.1 Market Sizing and Forecast
- 9.5 Latin America
- 9.5.1 Market Sizing and Forecast
- 9.5.1.1 Latin America Interventional Imaging Market (by Offering)
- 9.5.1.2 Latin America Interventional Imaging Market (by Application)
- 9.5.1.3 Latin America Interventional Imaging Market (by End User)
- 9.5.2 Brazil
- 9.5.2.1 Market Sizing and Forecast
- 9.5.2.1.1 Brazil Interventional Imaging Market (by Offering)
- 9.5.2.1.2 Brazil Interventional Imaging Market (by Application)
- 9.5.2.1.3 Brazil Interventional Imaging Market (by End User)
- 9.5.2.1 Market Sizing and Forecast
- 9.5.3 Mexico
- 9.5.3.1 Market Sizing and Forecast
- 9.5.3.1.1 Mexico Interventional Imaging Market (by Offering)
- 9.5.3.1.2 Mexico Interventional Imaging Market (by Application)
- 9.5.3.1.3 Mexico Interventional Imaging Market (by End User)
- 9.5.3.1 Market Sizing and Forecast
- 9.5.4 Rest-of-Latin America
- 9.5.4.1 Market Sizing and Forecast
- 9.5.4.1.1 Rest-of-Latin America Interventional Imaging Market (by Offering)
- 9.5.4.1.2 Rest-of-Latin America Interventional Imaging Market (by Application)
- 9.5.4.1.3 Rest-of-Latin America Interventional Imaging Market (by End User)
- 9.5.4.1 Market Sizing and Forecast
- 9.5.1 Market Sizing and Forecast
- 9.6 Rest-of-the-World
- 9.6.1 Market Sizing and Forecast
- 9.6.1.1 Rest-of-the-World Interventional Imaging Market (by Offering)
- 9.6.1.2 Rest-of-the-World Interventional Imaging Market (by Application)
- 9.6.1.3 Rest-of-the-World Interventional Imaging Market (by End User)
- 9.6.1 Market Sizing and Forecast
10 Company Profiles
- 10.1 Interventional Imaging Ecosystem Active Players
- 10.2 Overview
- 10.2.1 Becton, Dickinson and Company
- 10.2.1.1 Role of Becton, Dickinson and Company in the Global Interventional Imaging Market
- 10.2.1.2 Recent Developments
- 10.2.1.3 Analyst Perspective
- 10.2.2 Canon Inc.
- 10.2.2.1 Role of Canon Inc. in the Global Interventional Imaging Market
- 10.2.2.2 Recent Developments
- 10.2.2.3 Analyst Perspective
- 10.2.3 Esaote SpA
- 10.2.3.1 Role of Esaote SpA in the Global Interventional Imaging Market
- 10.2.3.2 Recent Developments
- 10.2.3.3 Analyst Perspective
- 10.2.4 FUJIFILM Holdings Corporation
- 10.2.4.1 Role of FUJIFILM Holdings Corporation in the Global Interventional Imaging Market
- 10.2.4.2 Analyst Perspective
- 10.2.5 GE HealthCare
- 10.2.5.1 Role of GE HealthCare in the Global Interventional Imaging Market
- 10.2.5.2 Recent Developments
- 10.2.5.3 Analyst Perspective
- 10.2.6 Hologic, Inc.
- 10.2.6.1 Role of Hologic, Inc. in the Global Interventional Imaging Market
- 10.2.6.2 Recent Developments
- 10.2.6.3 Analyst Perspective
- 10.2.7 Intuitive Surgical, Inc.
- 10.2.7.1 Role of Intuitive Surgical, Inc. in the Global Interventional Imaging Market
- 10.2.7.2 Recent Developments
- 10.2.7.3 Analyst Perspective
- 10.2.8 Koninklijke Philips NV
- 10.2.8.1 Role of Koninklijke Philips NV in the Global Interventional Imaging Market
- 10.2.8.2 Recent Developments
- 10.2.8.3 Analyst Perspective
- 10.2.9 Medtronic plc
- 10.2.9.1 Role of Medtronic plc in the Global Interventional Imaging Market
- 10.2.9.2 Recent Developments
- 10.2.9.3 Analyst Perspective
- 10.2.10 Siemens Healthineers AG
- 10.2.10.1 Role of Siemens Healthineers AG in the Global Interventional Imaging Market
- 10.2.10.2 Recent Developments
- 10.2.10.3 Analyst Perspective
- 10.2.11 Stryker Corporation
- 10.2.11.1 Role of Stryker Corporation in the Global Interventional Imaging Market
- 10.2.11.2 Recent Developments
- 10.2.11.3 Analyst Perspective
- 10.2.12 Shimadzu Corporation
- 10.2.12.1 Role of Shimadzu Corporation in the Global Interventional Imaging Market
- 10.2.12.2 Analyst Perspective
- 10.2.13 Terumo Corporation
- 10.2.13.1 Role of Terumo Corporation in the Global Interventional Imaging Market
- 10.2.13.2 Analyst Perspective
- 10.2.13.3 Analyst Perspective
- 10.2.14 Trivitron Healthcare
- 10.2.14.1 Role of Trivitron Healthcare in the Global Interventional Imaging Market
- 10.2.14.2 Recent Developments
- 10.2.14.3 Analyst Perspective
- 10.2.1 Becton, Dickinson and Company

