|
|
市場調査レポート
商品コード
1735428
がん診断の世界市場 2025Oncology Diagnostics: Global Markets |
||||||
|
|||||||
|
|||||||

| がん診断の世界市場 2025 |
|
出版日: 2025年05月23日
発行: BCC Research
ページ情報: 英文 192 Pages
納期: 即納可能
|

全表示
- 概要
- 図表
- 目次
世界のがん診断の市場規模は、2024年の776億ドルから2029年には1,015億ドルに拡大すると見込まれており、2024年から2029年にかけてのCAGRは5.5%と予測されています。
画像診断部門の規模は、2024年の531億ドルから2029年には678億ドルに拡大すると見込まれ、同期間のCAGRは5.0%とされています。
次世代シーケンシング (NGS) 部門の規模は、2024年の28億ドルから2029年には47億ドルに達すると見込まれており、同期間のCAGRは10.7%と予測されています。
当レポートでは、世界のがん診断の市場を調査し、市場概要、市場影響因子および市場機会の分析、法規制環境、新興技術および技術開発の動向、市場規模の推移・予測、各種区分・地域別の詳細分析、競合情勢、主要企業のプロファイルなどをまとめています。
目次
第1章 エグゼクティブサマリー
- 市場見通し
- 調査範囲
- 市場サマリー
- 市場力学と成長要因
- 新興技術
- セグメント分析
- 地域分析
- 戦略的取り組み
- 総論
第2章 市場概要
- 概要
- マクロ経済要因分析
- 米中貿易戦争の影響
- ポーターのファイブフォース分析
第3章 市場力学
- 重要ポイント
- 市場促進要因
- がんの発症率の上昇
- 早期介入と予防診断スクリーニングの需要
- コンパニオン診断の導入拡大
- 世界的な高齢化
- 市場機会
- がん検診の拡大
- 先進技術へのアクセスの強化
- 市場抑制要因
- 複雑な償還政策
- がんに対する認識の欠如
- がん診断検査の費用
- がん診断のターンアラウンドタイム
- 市場の課題
- 熟練の専門家の不足
- 複雑なサンプル調製と取り扱い
第4章 規制状況
- 市場規制 (主要国・地域別)
- 米国
- 欧州
- 日本
- 中国
第5章 新興技術と開発
- 新興技術
- がん診断におけるAI
- 多発がん早期発見 (MCED)
- セラノスティクス
- デジタル病理とAIの統合
- 特許分析
- 重要ポイント
第6章 がん診断市場
- セグメント内訳
- 世界市場の洞察
- 市場内訳:製品タイプ別
- 診断画像
- 内視鏡デバイス
- 腫瘍バイオマーカー検査
- 生検デバイス
- ヘマトキシリンとエオシン
- 免疫組織化学
- インサイチューハイブリダイゼーション
- ポリメラーゼ連鎖反応
- 次世代シーケンシング
- その他
- 市場内訳:用途別
- 乳がん
- 肺がん
- 大腸がん
- 前立腺がん
- 胃がん
- その他
- 市場内訳:エンドユーザー別
- 病院、がんセンター、クリニック
- 診断画像・リファレンスラボ
- その他
- 地理的内訳
- 市場内訳:地域別
- 重要ポイント
- 北米
- 欧州
- アジア太平洋
- 南米
- 中東・アフリカ
第7章 競合情報
- 企業シェア分析
- 戦略的取り組み
第8章 がん診断市場における持続可能性:ESGの観点
- ESG:イントロダクション
- ESGパフォーマンス分析
- 環境パフォーマンス
- 社会的パフォーマンス
- ガバナンスパフォーマンス
- BCCによる総論
第9章 付録
- 調査手法
- 参考文献
- 略語
- 企業プロファイル
- ABBOTT
- AGILENT TECHNOLOGIES INC.
- BD
- BIOMERIEUX
- BIO-RAD LABORATORIES INC.
- DANAHER CORP.
- F. HOFFMANN-LA ROCHE LTD.
- GE HEALTHCARE
- ILLUMINA INC.
- KONINKLIJKE PHILIPS N.V.
- MERCK KGAA
- MYRIAD GENETICS INC.
- QIAGEN
- SIEMENS HEALTHINEERS AG
- THERMO FISHER SCIENTIFIC INC.
- ZYTOVISION GMBH
- その他の新興企業
List of Tables
- Summary Table : Global Market for Oncology Diagnostics, by Product Type, Through 2029
- Table 1 : Global Incidence of All Cancer Cases, by WHO Region, 2022-2045
- Table 2 : Global Incidence of Cancer Cases, Both Sexes, by Cancer Type, 2022
- Table 3 : Cancer Treatments Based on Specific Tests
- Table 4 : Select FDA-Approved AI-Associated/Associable-Equipped Medical Devices
- Table 5 : Selected Patent Grants in Oncology Diagnostics, 2023-2025
- Table 6 : Global Oncology Diagnostics Market, by Product Type, Through 2029
- Table 7 : Global Diagnostics Imaging Market, by Region, Through 2029
- Table 8 : Global Endoscopy Market, by Region, Through 2029
- Table 9 : Global Tumor Biomarker Tests Market, by Region, Through 2029
- Table 10 : Global Biopsy Devices Market, by Region, Through 2029
- Table 11 : Global H&E and Special Stains Diagnostics Market, by Region, Through 2029
- Table 12 : Global IHC Oncology Diagnostics Market, by Region, Through 2029
- Table 13 : Global ISH Oncology Diagnostics Market, by Region, Through 2029
- Table 14 : Global PCR Oncology Diagnostics Market, by Region, Through 2029
- Table 15 : Global NGS Oncology Diagnostics Market, by Region, Through 2029
- Table 16 : Global Other Oncology Diagnostics Tests Market, by Region, Through 2029
- Table 17 : Global Oncology Diagnostics Market, by Application, Through 2029
- Table 18 : Global Breast Cancer Diagnostics Market, by Region, Through 2029
- Table 19 : Global Lung Cancer Diagnostics Market, by Region, Through 2029
- Table 20 : Global Colorectal Cancer Diagnostics Market, by Region, Through 2029
- Table 21 : Global Prostate Cancer Diagnostics Market, by Region, Through 2029
- Table 22 : Global Gastric Cancer Diagnostics Market, by Region, Through 2029
- Table 23 : Global Oncology Diagnostics Market in Other Cancer Applications, by Region, Through 2029
- Table 24 : Global Oncology Diagnostics Market, by End User, Through 2029
- Table 25 : Global Oncology Diagnostics Market in Hospitals, Cancer Centers and Clinics, Through 2029
- Table 26 : Global Oncology Diagnostics Market in Diagnostic Imaging and Reference Laboratories, Through 2029
- Table 27 : Global Oncology Diagnostics Market in Other End Uses, Through 2029
- Table 28 : Global Oncology Diagnostics Market, by Region, Through 2029
- Table 29 : North American Oncology Diagnostics Market, by Country, Through 2029
- Table 30 : U.S. Oncology Diagnostics Market, by Product Type, Through 2029
- Table 31 : U.S. Oncology Diagnostics Market, by Application, Through 2029
- Table 32 : U.S. Oncology Diagnostics Market, by End User, Through 2029
- Table 33 : Canadian Oncology Diagnostics Market, by Product Type, Through 2029
- Table 34 : Canadian Oncology Diagnostics Market, by Application, Through 2029
- Table 35 : Canadian Oncology Diagnostics Market, by End User, Through 2029
- Table 36 : Mexican Oncology Diagnostics Market, by Product Type, Through 2029
- Table 37 : Mexican Oncology Diagnostics Market, by Application, Through 2029
- Table 38 : Mexican Oncology Diagnostics Market, by End User, Through 2029
- Table 39 : European Oncology Diagnostics Market, by Country, Through 2029
- Table 40 : Cancer Incidence and Mortality Numbers in Germany, Both Sexes, 2022
- Table 41 : German Oncology Diagnostics Market, by Product Type, Through 2029
- Table 42 : German Oncology Diagnostics Market, by Application, Through 2029
- Table 43 : German Oncology Diagnostics Market, by End User, Through 2029
- Table 44 : Cancer Incidence and Mortality Numbers in France, Both Sexes, 2022
- Table 45 : French Oncology Diagnostics Market, by Product Type, Through 2029
- Table 46 : French Oncology Diagnostics Market, by Application, Through 2029
- Table 47 : French Oncology Diagnostics Market, by End User, Through 2029
- Table 48 : New Cases of Cancer Diagnosed Each Year in the U.K., 2021
- Table 49 : The U.K. Oncology Diagnostics Market, by Product Type, Through 2029
- Table 50 : The U.K. Oncology Diagnostics Market, by Application, Through 2029
- Table 51 : The U.K. Oncology Diagnostics Market, by End User, Through 2029
- Table 52 : Cancer Incidence and Mortality Numbers in Italy, Both Sexes, 2022
- Table 53 : Italian Oncology Diagnostics Market, by Product Type, Through 2029
- Table 54 : Italian Oncology Diagnostics Market, by Application, Through 2029
- Table 55 : Italian Oncology Diagnostics Market, by End User, Through 2029
- Table 56 : Cancer Incidence and Mortality Numbers in Spain, Both Sexes, 2022
- Table 57 : Spanish Oncology Diagnostics Market, by Product Type, Through 2029
- Table 58 : Spanish Oncology Diagnostics Market, by Application, Through 2029
- Table 59 : Spanish Oncology Diagnostics Market, by End User, Through 2029
- Table 60 : Rest of European Countries' Oncology Diagnostics Market, by Product Type, Through 2029
- Table 61 : Rest of European Countries' Oncology Diagnostics Market, by Application, Through 2029
- Table 62 : Rest of European Countries' Oncology Diagnostics Market, by End User, Through 2029
- Table 63 : Asia-Pacific Oncology Diagnostics Market, by Country, Through 2029
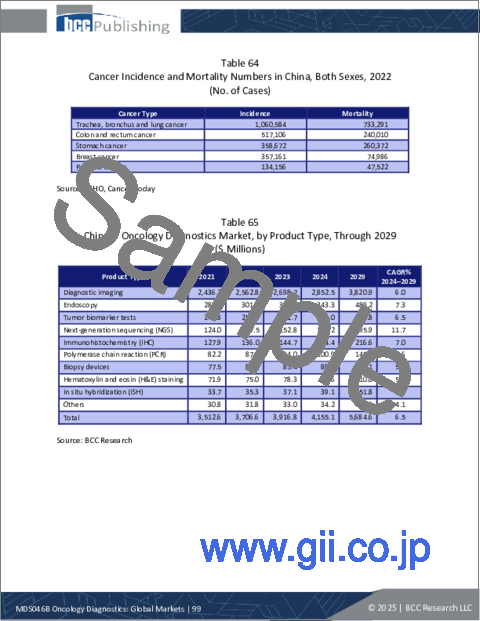
- Table 64 : Cancer Incidence and Mortality Numbers in China, Both Sexes, 2022
- Table 65 : Chinese Oncology Diagnostics Market, by Product Type, Through 2029
- Table 66 : Chinese Oncology Diagnostics Market, by Application, Through 2029
- Table 67 : Chinese Oncology Diagnostics Market, by End User, Through 2029
- Table 68 : Cancer Incidence and Mortality Numbers in Japan, Both Sexes, 2022
- Table 69 : Japanese Oncology Diagnostics Market, by Product Type, Through 2029
- Table 70 : Japanese Oncology Diagnostics Market, by Application, Through 2029
- Table 71 : Japanese Oncology Diagnostics Market, by End User, Through 2029
- Table 72 : Cancer Incidence and Mortality Numbers in India, Both Sexes, 2022
- Table 73 : Indian Oncology Diagnostics Market, by Product Type, Through 2029
- Table 74 : Indian Oncology Diagnostics Market, by Application, Through 2029
- Table 75 : Indian Oncology Diagnostics Market, by End User, Through 2029
- Table 76 : Rest of Asia-Pacific Oncology Diagnostics Market, by Product Type, Through 2029
- Table 77 : Rest of Asia-Pacific Oncology Diagnostics Market, by Application, Through 2029
- Table 78 : Rest of Asia-Pacific Oncology Diagnostics Market, by End User, Through 2029
- Table 79 : South American Oncology Diagnostics Market, by Country, Through 2029
- Table 80 : Brazilian Oncology Diagnostics Market, by Product Type, Through 2029
- Table 81 : Brazilian Oncology Diagnostics Market, by Application, Through 2029
- Table 82 : Brazilian Oncology Diagnostics Market, by End User, Through 2029
- Table 83 : Argentine Oncology Diagnostics Market, by Product Type, Through 2029
- Table 84 : Argentine Oncology Diagnostics Market, by Application, Through 2029
- Table 85 : Argentine Oncology Diagnostics Market, by End User, Through 2029
- Table 86 : Rest of South American Oncology Diagnostics Market, by Product Type, Through 2029
- Table 87 : Rest of South American Oncology Diagnostics Market, by Application, Through 2029
- Table 88 : Rest of South American Oncology Diagnostics Market, by End User, Through 2029
- Table 89 : Middle East and African Oncology Diagnostics Market, by Product Type, Through 2029
- Table 90 : Middle East and African Oncology Diagnostics Market, by Application, Through 2029
- Table 91 : Middle East and African Oncology Diagnostics Market, by End User, Through 2029
- Table 92 : Company Shares in the Oncology Diagnostics Market, 2023
- Table 93 : ESG: Environmental Overview
- Table 94 : ESG: Social Overview
- Table 95 : ESG: Governance Overview
- Table 96 : Abbreviations Used in this Report
- Table 97 : Abbott: Company Snapshot
- Table 98 : Abbott: Financial Performance, FY 2022 and 2023
- Table 99 : Abbott: Product Portfolio
- Table 100 : Agilent Technologies Inc.: Company Snapshot
- Table 101 : Agilent Technologies Inc.: Financial Performance, FY 2023 and 2024
- Table 102 : Agilent Technologies Inc.: Product Portfolio
- Table 103 : Agilent Technologies Inc.: News/Key Developments, 2024
- Table 104 : BD: Company Snapshot
- Table 105 : BD: Financial Performance, FY 2023 and 2024
- Table 106 : BD: Product Portfolio
- Table 107 : bioMerieux: Company Snapshot
- Table 108 : bioMerieux: Financial Performance, FY 2022 and 2023
- Table 109 : bioMerieux: Product Portfolio
- Table 110 : Bio-Rad Laboratories Inc.: Company Snapshot
- Table 111 : Bio-Rad Laboratories Inc.: Financial Performance, FY 2023 and 2024
- Table 112 : Bio-Rad Laboratories Inc.: Product Portfolio
- Table 113 : Danaher Corp.: Company Snapshot
- Table 114 : Danaher Corp.: Financial Performance, FY 2022 and 2023
- Table 115 : Danaher Corp.: Product Portfolio
- Table 116 : Danaher Corp.: News/Key Developments, 2023
- Table 117 : F. Hoffmann-La Roche Ltd.: Company Snapshot
- Table 118 : F. Hoffmann-La Roche Ltd.: Financial Performance, FY 2023 and 2024
- Table 119 : F. Hoffmann-La Roche Ltd.: Product Portfolio
- Table 120 : F. Hoffmann-La Roche Ltd.: News/Key Developments, 2024 and 2025
- Table 121 : GE HealthCare: Company Snapshot
- Table 122 : GE HealthCare: Financial Performance, FY 2023 and 2024
- Table 123 : GE HealthCare: Product Portfolio
- Table 124 : GE HealthCare: News/Key Developments, 2024
- Table 125 : Illumina Inc.: Company Snapshot
- Table 126 : Illumina Inc.: Financial Performance, FY 2023 and 2024
- Table 127 : Illumina Inc.: Product Portfolio
- Table 128 : Illumina Inc.: News/Key Developments, 2024
- Table 129 : Koninklijke Philips N.V.: Company Snapshot
- Table 130 : Koninklijke Philips N.V.: Financial Performance, FY 2023 and 2024
- Table 131 : Koninklijke Philips N.V.: Product Portfolio
- Table 132 : Merck KGaA: Company Snapshot
- Table 133 : Merck KGaA: Financial Performance, FY 2022 and 2023
- Table 134 : Merck KGaA: Product Portfolio
- Table 135 : Myriad Genetics Inc.: Company Snapshot
- Table 136 : Myriad Genetics Inc.: Financial Performance, FY 2022 and 2023
- Table 137 : Myriad Genetics Inc.: Product Portfolio
- Table 138 : Myriad Genetics Inc.: News/Key Developments, 2025
- Table 139 : Qiagen: Company Snapshot
- Table 140 : Qiagen: Financial Performance, FY 2022 and 2023
- Table 141 : Qiagen: Product Portfolio
- Table 142 : Siemens Healthineers AG: Company Snapshot
- Table 143 : Siemens Healthineers AG: Financial Performance, FY 2023 and 2024
- Table 144 : Siemens Healthineers AG: Product Portfolio
- Table 145 : Siemens Healthineers AG: News/Key Developments, 2024
- Table 146 : Thermo Fisher Scientific Inc.: Company Snapshot
- Table 147 : Thermo Fisher Scientific Inc.: Financial Performance, FY 2022 and 2023
- Table 148 : Thermo Fisher Scientific Inc.: Product Portfolio
- Table 149 : Thermo Fisher Scientific Inc.: News/Key Developments, 2023
- Table 150 : ZytoVision GmbH: Company Snapshot
- Table 151 : ZytoVision GmbH: Product Portfolio
- Table 152 : Emerging Startups in Oncology Diagnostics Market
List of Figures
- Summary Figure : Global Market Shares of Oncology Diagnostics, by Product Type, 2023
- Figure 1 : Porter's Five Forces Analysis of the Oncology Market
- Figure 2 : Market Dynamics of Oncology Diagnostics
- Figure 3 : Global Incidence Shares of All Cancer Cases, by Region, 2022
- Figure 4 : Number of FDA-Approved Companion Diagnostic Devices, 1997-2024
- Figure 5 : Emerging Trends and Technologies in Oncology Diagnostics
- Figure 6 : Share of Global Market for Oncology Diagnostics, by Product Type, 2023
- Figure 7 : Share of Global Market for Oncology Diagnostics, by Application, 2023
- Figure 8 : Shares of Global Market for Oncology Diagnostics, by End User, 2023
- Figure 9 : Share of Global Market for Oncology Diagnostics, by Region, 2023
- Figure 10 : Share of North American Market for Oncology Diagnostics, by Country, 2023
- Figure 11 : Share of European Market for Oncology Diagnostics, by Country, 2023
- Figure 12 : Breast Cancer Screening Rates in Europe, by Country, 2012 vs. 2022
- Figure 13 : Cervical Cancer Screening Rates in European Countries, 2022
- Figure 14 : Colorectal Cancer Screening Rates in European Countries, 2022
- Figure 15 : Current and Forecasted Cancer Prevalence in the U.K., 2020-2040
- Figure 16 : Shares of Cancer Cases in Asia and Oceania, Both Sexes, by Cancer Type, 2022
- Figure 17 : Shares of All Cancer Mortality Cases in Asia and Oceania, Both Sexes, by Cancer Type, 2022
- Figure 18 : Share of Asia-Pacific Market for Oncology Diagnostics, by Country, 2023
- Figure 19 : Share of South American Market for Oncology Diagnostics, by Country, 2023
- Figure 20 : Share of the Global Market for Oncology Diagnostics, by Company, 2023
- Figure 21 : ESG Pillars
- Figure 22 : Advantages of ESG for Companies
- Figure 23 : Abbott: Revenue Share, by Business Unit, FY 2023
- Figure 24 : Abbott: Revenue Share, by Country/Region, FY 2023
- Figure 25 : Agilent Technologies Inc.: Revenue Share, by Business Unit, FY 2024
- Figure 26 : Agilent Technologies Inc.: Revenue Share, by Country/Region, FY 2024
- Figure 27 : BD: Revenue Share, by Business Unit, FY 2024
- Figure 28 : BD: Revenue Share, by Country/Region, FY 2024
- Figure 29 : bioMerieux: Revenue Share, by Business Unit, FY 2023
- Figure 30 : bioMerieux: Revenue Share, by Region, FY 2023
- Figure 31 : Bio-Rad Laboratories Inc.: Revenue Share, by Business Unit, FY 2024
- Figure 32 : Bio-Rad Laboratories Inc.: Revenue Share, by Country/Region, FY 2024
- Figure 33 : Danaher Corp.: Revenue Share, by Business Unit, FY 2023
- Figure 34 : Danaher Corp.: Revenue Share, by Country/Region, FY 2023
- Figure 35 : F. Hoffmann-La Roche Ltd.: Revenue Share, by Business Unit, FY 2024
- Figure 36 : F. Hoffmann-La Roche Ltd.: Revenue Share, by Business Unit, FY 2024
- Figure 37 : GE HealthCare: Revenue Share, by Business Unit, FY 2024
- Figure 38 : GE HealthCare: Revenue Share, by Country/Region, FY 2024
- Figure 39 : Illumina Inc.: Revenue Share, by Business Unit, FY 2024
- Figure 40 : Illumina Inc.: Revenue Share, by Country/Region, FY 2024
- Figure 41 : Koninklijke Philips N.V.: Revenue Share, by Business Unit, FY 2024
- Figure 42 : Koninklijke Philips N.V.: Revenue Share, by Country/Region, FY 2023
- Figure 43 : Merck KGaA: Market Share, by Business Unit, 2023
- Figure 44 : Merck KGaA: Revenue Share, by Country/Region, 2023
- Figure 45 : Myriad Genetics Inc.: Revenue Share, by Business Unit, 2023
- Figure 46 : Myriad Genetics Inc.: Revenue Share, by Country/Region, 2023
- Figure 47 : Qiagen: Revenue Share, by Business Unit, FY 2023
- Figure 48 : Qiagen: Revenue Share, by Country/Region, FY 2023
- Figure 49 : Siemens Healthineers AG: Revenue Share, by Business Unit, FY 2024
- Figure 50 : Siemens Healthineers AG: Revenue Share, by Country/Region, FY 2024
- Figure 51 : Thermo Fisher Scientific Inc.: Revenue Share, by Business Unit, 2023
- Figure 52 : Thermo Fisher Scientific Inc.: Revenue Share, by Country/Region, 2023
The global market for oncology diagnostics is estimated to increase from $77.6 billion in 2024 to reach $101.5 billion by 2029, at a compound annual growth rate (CAGR) of 5.5% from 2024 through 2029.
The diagnostic imaging market for oncology diagnostics is estimated to increase from $53.1 billion in 2024 to reach $67.8 billion by 2029, at a CAGR of 5.0% from 2024 through 2029.
The next-generation sequencing (NGS) market for oncology diagnostics is estimated to increase from $2.8 billion in 2024 to reach $4.7 billion by 2029, at a CAGR of 10.7% from 2024 through 2029.
Report Scope
This report analyzes the oncology diagnostics market and the competitive landscape. The profiles of several leading companies, including their revenues, product portfolios and recent activities are also examined. The report analyzes market dynamics, including drivers, limitations, challenges and opportunities, and discusses current and potential market size. The report will enable companies in the industry to make informed decisions about the production and licensing of goods and services.
The market is divided into the following segments: diagnostic imaging, tumor biomarker tests, endoscopy, biopsy, hematoxylin and eosin (H&E) staining, immunohistochemistry (IHC), in situ hybridization (ISH), polymerase chain reaction (PCR), next generation sequencing (NGS) and others (cytology, microarrays, exosomes, flow cytometry, sanger sequencing, pyrosequencing etc.). The market is segmented by application into breast cancer, lung cancer, colorectal cancer, prostate cancer, gastric cancer and other cancers (lip, oral/cavity, liver/gallbladder, pancreas, melanoma, kidney, bladder, brain, central nervous system, thyroid, Hodgkin lymphoma, non-Hodgkin lymphoma, multiple myeloma and leukemia). By end user, the market is segmented into hospitals/cancer centers/clinics, diagnostic imaging centers/reference laboratories, and other end users (physician offices, research, academic institutes, national cancer registries and contract research organizations).
Regional market analysis is provided for North America, Europe, Asia-Pacific, South America and Middle East and Africa. The report also provides country-level analyses of markets and market segments. North America comprises the U.S., Canada and Mexico, while South America includes Brazil, Argentina and the rest of South America. In Europe, major countries covered are Germany, France, the U.K., Italy and Spain, along with the rest of Europe, which includes Switzerland, Denmark, Norway, Poland, Belgium, Austria, the Netherlands, Sweden, Russia and others. The Asia-Pacific region consists of Japan, China and India, as well as the rest of Asia-Pacific (Australia, New Zealand, Taiwan, Singapore, Malaysia, Thailand, the Philippines, South Korea, Indonesia etc.), and the Middle East and Africa.
The base year for the study is 2023, 2024 is the estimated year, with projections through 2029, including compound annual growth rates (CAGRs) for the forecast period.
Report Includes
- 94 data tables and 59 additional tables
- Analyses of global market trends for oncology diagnostics, with market revenue data from 2021 to 2024, forecasts and projected CAGRs through 2029
- Estimates of the size and growth of the global market, and a corresponding market share analysis by product type, application, end user, and region
- Facts and figures pertaining to the major market dynamics, opportunities and challenges, emerging technologies, regulations, and impacts of macroeconomic variables
- Insights derived from the Porter's Five Forces model, as well as global supply chain and PESTLE analyses
- Coverage of treatments in development for late- and early-stage oncolytic viruses, along with epidemiological information, data corresponding to cancer incidence and mortality trends
- Evaluation of recent patent activity featuring key granted and published patents
- Insights into oncology therapeutics research activity, emerging technologies, clinical trials and pipeline products
- Overview of sustainability trends and ESG developments, with emphasis on consumer attitudes, and the ESG scores and practices of leading companies
- Analysis of the industry structure, including companies' market shares and rankings, strategic alliances, M&A activity and a venture funding outlook
- Company profiles of major players within the industry, including F. Hoffmann-La Roche Ltd., Danaher Corp., Agilent Technologies Inc., Siemens Healthineers AG, and GE HealthCare
Table of Contents
Chapter 1 Executive Summary
- Market Outlook
- Scope of Report
- Market Summary
- Market Dynamics and Growth Factors
- Emerging Technologies
- Segmental Analysis
- Regional Analysis
- Strategic Initiatives
- Conclusion
Chapter 2 Market Overview
- Overview
- Macroeconomic Factors Analysis
- Impact of the U.S.-China Trade War
- Porter's Five Forces Analysis in the Oncology Market
- Potential of New Entrants (Moderate to Low)
- Bargaining Power of Suppliers (Moderate to High)
- Bargaining Power of Buyers (Moderate to High)
- Threat of Substitute Products or Services (Low)
- Industry Rivalry (High)
Chapter 3 Market Dynamics
- Key Takeaways
- Market Drivers
- Rising Incidence of Cancer Cases
- Demand for Earlier Intervention and Preventive Diagnostic Screening
- Growing Adoption of Companion Diagnostics
- Increasing Aging Population Worldwide
- Market Opportunities
- Expanding Cancer Screening
- Enhancing Access to Advanced Technologies
- Market Restraints
- Complex Reimbursement Policies
- Lack of Cancer Awareness
- Cost of Oncology Diagnostic Tests
- Turnaround Time of Oncology Diagnostics
- Market Challenges
- Lack of Skilled Professionals
- Complex Sample Preparation and Handling
Chapter 4 Regulatory Landscape
- Market Regulations, by Top Country/Region
- The U.S.
- Europe
- Japan
- China
Chapter 5 Emerging Technologies and Developments
- Emerging Technologies
- AI in Oncology Diagnostics
- Multi-Cancer Early Detection (MCED)
- Theranostics
- Digital Pathology and AI Integration
- Patent Analysis
- Key Takeaways
Chapter 6 Oncology Diagnostics Market
- Segment Breakdown
- Global Market Insights
- Market Breakdown by Product Type
- Diagnostics Imaging
- Endoscopy Devices
- Tumor Biomarker Tests
- Biopsy Devices
- Hematoxylin and Eosin
- Immunohistochemistry
- In situ Hybridization
- Polymerase Chain Reaction
- Next-Generation Sequencing
- Others
- Market Breakdown by Application
- Breast Cancer
- Lung Cancer
- Colorectal Cancer
- Prostate Cancer
- Gastric Cancer
- Other Applications
- Market Breakdown by End User
- Hospitals, Cancer Centers and Clinics
- Diagnostic Imaging and Reference Laboratories
- Others
- Geographic Breakdown
- Market Breakdown, by Region
- Key Takeaways
- North America
- Europe
- Asia-Pacific
- South America
- Middle East and Africa (MEA)
Chapter 7 Competitive Intelligence
- Company Share Analysis
- Strategic Initiatives
Chapter 8 Sustainability in the Market for Oncology Diagnostics: An ESG Perspective
- Introduction to ESG
- ESG Performance Analysis
- Environmental Performance
- Social Performance
- Governance Performance
- Concluding Remarks from BCC
Chapter 9 Appendix
- Research Methodology
- References
- Abbreviations
- Company Profiles
- ABBOTT
- AGILENT TECHNOLOGIES INC.
- BD
- BIOMERIEUX
- BIO-RAD LABORATORIES INC.
- DANAHER CORP.
- F. HOFFMANN-LA ROCHE LTD.
- GE HEALTHCARE
- ILLUMINA INC.
- KONINKLIJKE PHILIPS N.V.
- MERCK KGAA
- MYRIAD GENETICS INC.
- QIAGEN
- SIEMENS HEALTHINEERS AG
- THERMO FISHER SCIENTIFIC INC.
- ZYTOVISION GMBH
- Other Emerging Players in the Oncology Diagnostics Market

