|
|
市場調査レポート
商品コード
1642864
二酸化炭素除去 (CDR) の世界市場Global Carbon Dioxide Removals (CDR) Market |
||||||

|
|||||||
|
|||||||

| 二酸化炭素除去 (CDR) の世界市場 |
|
出版日: 2025年01月14日
発行: BCC Research
ページ情報: 英文 131 Pages
納期: 即納可能
|

全表示
- 概要
- 図表
- 目次
世界の二酸化炭素除去 (CDR) の市場規模は、2024年の34億米ドルから、予測期間中はCAGR 49.0%で推移し、2029年には250億米ドルに達すると予測されています。
北米市場は、2024年の16億米ドルから、予測期間中はCAGR 48.4%で推移し、2029年には112億米ドルに達すると予測されています。欧州・中東・アフリカ市場は、2024年の9億670万米ドルから、CAGR 51.8%で推移し、2029年には73億米ドルに達すると予測されます。
当レポートでは、世界の二酸化炭素除去 (CDR) の市場を調査し、市場概要、市場影響因子および市場機会の分析、法規制環境、新興技術および技術開発の動向、市場規模の推移・予測、各種区分・地域別の詳細分析、競合情勢、主要企業のプロファイルなどをまとめています。
目次
第1章 エグゼクティブサマリー
- 市場見通し
- 調査範囲
- 市場概要
第2章 市場概要
- 概要
- ポーターのファイブフォース分析
- バリューチェーン分析:CDR
- CDRのSWOT分析
- 気候変動政策と規制
第3章 市場力学
- 市場力学スナップショット
- 市場促進要因
- 炭素除去プロジェクトへの政府資金
- より厳しい炭素規制の影響
- 市場の課題
- CDRにおけるガバナンスギャップ
- CDR取引の非開示
- 技術進歩の欠如
- 市場機会
- CCUSの需要の増加
- 市場抑制要因
- 炭素集約型プロジェクトに対する金融機関の支援
- コストと技術的な問題によるプロジェクトの停止
第4章 新興技術と開発
- 概要
- CDRスタートアップ企業の台頭
- ハイブリッドDAC技術 (HDAC)
- 電気スイング吸着
- 水分スイング吸着
- 膜分離 (m-DAC)
- 藻類由来バイオ炭
第5章 市場セグメンテーション分析
- セグメンテーションの内訳
- 市場分析:技術別
- BECCS
- DAC
- バイオ炭
- 風化促進法/鉱物化
- その他のCDR技術
- 市場分析:カーボンクレジットバイヤー別
- 金融
- 技術
- その他
- 地理的内訳
- 市場分析:地域別
- 北米
- 欧州・中東・アフリカ
- アジア太平洋
- 南米
第6章 競合情報
- 概要
第7章 付録
- 調査手法
- 情報源
- 参考文献
- 報告書で使用されている略語
- 企業プロファイル
- APERAM BIOENERGIA
- ARCA
- BUSSME ENERGY AB
- CARBOFEX LTD.
- CARBON ENGINEERING ULC.
- CARBONFREE
- CARBFIX HF.
- CELLA MINERAL STORAGE INC.
- CLIMEWORKS
- EBB CARBON INC.
- EXOMAD GREEN
- GLOBAL THERMOSTAT (ZERO CARBON SYSTEMS)
- NOVOCARBO GMBH
- NEUSTARK AG
- ORSTED A/S
- PACIFIC BIOCHAR BENEFIT CORP.
- STOCKHOLM EXERGI AB
- WAKEFIELD BIOCHAR
List of Tables
- Summary Table : Global CDR Market, by Region, Through 2029
- Table 1 : Global CDR Market, by Value and Volume, Through 2029
- Table 2 : Carbon Tax, by Region/Country, 2023
- Table 3 : Comparison of Emerging DAC Technologies
- Table 4 : Comparison of CDR Technologies
- Table 5 : Global CDR Market, by Technology, Through 2029
- Table 6 : Global Market Volume for CDR, by Technology, Through 2029
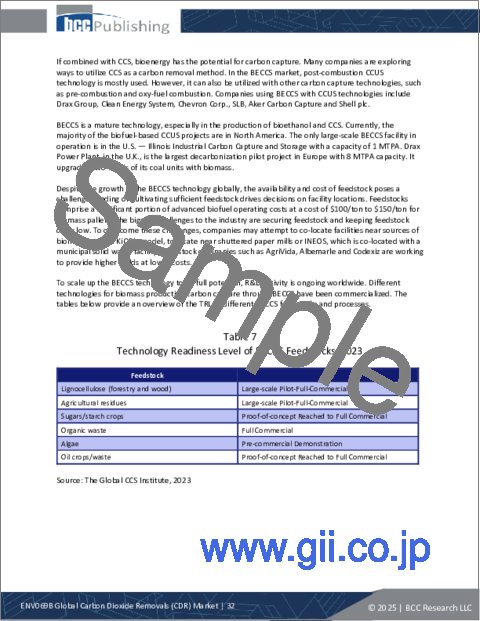
- Table 7 : Technology Readiness Level of BECCS Feedstocks, 2023
- Table 8 : Technology Readiness Level of BECCS Production Processes, 2023
- Table 9 : Operational BECCS Projects, 2023
- Table 10 : Global BECCS CDR Market, by Region, Through 2029
- Table 11 : Global BECCS CDR Market Volume, by Region, Through 2029
- Table 12 : Comparison of Commercialized DAC Technologies
- Table 13 : Energy Sources of Commercialized DAC Technologies
- Table 14 : Cost Comparison of Renewable Energy Sources for DAC Plants
- Table 15 : Operational DAC Plants, 2023
- Table 16 : Global DAC CDR Market, by Region, Through 2029
- Table 17 : Global DAC CDR Market Volume, by Region, Through 2029
- Table 18 : Recent Developments in the Biochar CDR Market, 2022-2024
- Table 19 : Global Biochar CDR Market, by Region, Through 2029
- Table 20 : Global Biochar CDR Market Volume, by Region, Through 2029
- Table 21 : Leading Suppliers of Enhanced Weathering/Mineralization-based CDR, 2023
- Table 22 : Global Enhanced Weathering/Carbon Mineralization CDR Market, by Region, Through 2029
- Table 23 : Global Enhanced Weathering/Carbon Mineralization CDR Market Volume, by Region, Through 2029
- Table 24 : Methods for Enhancing Ocean Alkalinity
- Table 25 : Global Market for Other CDR Technologies, by Region, Through 2029
- Table 26 : Global Market Volume for Other CDR Technologies, by Region, Through 2029
- Table 27 : Global CDR Market, by Carbon Credit Buyer, Through 2029
- Table 28 : Financial Companies with the Most CDR Purchases, 2023
- Table 29 : Global CDR Market for Finance Sector, by Region, Through 2029
- Table 30 : Global CDR Market for Technology Sector, by Region, Through 2029
- Table 31 : Global CDR Market for Other Sectors, by Region, Through 2029
- Table 32 : Global CDR Market, by Region, Through 2029
- Table 33 : Global Market Volume for CDR, by Region, Through 2029
- Table 34 : Recent Developments in the North American CDR Market, 2023-2024
- Table 35 : North American CDR Market, by Technology, Through 2029
- Table 36 : North American Market Volume for CDR, by Technology, Through 2029
- Table 37 : North American CDR Market, by Carbon Credit Buyer, Through 2029
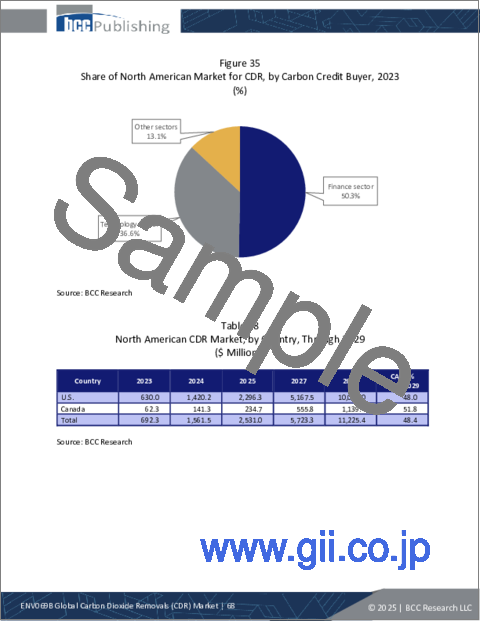
- Table 38 : North American CDR Market, by Country, Through 2029
- Table 39 : Carbon Pricing Revenue, by Instrument, 2023
- Table 40 : CDR Developments in the MEA Region, 2023-2024
- Table 41 : EMEA CDR Market, by Technology, Through 2029
- Table 42 : EMEA Market Volume for CDR, by Technology, Through 2029
- Table 43 : EMEA Market for CDR, by Carbon Credit Buyer, Through 2029
- Table 44 : EMEA Market for CDR, by Country, Through 2029
- Table 45 : APAC CDR Market, by Technology, Through 2029
- Table 46 : APAC Market Volume for CDR, by Technology, Through 2029
- Table 47 : APAC CDR Market, by Carbon Credit Buyer, Through 2029
- Table 48 : APAC Market for CDR, by Country, Through 2029
- Table 49 : Recent Developments in the South American CDR Market, 2022-2024
- Table 50 : South American Market for CDR, by Technology, Through 2029
- Table 51 : South American Market Volume for CDR, by Technology, Through 2029
- Table 52 : South American Market for CDR, by Carbon Credit Buyer, Through 2029
- Table 53 : South American Market for CDR, by Country, Through 2029
- Table 54 : Leading DAC Technology Companies
- Table 55 : Company Shares Based on DAC Projects
- Table 56 : Abbreviations Used in This Report
- Table 57 : Aperam BioEnergia: Company Snapshot
- Table 58 : Aperam BioEnergia: Product Portfolio
- Table 59 : Aperam BioEnergia: News/Key Developments, 2024
- Table 60 : ARCA: Company Snapshot
- Table 61 : ARCA: Product Portfolio
- Table 62 : ARCA: News/Key Developments, 2023-2024
- Table 63 : Bussme Energy AB: Company Snapshot
- Table 64 : Bussme Energy AB: Product Portfolio
- Table 65 : Carbofex Ltd.: Company Snapshot
- Table 66 : Carbofex Ltd.: Product Portfolio
- Table 67 : Carbofex Ltd.: News/Key Developments, 2022
- Table 68 : Carbon Engineering ULC.: Company Snapshot
- Table 69 : Carbon Engineering ULC.: Product Portfolio
- Table 70 : Carbon Engineering ULC.: News/Key Developments, 2022-2024
- Table 71 : CarbonFree: Company Snapshot
- Table 72 : CarbonFree: Product Portfolio
- Table 73 : CarbonFree: News/Key Developments, 2021-2024
- Table 74 : Carbfix hf.: Company Snapshot
- Table 75 : Carbfix hf.: Product Portfolio
- Table 76 : Carbfix hf.: News/Key Developments, 2023-2024
- Table 77 : Cella Mineral Storage Inc.: Company Snapshot
- Table 78 : Cella Mineral Storage Inc.: Product Portfolio
- Table 79 : Cella Mineral Storage Inc.: News/Key Developments, 2023-2024
- Table 80 : Climeworks: Company Snapshot
- Table 81 : Climeworks: Product Portfolio
- Table 82 : Climeworks: News/Key Developments, 2022-2024
- Table 83 : Ebb Carbon Inc.: Company Snapshot
- Table 84 : Ebb Carbon Inc.: Product Portfolio
- Table 85 : Ebb Carbon Inc.: News/Key Developments, 2021-2024
- Table 86 : Exomad Green: Company Snapshot
- Table 87 : Exomad Green: Product Portfolio
- Table 88 : Exomad Green: News/Key Developments, 2024
- Table 89 : Global Thermostat (Zero Carbon Systems): Company Snapshot
- Table 90 : Global Thermostat (Zero Carbon Systems): Product Portfolio
- Table 91 : Global Thermostat (Zero Carbon Systems): News/Key Developments, 2023-2024
- Table 92 : Novocarbo GmbH: Company Snapshot
- Table 93 : Novocarbo GmbH: Product Portfolio
- Table 94 : Novocarbo GmbH: News/Key Developments, 2024
- Table 95 : neustark AG: Company Snapshot
- Table 96 : neustark AG: Product Portfolio
- Table 97 : neustark AG: News/Key Developments, 2023 and 2024
- Table 98 : Orsted A/S: Company Snapshot
- Table 99 : Orsted A/S: Financial Performance, FY 2022 and 2023
- Table 100 : Orsted A/S: Product Portfolio
- Table 101 : Orsted A/S: News/Key Developments, 2023-2024
- Table 102 : Pacific Biochar Benefit Corp.: Company Snapshot
- Table 103 : Pacific Biochar Benefit Corp.: Product Portfolio
- Table 104 : Pacific Biochar Benefit Corp.: News/Key Developments, 2021-2024
- Table 105 : Stockholm Exergi AB: Company Snapshot
- Table 106 : Stockholm Exergi AB: Financial Performance, FY 2022 and 2023
- Table 107 : Stockholm Exergi AB: Product Portfolio
- Table 108 : Stockholm Exergi AB: News/Key Developments, 2023-2024
- Table 109 : Wakefield BioChar: Company Snapshot
- Table 110 : Wakefield BioChar: Product Portfolio
- Table 111 : Wakefield BioChar: News/Key Developments, 2021-2023
List of Figures
- Summary Figure : Global CDR Market, by Region, 2023-2029
- Figure 1 : Porter's Five Forces Analysis of the CDR Market
- Figure 2 : Value Chain Analysis of CDR with BECCS
- Figure 3 : Value Chain Analysis of CDR with Enhanced Mineralization Technology
- Figure 4 : Value Chain Analysis of CDR with Ocean Alkalinization Technology
- Figure 5 : SWOT Analysis - CDR
- Figure 6 : CDR Market Dynamics
- Figure 7 : Energy-Related CO2 Emissions, 2019-2023
- Figure 8 : Schematic of Avnos' HDAC Technology
- Figure 9 : DAC Commercialized and Emerging Technologies
- Figure 10 : Technologies to Produce Algal Biomass
- Figure 11 : Share of Global CDR Market, by Technology, 2023
- Figure 12 : Share of Market Volume for CDR, by Technology, 2023
- Figure 13 : Schematic Diagram of BECCS
- Figure 14 : Share of Global BECCS CDR Market, by Region, 2023
- Figure 15 : Share of Global BECCS CDR Market Volume, by Region, 2023
- Figure 16 : Schematic Diagram of DAC Plant
- Figure 17 : Share of Global DAC CDR Market, by Region, 2023
- Figure 18 : Share of Global DAC CDR Market Volume, by Region, 2023
- Figure 19 : Share of Global Biochar CDR Market, by Region, 2023
- Figure 20 : Share of Global Biochar CDR Market Volume, by Region, 2023
- Figure 21 : Share of Global Enhanced Weathering/Carbon Mineralization CDR Market, by Region, 2023
- Figure 22 : Share of Global Enhanced Weathering/Carbon Mineralization CDR Market Volume, by Region, 2023
- Figure 23 : Ocean-based CDR Methods
- Figure 24 : Categorization of OAE-based Approaches
- Figure 25 : Share of Global Market for Other CDR Technologies, by Region, 2023
- Figure 26 : Share of Global Market Volume for Other CDR Technologies, by Region, 2023
- Figure 27 : Share of Global CDR Market, by Carbon Credit Buyer, 2023
- Figure 28 : Share of CDR Market for Finance Sector, by Region, 2023
- Figure 29 : Share of CDR Market for Technology Sector, by Region, 2023
- Figure 30 : Share of Global CDR Market for Other Sectors, by Region, 2023
- Figure 31 : Share of Global CDR Market, by Region, 2023
- Figure 32 : Share of Market Volume for CDR, by Region, 2023
- Figure 33 : Share of North American Market for CDR, by Technology, 2023
- Figure 34 : Share of North American Market Volume for CDR, by Technology, 2023
- Figure 35 : Share of North American Market for CDR, by Carbon Credit Buyer, 2023
- Figure 36 : Share of North American Market for CDR, by Country, 2023
- Figure 37 : Share of EMEA Market for CDR, by Technology, 2023
- Figure 38 : Share of Market Volume for CDR, by Technology, 2023
- Figure 39 : Share of EMEA Market for CDR, by Carbon Credit Buyer, 2023
- Figure 40 : Share of EMEA Market for CDR, by Country, 2023
- Figure 41 : Share of APAC CDR Market, by Technology, 2023
- Figure 42 : Share of Market Volume for CDR, by Technology, 2023
- Figure 43 : Share of APAC Market for CDR, by Carbon Credit Buyer, 2023
- Figure 44 : Share of APAC Market for CDR, by Country, 2023
- Figure 45 : Share of South American Market for CDR, by Technology, 2023
- Figure 46 : Share of South American Market Volume for CDR, by Technology, 2023
- Figure 47 : Share of South American Market for CDR, by Carbon Credit Buyer, 2023
- Figure 48 : Share of South American Market for CDR, by Country, 2023
- Figure 49 : Company Share Analysis of BECCS CDR Industry, 2023
- Figure 50 : Orsted A/S: Revenue Share, by Business Unit, FY 2023
- Figure 51 : Orsted A/S: Revenue Share, by Country/Region, FY 2023
- Figure 52 : Stockholm Exergi AB: Revenue Share, by Business Unit, FY 2023
The global carbon dioxide removal (CDR) market is expected to grow from $3.4 billion in 2024 to $25.0 billion by 2029, at a compound annual growth rate (CAGR) of 49.0% from 2024 through 2029.
The North American CDR market is expected to grow from $1.6 billion in 2024 to $11.2 billion by 2029, at a CAGR of 48.4% from 2024 through 2029.
The EMEA CDR market is expected to grow from $906.7 million in 2024 to $7.3 billion by 2029, at a CAGR of 51.8% from 2024 through 2029.
Report Scope
This report on the global carbon dioxide removal (CDR) market segments the market by technology type, carbon credit buyers, and regions. The market size is provided in value ($ millions) and volume (thousand tons). The report also discusses competitive intelligence, analyzing companies based on their product offerings and revenues generated from the CDR business. It also details market dynamics, emerging technologies, and global developments in the industry.
In this report, CDR technologies include land- and ocean-based technologies such as biochar, direct air capture (DAC), bioenergy carbon capture and sequestration (BECCS), and ocean alkalinization. However, carbon capture, utilization, and storage (CCUS) technologies such as post-combustion, pre-combustion, and oxy-fuel combustion are outside the scope of the report.
Report Includes
- 40 data tables and 82 additional tables
- Analysis of trends in the global market for carbon dioxide removals (CDR), featuring revenue data for 2023, estimated figures for 2024, forecasts for 2025 and 2027, and projections of compound annual growth rates (CAGRs) through 2029
- Estimates of the current market size and revenue growth prospects, accompanied by a market share analysis by technology type, carbon credit buyer and geographical region
- Coverage of technological advances in CDR technologies and the current and future market potential, as well as an analysis of the regulatory framework and reimbursement scenarios
- Market share analysis of the key companies in the industry and coverage of mergers and acquisitions, joint ventures, collaborations and partnerships
- Profiles of the leading market participants, including Aperam BioEnergia, Climeworks AG, Carbofex Ltd., Carbon Engineering ULC., and Exomad Green
Table of Contents
Chapter 1 Executive Summary
- Market Outlook
- Scope of Report
- Market Summary
Chapter 2 Market Overview
- Overview
- Porter's Five Forces Analysis
- Bargaining Power of Buyers
- Bargaining Power of Suppliers
- Potential for New Entrants
- Threat of Substitutes
- Competition in the Industry
- Value Chain Analysis: CDR
- Overview
- SWOT Analysis of CDR
- Climate Change Policies and Regulations
- Carbon Pricing
- Paris Agreement
- United States
- Europe
- Climate Target Policies
Chapter 3 Market Dynamics
- Market Dynamics Snapshot
- Market Drivers
- Government Funding for Carbon Removal Projects
- Impact of Stricter Carbon Regulations
- Market Challenges
- Governance Gap in CDRs
- Non-Disclosure of CDR Deals
- Lack of Technological Advances
- Market Opportunities
- Increasing Demand for CCUS
- Market Restraints
- Support from financial institutions for carbon-intensive projects
- Project shutdowns due to cost and technical issues
Chapter 4 Emerging Technologies and Developments
- Overview
- CDR Start-ups on the Rise
- Hybrid DAC Technology (HDAC)
- Electro-swing Adsorption
- Moisture-swing Adsorption
- Membrane-based Separation (m-DAC)
- Algae-based Biochar
Chapter 5 Market Segmentation Analysis
- Segmentation Breakdown
- Market Analysis by Technology
- BECCS
- DAC
- Biochar
- Enhanced Weathering/Mineralization
- Other CDR Technologies
- Market Analysis by Carbon Credit Buyer
- Finance Sector
- Technology Sector
- Other Sectors
- Geographic Breakdown
- Market Analysis by Region
- North America
- EMEA
- APAC
- South America
Chapter 6 Competitive Intelligence
- Overview
Chapter 7 Appendix
- Methodology
- Information Sources
- References
- Abbreviations Used in the Report
- Company Profiles
- APERAM BIOENERGIA
- ARCA
- BUSSME ENERGY AB
- CARBOFEX LTD.
- CARBON ENGINEERING ULC.
- CARBONFREE
- CARBFIX HF.
- CELLA MINERAL STORAGE INC.
- CLIMEWORKS
- EBB CARBON INC.
- EXOMAD GREEN
- GLOBAL THERMOSTAT (ZERO CARBON SYSTEMS)
- NOVOCARBO GMBH
- NEUSTARK AG
- ORSTED A/S
- PACIFIC BIOCHAR BENEFIT CORP.
- STOCKHOLM EXERGI AB
- WAKEFIELD BIOCHAR
