|
|
市場調査レポート
商品コード
1621141
バイオプロセス最適化とデジタルバイオマニュファクチャリング:世界市場Bioprocess Optimization and Digital Bio-manufacturing: Global Markets |
||||||
|
|||||||
|
|||||||

| バイオプロセス最適化とデジタルバイオマニュファクチャリング:世界市場 |
|
出版日: 2024年12月20日
発行: BCC Research
ページ情報: 英文 180 Pages
納期: 即納可能
|

全表示
- 概要
- 図表
- 目次
世界のバイオプロセス最適化とデジタルバイオマニュファクチャリングの市場規模は、2024年の243億米ドルから、予測期間中はCAGR 10.2%で推移し、2029年末には396億米ドルに達すると予測されています。
北米市場は、2024年の90億米ドルから、予測期間中はCAGR 10.0%で推移し、2029年末には145億米ドルに達すると予測されています。欧州市場は、2024年の72億米ドルから、CAGR 9.7%で推移し、2029年末には115億米ドルに達すると予測されます。
当レポートでは、世界のバイオプロセス最適化とデジタルバイオマニュファクチャリングの市場を調査し、市場概要、市場影響因子および市場機会の分析、法規制環境、新興技術および技術開発の動向、市場規模の推移・予測、各種区分・地域別の詳細分析、競合情勢、主要企業のプロファイルなどをまとめています。
目次
第1章 エグゼクティブサマリー
- 市場見通し
- 調査範囲
- 市場分析
第2章 市場概要
- 概要
- 技術背景
- 生物製剤製造プロセス
- 上流処理
- 細胞の採取と精製
- 下流処理
- バイオプロセス最適化
- インダストリー4.0:デジタルバイオ製造
第3章 市場力学
- 世界の市場力学
- 市場促進要因
- 高齢化人口の増加
- 慢性疾患の増加
- バイオ医薬品の需要がかつてないほど増加
- 製品発売数の増加
- 契約製造組織 (CMO) の増加
- 市場抑制要因
- 熟練労働者の不足
- 設備コストが高い
- 調和されていないスマート製造標準
- 市場機会
- 有利な政府プログラム
- センサー技術の進歩
- プロセス分析技術の取り組み
- 市場の課題
- 技術的な問題とサイバー攻撃の脅威
- 規制状況
- 適正自動化製造規範 (GAMP)
- ISA (Instrumentation, Systems, and Automation) Society:88・95標準
第4章 新興技術と開発
- 新たな動向と技術
- 連続バイオプロセス
- 連続細胞保持技術
- 連続クロマトグラフィー
- 使い捨て技術
第5章 市場セグメンテーション分析
- 主要な市場動向
- セグメンテーションの内訳
- 市場分析:技術別
- 製造技術
- 分析およびプロセス制御技術
- ソフトウェア
- 市場分析:用途別
- バイオ製造プロセスの自動化と制御
- フレキシブル製造
- バイオプロセス最適化とプロセス分析
- その他
- 市場分析:分子タイプ別
- モノクローナル抗体 (mAbs)
- 治療用タンパク質とペプチド
- ワクチン
- 細胞および遺伝子治療
- 地理的内訳
- 市場分析:地域別
- 北米
- 欧州
- アジア太平洋
- その他の地域
第6章 競合情報
- 主要企業のランキング
- 企業の採用した主要戦略
- コラボレーションとパートナーシップ
- 拡大
- 買収
- 新製品の発売
第7章 バイオプロセス最適化とデジタルバイオ製造市場における持続可能性:ESGの観点
- ESG:イントロダクション
- 業界におけるESGの実践
- 環境パフォーマンス
- 社会的パフォーマンス
- ガバナンスパフォーマンス
- 企業のESGリスク評価
- BCCによる総論
第8章 付録
- 調査手法
- 情報源
- 参考文献
- 略語
- 企業プロファイル
- AGILENT TECHNOLOGIES INC.
- AGILITECH
- BIO-RAD LABORATORIES INC.
- BRUKER
- CLEAN BIOLOGICS
- DANAHER CORP.
- EMERSON ELECTRIC CO.
- EPPENDORF SE
- KORBER AG
- MERCK KGAA
- SARTORIUS AG
- SHIMADZU CORP.
- THERMO FISHER SCIENTIFIC INC.
- UNIVERCELLS TECHNOLOGIES
- WATERS CORP.
List of Tables
- Summary Table A : Global Market for Bioprocess Optimization and Digital Biomanufacturing, by Technology, Through 2029
- Summary Table B : Global Market for Bioprocess Optimization and Digital Biomanufacturing, by Region, Through 2029
- Table 1 : List of Biologics Produced in E. coli
- Table 2 : List of Biologics Produced in Mammalian Cells
- Table 3 : Number and Distribution of Persons Aged 60+, by Region, 2019 and 2050
- Table 4 : Global Cancer Incidence and Mortality Cases, by WHO Region, 2022
- Table 5 : Medicine Regulators and Biosimilar Approvals, 2024
- Table 6 : List of Regulatory Guidelines Related to Biopharmaceutical Manufacturing, 2024
- Table 7 : Examples of Continuous Processing Developments
- Table 8 : Global Market for Bioprocess Optimization and Digital Biomanufacturing, by Technology, Through 2029
- Table 9 : Global Market for Manufacturing Technologies in Bioprocess Optimization and Digital Biomanufacturing, by Type, Through 2029
- Table 10 : Global Market for Manufacturing Technologies in Bioprocess Optimization and Digital Biomanufacturing, by Region, Through 2029
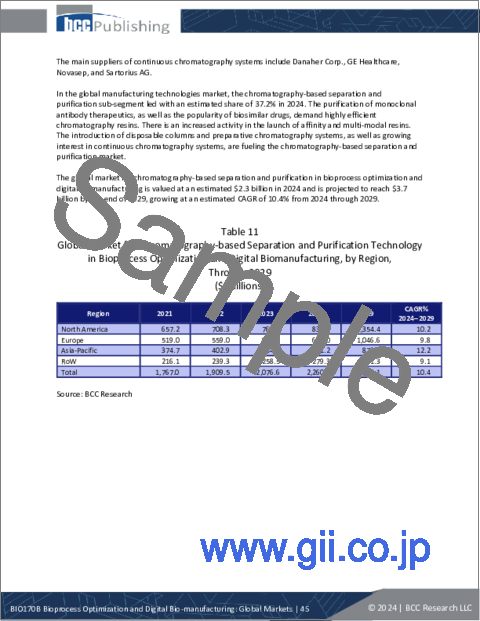
- Table 11 : Global Market for Chromatography-based Separation and Purification Technology in Bioprocess Optimization and Digital Biomanufacturing, by Region, Through 2029
- Table 12 : Global Market for Filtration Technology in Bioprocess Optimization and Digital Biomanufacturing, by Region, Through 2029
- Table 13 : Global Market for Bioreactor Technology in Bioprocess Optimization and Digital Biomanufacturing, by Region, Through 2029
- Table 14 : Global Market for Centrifugation Technology in Bioprocess Optimization and Digital Biomanufacturing, by Region, Through 2029
- Table 15 : Global Market for Analytical and Process Control Technologies in Bioprocess Optimization and Digital Biomanufacturing, by Type, Through 2029
- Table 16 : Global Market for Analytical and Process Control Technologies in Bioprocess Optimization and Digital Biomanufacturing, by Region, Through 2029
- Table 17 : Global Market for Spectrophotometry in Bioprocess Optimization and Digital Biomanufacturing, by Region, Through 2029
- Table 18 : Global Market for Automation and Industrial Process Control Technologies in Bioprocess Optimization and Digital Biomanufacturing, by Region Through 2029
- Table 19 : Global Market for Analytical Chromatography in Bioprocess Optimization and Digital Biomanufacturing, by Region, Through 2029
- Table 20 : Global Market for Sensors and Probes in Bioprocess Optimization and Digital Biomanufacturing, by Region, Through 2029
- Table 21 : Global Market for Software in Bioprocess Optimization and Digital Biomanufacturing, by Type, Through 2029
- Table 22 : Global Market for Software in Bioprocess Optimization and Digital Biomanufacturing, by Region, Through 2029
- Table 23 : Global Market for Industrial Control and Automation Software in Bioprocess Optimization and Digital Biomanufacturing, by Region, Through 2029
- Table 24 : Global Market for Bioprocess Optimization and Data Analytics Software in Bioprocess Optimization and Digital Biomanufacturing, by Region, Through 2029
- Table 25 : Global Market for Other Software Types in Bioprocess Optimization and Digital Biomanufacturing, by Region, Through 2029
- Table 26 : Global Market for Bioprocess Optimization and Digital Biomanufacturing, by Application, Through 2029
- Table 27 : Global Market for Biomanufacturing Process Automation and Control Applications in Bioprocess Optimization and Digital Biomanufacturing, by Region, Through 2029
- Table 28 : Global Market for Flexible Manufacturing Applications in Bioprocess Optimization and Digital Biomanufacturing, by Region, Through 2029
- Table 29 : Global Market for Bioprocess Optimization and Process Analytics Applications in Bioprocess Optimization and Digital Biomanufacturing, by Region, Through 2029
- Table 30 : Global Market for Other Applications in Bioprocess Optimization and Digital Biomanufacturing, by Region, Through 2029
- Table 31 : Global Market for Bioprocess Optimization and Digital Biomanufacturing , by Molecule Type, Through 2029
- Table 32 : Global Market of Monoclonal Antibodies in Bioprocess Optimization and Digital Biomanufacturing, by Region, Through 2029
- Table 33 : Global Market for Therapeutic Proteins and Peptides in Bioprocess Optimization and Digital Biomanufacturing, by Region, Through 2029
- Table 34 : Global Market for Vaccines in Bioprocess Optimization and Digital Biomanufacturing, by Region, Through 2029
- Table 35 : Global Market for Cell and Gene Therapies in Bioprocess Optimization and Digital Biomanufacturing, by Region, Through 2029
- Table 36 : Global Market for Bioprocess Optimization and Digital Biomanufacturing, by Region, Through 2029
- Table 37 : North American Market for Bioprocess Optimization and Digital Biomanufacturing, by Technology, Through 2029
- Table 38 : North American Market for Bioprocess Optimization and Digital Biomanufacturing, by Type of Manufacturing Technology, Through 2029
- Table 39 : North American Market for Bioprocess Optimization and Digital Biomanufacturing, by Type of Analytical and Process Control Technology, Through 2029
- Table 40 : North American Market for Bioprocess Optimization and Digital Biomanufacturing, by Type of Software, Through 2029
- Table 41 : North American Market for Bioprocess Optimization and Digital Biomanufacturing, by Application, Through 2029
- Table 42 : North American Market for Bioprocess Optimization and Digital Biomanufacturing, by Molecule Type, Through 2029
- Table 43 : European Market for Bioprocess Optimization and Digital Biomanufacturing, by Technology, Through 2029
- Table 44 : European Market for Bioprocess Optimization and Digital Biomanufacturing, by Type of Manufacturing Technology, Through 2029
- Table 45 : European Market for Bioprocess Optimization and Digital Biomanufacturing, by Type of Analytical and Process Control Technology, Through 2029
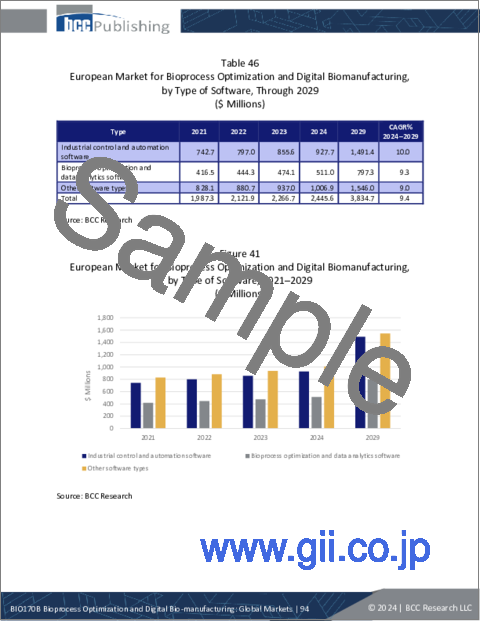
- Table 46 : European Market for Bioprocess Optimization and Digital Biomanufacturing, by Type of Software, Through 2029
- Table 47 : European Market for Bioprocess Optimization and Digital Biomanufacturing, by Application, Through 2029
- Table 48 : European Market for Bioprocess Optimization and Digital Biomanufacturing, by Molecule Type, Through 2029
- Table 49 : Asia-Pacific Market for Bioprocess Optimization and Digital Biomanufacturing, by Technology, Through 2029
- Table 50 : Asia-Pacific Market for Bioprocess Optimization and Digital Biomanufacturing, by Type of Manufacturing Technology, Through 2029
- Table 51 : Asia-Pacific Market for Bioprocess Optimization and Digital Biomanufacturing, by Type of Analytical and Process Control Technology, Through 2029
- Table 52 : Asia-Pacific Market for Bioprocess Optimization and Digital Biomanufacturing, by Type of Software, Through 2029
- Table 53 : Asia-Pacific Market for Bioprocess Optimization and Digital Biomanufacturing, by Application, Through 2029
- Table 54 : Asia-Pacific Market for Bioprocess Optimization and Digital Biomanufacturing, by Molecule Type, Through 2029
- Table 55 : RoW Market for Bioprocess Optimization and Digital Biomanufacturing, by Technology, Through 2029
- Table 56 : RoW Market for Bioprocess Optimization and Digital Biomanufacturing, by Type of Manufacturing Technology, Through 2029
- Table 57 : RoW Market for Bioprocess Optimization and Digital Biomanufacturing, by Type of Analytical and Process Control Technology, Through 2029
- Table 58 : RoW Market for Bioprocess Optimization and Digital Biomanufacturing, by Type of for Software, Through 2029
- Table 59 : RoW Market for Bioprocess Optimization and Digital Biomanufacturing, by Application, Through 2029
- Table 60 : RoW Market for Bioprocess Optimization and Digital Biomanufacturing, by Molecule Type, Through 2029
- Table 61 : Ranking of Leading Players in the Bioprocess Optimization and Digital Biomanufacturing Market, 2023
- Table 62 : Collaborations and Partnerships: Bioprocess Optimization and Digital Biomanufacturing Market, 2021-2024
- Table 63 : Expansion: Bioprocess Optimization and Digital Biomanufacturing Market, 2020-2024
- Table 64 : Acquisitions: Bioprocess Optimization and Digital Biomanufacturing Market, 2020-2024
- Table 65 : New Product Launches: Bioprocess Optimization and Digital Biomanufacturing Market, 2022-2024
- Table 66 : Key Focus Areas in ESG Metrics
- Table 67 : Environmental Performance Initiatives in the Bioprocess Optimization and Digital Biomanufacturing Market
- Table 68 : Social Performance Initiatives in the Bioprocess Optimization and Digital Biomanufacturing Market
- Table 69 : Governance Performance Initiatives in the Bioprocess Optimization and Digital Biomanufacturing Market
- Table 70 : ESG Rankings for Key Players in the Bioprocess Optimization and Digital Biomanufacturing Market, 2024*
- Table 71 : Abbreviations Used in this Report
- Table 72 : Agilent Technologies Inc.: Company Snapshot
- Table 73 : Agilent Technologies Inc.: Financial Performance, FY 2022 and 2023
- Table 74 : Agilent Technologies Inc.: Product & Services Portfolio
- Table 75 : Agilent Technologies Inc.: News/Key Developments, 2022-2024
- Table 76 : Agilitech: Company Snapshot
- Table 77 : Agilitech: Product Portfolio
- Table 78 : Agilitech: News/Key Developments, 2022 and 2024
- Table 79 : Bio-Rad Laboratories Inc.: Company Snapshot
- Table 80 : Bio-Rad Laboratories Inc.: Financial Performance, FY 2022 and 2023
- Table 81 : Bio-Rad Laboratories Inc.: Product Portfolio
- Table 82 : Bio-Rad Laboratories Inc.: News/Key Developments,2022
- Table 83 : Bruker: Company Snapshot
- Table 84 : Bruker: Financial Performance, FY 2022 and 2023
- Table 85 : Bruker: Product Portfolio
- Table 86 : Bruker: News/Key Developments, 2022 and 2023
- Table 87 : Clean Biologics: Company Snapshot
- Table 88 : Clean Biologics: Product & Services Portfolio
- Table 89 : Clean Biologics: News/Key Developments, 2021-2023
- Table 90 : Danaher Corp.: Company Snapshot
- Table 91 : Danaher Corp.: Financial Performance, FY 2022 and 2023
- Table 92 : Danaher Corp.: Product Portfolio
- Table 93 : Danaher Corp.: News/Key Developments, 2023
- Table 94 : Emerson Electric Co.: Company Snapshot
- Table 95 : Emerson Electric Co.: Financial Performance, FY 2022 and 2023
- Table 96 : Emerson Electric Co.: Product Portfolio
- Table 97 : Emerson Electric Co.: News/Key Developments, 2022-2024
- Table 98 : Eppendorf SE: Company Snapshot
- Table 99 : Eppendorf SE: Financial Performance, FY 2022 and 2023
- Table 100 : Eppendorf SE: Product Portfolio
- Table 101 : Eppendorf SE: News/Key Developments, 2022-2024
- Table 102 : Korber AG: Company Snapshot
- Table 103 : Korber AG: Financial Performance, FY 2022 and 2023
- Table 104 : Korber AG: Product Portfolio
- Table 105 : Korber AG: News/Key Developments, 2024
- Table 106 : Merck KGaA: Company Snapshot
- Table 107 : Merck KGaA: Financial Performance, FY 2022 and 2023
- Table 108 : Merck KGaA: Product Portfolio
- Table 109 : Merck KGaA: News/Key Developments, 2024
- Table 110 : Sartorius AG: Company Snapshot
- Table 111 : Sartorius AG: Financial Performance, FY 2022 and 2023
- Table 112 : Sartorius AG: Product Portfolio
- Table 113 : Sartorius AG: News/Key Developments, 2021-2024
- Table 114 : Shimadzu Corp.: Company Snapshot
- Table 115 : Shimadzu Corp.: Financial Performance, FY 2022 and 2023
- Table 116 : Shimadzu Corp.: Product Portfolio
- Table 117 : Shimadzu Corp.: News/Key Developments, 2024
- Table 118 : Thermo Fisher Scientific Inc.: Company Snapshot
- Table 119 : Thermo Fisher Scientific Inc.: Financial Performance, FY 2022 and 2023
- Table 120 : Thermo Fisher Scientific Inc.: Product Portfolio
- Table 121 : Thermo Fisher Scientific Inc.: News/Key Developments, 2020-2022
- Table 122 : Univercells Technologies: Company Snapshot
- Table 123 : Univercells Technologies: Product Portfolio
- Table 124 : Univercells Technologies: News/Key Developments, 2024
- Table 125 : Waters Corp.: Company Snapshot
- Table 126 : Waters Corp.: Financial Performance, FY 2022 and 2023
- Table 127 : Waters Corp.: Product Portfolio
- Table 128 : Waters Corp.: News/Key Developments, 2021-2023
List of Figures
- Summary Figure A : Global Market for Bioprocess Optimization and Digital Biomanufacturing, by Technology, 2021-2029
- Summary Figure B : Global Market for Bioprocess Optimization and Digital Biomanufacturing, by Region, 2021-2029
- Figure 1 : A Typical Biopharmaceutical Manufacturing Process
- Figure 2 : Market Dynamics for Bioprocess Optimization and Digital Biomanufacturing
- Figure 3 : Global Market Share for Bioprocess Optimization and Digital Biomanufacturing, by Technology, 2024
- Figure 4 : Global Market for Manufacturing Technologies in Bioprocess Optimization and Digital Biomanufacturing, by Type, 2021-2029
- Figure 5 : Global Market for Manufacturing Technologies in Bioprocess Optimization and Digital Biomanufacturing, by Region, 2021-2029
- Figure 6 : Global Market for Chromatography-based Separation and Purification Technology in Bioprocess Optimization and Digital Biomanufacturing , by Region, 2021-2029
- Figure 7 : Global Market for Filtration Technology in Bioprocess Optimization and Digital Biomanufacturing, by Region, 2021-2029
- Figure 8 : Global Market for Bioreactor Technology in Bioprocess Optimization and Digital Biomanufacturing, by Region, 2021-2029
- Figure 9 : Global Market for Centrifugation Technology in Bioprocess Optimization and Digital Biomanufacturing, by Region, 2021-2029
- Figure 10 : Global Market for Analytical and Process Control Technologies in Bioprocess Optimization and Digital Biomanufacturing, by Type, 2021-2029
- Figure 11 : Global Market for Analytical and Process Control Technologies in Bioprocess Optimization and Digital Biomanufacturing, by Region, 2021-2029
- Figure 12 : Global Market for Spectrophotometry in Bioprocess Optimization and Digital Biomanufacturing, by Region, 2021-2029
- Figure 13 : Global Market for Automation and Industrial Process Control Technologies in Bioprocess Optimization and Digital Biomanufacturing, by Region, 2021-2029
- Figure 14 : Global Market for Analytical Chromatography in Bioprocess Optimization and Digital Biomanufacturing, by Region, 2021-2029
- Figure 15 : Global Market for Sensors and Probes in Bioprocess Optimization and Digital Biomanufacturing, by Region, 2021-2029
- Figure 16 : Global Market for Software in Bioprocess Optimization and Digital Biomanufacturing, by Type, 2021-2029
- Figure 17 : Global Market for Software in Bioprocess Optimization and Digital Biomanufacturing, by Region, 2021-2029
- Figure 18 : Global Market for Industrial Control and Automation Software in Bioprocess Optimization and Digital Biomanufacturing, by Region, 2021-2029
- Figure 19 : Global Market for Bioprocess Optimization and Data Analytics Software in Bioprocess Optimization and Digital Biomanufacturing, by Region, 2021-2029
- Figure 20 : Global Market for Other Software Types in Bioprocess Optimization and Digital Biomanufacturing, by Region, 2021-2029
- Figure 21 : Global Market Share for Bioprocess Optimization and Digital Biomanufacturing, by Application, 2024
- Figure 22 : Global Market for Biomanufacturing Process Automation and Control Applications in Bioprocess Optimization and Digital Biomanufacturing, by Region, 2021-2029
- Figure 23 : Global Market for Flexible Manufacturing Applications in Bioprocess Optimization and Digital Biomanufacturing, by Region, 2021-2029
- Figure 24 : Global Market for Bioprocess Optimization and Process Analytics Applications in Bioprocess Optimization and Digital Biomanufacturing, by Region, 2021-2029
- Figure 25 : Global Market for Other Applications in Bioprocess Optimization and Digital Biomanufacturing, by Region, 2021-2029
- Figure 26 : Global Market Share for Bioprocess Optimization and Digital Biomanufacturing, by Molecule Type, 2024
- Figure 27 : Global Market of Monoclonal Antibodies in Bioprocess Optimization and Digital Biomanufacturing, by Region, 2021-2029
- Figure 28 : Global Market for Therapeutic Proteins and Peptides in Bioprocess Optimization and Digital Biomanufacturing, by Region, 2021-2029
- Figure 29 : Global Market for Vaccines in Bioprocess Optimization and Digital Biomanufacturing, by Region, 2021-2029
- Figure 30 : Global Market for Cell and Gene Therapies in Bioprocess Optimization and Digital Biomanufacturing, by Region, 2021-2029
- Figure 31 : Global Market Share for Bioprocess Optimization and Digital Biomanufacturing, by Region, 2024
- Figure 32 : North American Market for Bioprocess Optimization and Digital Biomanufacturing, by Technology, 2021-2029
- Figure 33 : North American Market for Bioprocess Optimization and Digital Biomanufacturing, by Type of Manufacturing Technology, 2021-2029
- Figure 34 : North American Market for Bioprocess Optimization and Digital Biomanufacturing, by Type of Analytical and Process Control Technology, 2021-2029
- Figure 35 : North American Market for Bioprocess Optimization and Digital Biomanufacturing, by Type of Software, 2021-2029
- Figure 36 : North American Market for Bioprocess Optimization and Digital Biomanufacturing, by Application, 2021-2029
- Figure 37 : North American Market for Bioprocess Optimization and Digital Biomanufacturing, by Molecule Type, 2021-2029
- Figure 38 : European Market for Bioprocess Optimization and Digital Biomanufacturing, by Technology, 2021-2029
- Figure 39 : European Market for Bioprocess Optimization and Digital Biomanufacturing, by Type of Manufacturing Technology, 2021-2029
- Figure 40 : European Market for Bioprocess Optimization and Digital Biomanufacturing, by Type of Analytical and Process Control Technology, 2021-2029
- Figure 41 : European Market for Bioprocess Optimization and Digital Biomanufacturing, by Type of Software, 2021-2029
- Figure 42 : European Market for Bioprocess Optimization and Digital Biomanufacturing, by Application, 2021-2029
- Figure 43 : European Market for Bioprocess Optimization and Digital Biomanufacturing, by Molecule Type, 2021-2029
- Figure 44 : Asia-Pacific Market for Bioprocess Optimization and Digital Biomanufacturing, by Technology, 2021-2029
- Figure 45 : Asia-Pacific Market for Bioprocess Optimization and Digital Biomanufacturing, by Type of Manufacturing Technology, 2021-2029
- Figure 46 : Asia-Pacific Market for Bioprocess Optimization and Digital Biomanufacturing, by Type of Analytical and Process Control Technology, 2021-2029
- Figure 47 : Asia-Pacific Market for Bioprocess Optimization and Digital Biomanufacturing, by Type of Software, 2021-2029
- Figure 48 : Asia-Pacific Market for Bioprocess Optimization and Digital Biomanufacturing, by Application, 2021-2029
- Figure 49 : Asia-Pacific Market for Bioprocess Optimization and Digital Biomanufacturing, by Molecule Type, 2021-2029
- Figure 50 : RoW Market for Bioprocess Optimization and Digital Biomanufacturing, by Technology, 2021-2029
- Figure 51 : RoW Market for Bioprocess Optimization and Digital Biomanufacturing, by Type of Manufacturing Technology, 2021-2029
- Figure 52 : RoW Market for Bioprocess Optimization and Digital Biomanufacturing, by Type of Analytical and Process Control Technology, 2021-2029
- Figure 53 : RoW Market for Bioprocess Optimization and Digital Biomanufacturing, by Type of Software, 2021-2029
- Figure 54 : RoW Market for Bioprocess Optimization and Digital Biomanufacturing, by Application, 2021-2029
- Figure 55 : RoW Market for Bioprocess Optimization and Digital Biomanufacturing, by Molecule Type, 2021-2029
- Figure 56 : Global Market Share for Bioprocess Optimization and Digital Biomanufacturing, by Key Strategies Adopted, 2020 to 2024
- Figure 57 : How a Strong ESG Proposition Benefits Businesses
- Figure 58 : Agilent Technologies Inc.: Revenue Share, by Business Unit, FY 2023
- Figure 59 : Agilent Technologies Inc.: Revenue Share, by Country/Region, FY 2023
- Figure 60 : Bio-Rad Laboratories Inc.: Revenue Share, by Business Unit, FY 2023
- Figure 61 : Bio-Rad Laboratories Inc.: Revenue Share, by Country/Region, FY 2023
- Figure 62 : Bruker: Revenue Share, by Business Unit, FY 2023
- Figure 63 : Bruker: Revenue Share, by Country/Region, FY 2023
- Figure 64 : Danaher Corp.: Revenue Share, by Business Unit, FY 2023
- Figure 65 : Danaher Corp.: Revenue Share, by Country/Region, FY 2023
- Figure 66 : Emerson Electric Co.: Revenue Share, by Business Unit, FY 2023
- Figure 67 : Emerson Electric Co.: Revenue Share, by Country/Region, FY 2023
- Figure 68 : Eppendorf SE: Revenue Share, by Business Unit, FY 2023
- Figure 69 : Eppendorf SE: Revenue Share, by Country/Region, FY 2023
- Figure 70 : Merck KGaA: Revenue Share, by Business Unit, FY 2023
- Figure 71 : Merck KGaA: Revenue Share, by Country/Region, FY 2023
- Figure 72 : Sartorius AG: Revenue Share, by Business Unit, FY 2023
- Figure 73 : Sartorius AG: Revenue Share, by Country/Region, FY 2023
- Figure 74 : Shimadzu Corp.: Revenue Share, by Business Unit, FY 2023
- Figure 75 : Shimadzu Corp.: Revenue Share, by Country/Region, FY 2023
- Figure 76 : Thermo Fisher Scientific Inc.: Revenue Share, by Business Unit, FY 2023
- Figure 77 : Thermo Fisher Scientific Inc.: Revenue Share, by Country/Region, FY 2023
- Figure 78 : Waters Corp.: Revenue Share, by Business Unit, FY 2023
- Figure 79 : Waters Corp.: Revenue Share, by Country/Region, FY 2023
The global market for bioprocess optimization and digital biomanufacturing is expected to grow from $24.3 billion in 2024 and is projected to reach $39.6 billion by the end of 2029, at a compound annual growth rate (CAGR) of 10.2% during the forecast period of 2024 to 2029.
The North American bioprocess optimization and digital biomanufacturing market is expected to grow from $9.0 billion in 2024 and is projected to reach $14.5 billion by the end of 2029, at a CAGR of 10.0% during the forecast period of 2024 to 2029.
The European bioprocess optimization and digital biomanufacturing market is expected to grow from $7.2 billion in 2024 and is projected to reach $11.5 billion by the end of 2029, at a CAGR of 9.7% during the forecast period of 2024 to 2029.
Report Scope
The report provides a comprehensive analysis of the bioprocess optimization and digital biomanufacturing market in a global context, including market forecasts and sales through the year 2029. Segmentation based on technology type includes manufacturing technologies (chromatography-based separation and purification, filtration, bioreactors, centrifugation), analytical and process control technologies (spectrophotometry, automation and industrial process control technologies, analytical chromatography, sensors and probes), and software (Industrial control and automation software, bioprocess optimization and data analytics software). Segmentation based on application includes biomanufacturing process automation and control, flexible manufacturing, bioprocess optimization and process analytics, and others. By molecule type the market is segmented into monoclonal antibodies, vaccines, therapeutic proteins and peptides, and cell and gene therapies. The regional markets covered are North America, Europe, Asia-Pacific, and the Rest of the World (RoW). For market estimates, data has been provided for 2023 as the base year, with forecasts for 2024 through 2029.
The report discusses the critical issues impacting the adoption of digital biomanufacturing in pharmaceuticals, as well as emerging trends in digital biomanufacturing technologies. It also features new developments and new product launches in the global market. The report provides comprehensive profiles of market players in the industry. The report also covers mergers and acquisitions and any other collaborations or partnerships that occurred during the evaluation period of this report and which are expected to shape the industry.
Report Includes
- 69 data tables and 61 additional tables
- Analyses of trends in the global market for bioprocess optimization and digital bio-manufacturing, with market revenue data for 2021-2023, estimates for 2024, forecasts for 2025, and projected CAGRs through 2029
- Estimates of the market size and revenue growth prospects of the global market, along with a market share analysis by technology, application, drug molecule type and region
- Facts and figures pertaining to the market dynamics, technical advances, regulations and the impact of macroeconomic factors
- Insights derived from the Porter's Five Forces model, as well as global supply chain and PESTLE analyses
- Analysis of patents, emerging trends, and new developments
- Analysis of the industry structure, including companies' market shares, strategic alliances, M&A activity and a venture funding outlook
- Overview of sustainability trends and ESG developments, with emphasis on consumer attitudes, and ESG scores and practices of leading companies
- Profiles of the market leaders, including Agilent Technologies Inc., Thermo Fisher Scientific Inc., Danaher Corp., and Sartorius AG.
Table of Contents
Chapter 1 Introduction
- Market Outlook
- Scope of Report
- Market Summary
Chapter 2 Market Overview
- Overview
- Technology Background
- Biologics Manufacturing Process
- Upstream Processing
- Cell Harvesting and Clarification
- Downstream Processing
- Bioprocess Optimization
- Industry 4.0-Digital Biomanufacturing
Chapter 3 Market Dynamics
- Global Market Dynamics
- Market Drivers
- Growing Aging Population
- Increasing Prevalence of Chronic Diseases
- Unprecedented Rise in Demand for Biopharmaceuticals
- Growing Number of Product Launches
- Increasing Number of Contract Manufacturing Organizations (CMOs)
- Market Restraints
- Lack of Skilled Labor
- High Cost of Equipment
- Unharmonized Smart Manufacturing Standards
- Market Opportunities
- Favorable Government Programs
- Advances in Sensor Technology
- Process Analytical Technology Initiatives
- Market Challenges
- Technical Issues and the Threat of Cyberattacks
- Regulatory Landscape
- Good Automation Manufacturing Practices (GAMP)
- Instrumentation, Systems, and Automation (ISA) Society-88 and 95 Standards
Chapter 4 Emerging Technologies and Developments
- Emerging Trends and Technologies
- Continuous Bioprocessing
- Continuous Cell Retention Technologies
- Continuous Chromatography
- Single-Use Technologies
Chapter 5 Market Segmentation Analysis
- Key Market Trends
- Segmentation Breakdown
- Market Analysis by Technology
- Manufacturing Technologies
- Analytical and Process Control Technologies
- Software
- Market Analysis by Application
- Biomanufacturing Process Automation and Control
- Flexible Manufacturing
- Bioprocess Optimization and Process Analytics
- Other Applications
- Market Analysis by Molecule Type
- Monoclonal Antibodies (mAbs)
- Therapeutic Proteins and Peptides
- Vaccines
- Cell and Gene Therapies
- Geographic Breakdown
- Market Analysis by Region
- North America
- Europe
- Asia-Pacific
- Rest of the World
Chapter 6 Competitive Intelligence
- Ranking of Leading Players
- Key Strategies Adopted by Players
- Collaborations and Partnerships
- Expansion
- Acquisitions
- New Product Launches
Chapter 7 Sustainability in the Bioprocess Optimization and Digital Biomanufacturing Market: An ESG Perspective
- Introduction to ESG
- ESG Practices in the Industry
- Environmental Performance
- Social Performance
- Governance Performance
- Companies' ESG Risk Ratings
- Concluding Remarks from BCC Research
Chapter 8 Appendix
- Methodology
- Information Sources
- References
- Abbreviations
- Company Profiles
- AGILENT TECHNOLOGIES INC.
- AGILITECH
- BIO-RAD LABORATORIES INC.
- BRUKER
- CLEAN BIOLOGICS
- DANAHER CORP.
- EMERSON ELECTRIC CO.
- EPPENDORF SE
- KORBER AG
- MERCK KGAA
- SARTORIUS AG
- SHIMADZU CORP.
- THERMO FISHER SCIENTIFIC INC.
- UNIVERCELLS TECHNOLOGIES
- WATERS CORP.
