|
|
市場調査レポート
商品コード
1590312
従来型および代替的疼痛治療の世界市場Conventional and Alternative Pain Treatment Markets |
||||||

|
|||||||
|
|||||||


| 従来型および代替的疼痛治療の世界市場 |
|
出版日: 2024年11月13日
発行: BCC Research
ページ情報: 英文 173 Pages
納期: 即納可能
|

全表示
- 概要
- 図表
- 目次
世界の従来型および代替的疼痛治療の市場規模は、2024年の962億米ドルから、予測期間中は8.4%のCAGRで推移し、2029年末には1,442億米ドルの規模に成長すると予測されています。
医薬品/薬物療法の部門は、2024年の615億米ドルから、CAGR 9.4%で推移し、2029年末には963億米ドルに達すると予測されています。デバイス部門は、2024年の347億米ドルから、CAGR 6.7%で推移し、2029年末には479億米ドルに達すると予測されています。
当レポートでは、世界の従来型および代替的疼痛治療の市場を調査し、市場概要、市場影響因子および市場機会の分析、法規制環境、新興技術および技術開発の動向、市場規模の推移・予測、各種区分・地域別の詳細分析、競合情勢、主要企業のプロファイルなどをまとめています。
目次
第1章 エグゼクティブサマリー
- 市場の展望
- 調査範囲
- 市場概要
第2章 市場概要:疼痛タイプとその治療
- 疼痛の認識
- 疼痛の治療方法
- 疼痛管理技術:電気刺激
- 疼痛管理処置
- 疼痛管理の代替的手法
- 疼痛に対する大麻治療のトレンドが拡大
- 慢性疼痛に対する代替療法による治療
第3章 市場力学
- 市場促進要因
- 高齢化人口の増加
- 医療機器におけるAI統合の拡大
- 慢性疾患の発症率の上昇
- 慢性疼痛に対処する公衆衛生プログラムの増加
- 非薬物療法の進歩
- 市場抑制要因
- 医療機器設計の失敗
- サプライチェーンの問題と品質に関する懸念
- 市場機会
- ウェアラブルデバイスの利用拡大
- 従来型および代替的疼痛治療のための技術開発
- 今後の動向と可能性
第4章 新興技術と開発
- 再生医療
- 再生医療による疼痛管理の利点
- Minuteman処置
- 末梢神経刺激 (PNS)
- VIAディスク治療
- その他の技術
- ウェアラブルデバイスとバイオフィードバック
- バーチャルリアリティ (VR) 治療
- 疼痛の予測におけるAI
- 疼痛管理の臨床試験
- 従来の疼痛治療と代替治療法の開発動向
第5章 市場セグメンテーション分析
- セグメンテーションの内訳
- 市場内訳:疼痛管理タイプ別
- 市場規模・予測
- 医薬品/薬物療法
- 市場規模・予測
- 非麻薬性鎮痛剤
- 医療用大麻
- 麻薬性鎮痛剤
- 片頭痛治療薬
- 中枢神経系 (CNS) 治療
- 麻酔薬
- その他のクラス
- デバイス
- 市場規模・予測
- 脊椎刺激装置
- 電気療法/筋肉刺激
- その他のデバイス
- 市場内訳:用途別
- 市場規模・予測
- 整形外科および筋骨格系の疼痛
- 市場規模・予測
- 一般的な広範囲疼痛管理
- 市場規模・予測
- 外科的疼痛管理
- 市場規模・予測
- 片頭痛
- 市場規模・予測
- 神経障害性疼痛
- 市場規模・予測
- がん性疼痛
- 市場規模・予測
- 線維筋痛症の疼痛
- 市場規模・予測
- その他の疼痛の種類
- 市場規模・予測
- 地理的内訳
- 市場内訳:地域別
- 市場規模・予測
- 北米
- 市場規模・予測
- 米国
- カナダ
- メキシコ
- 欧州
- 市場規模・予測
- ドイツ
- フランス
- 英国
- イタリア
- スペイン
- その他の欧州
- アジア太平洋
- 市場規模・予測
- 中国
- 日本
- インド
- オーストラリアとニュージーランド
- その他のアジア太平洋地域
- ラテンアメリカ
- 市場規模・予測
- ブラジル
- アルゼンチン
- その他のラテンアメリカ
- 中東・アフリカ
- 市場規模・予測
- 南アフリカ
- GCC諸国
- その他の中東・アフリカ
第6章 競合情報
- 世界の市場・主要企業の分析
- 合意・協力・提携
- 2023年のデバイス承認
第7章 持続可能性
- 従来型および代替的疼痛治療業界におけるESGの重要性
- 疼痛治療医療機器業界におけるESG実践
- 環境パフォーマンス
- 社会的パフォーマンス
- ガバナンスパフォーマンス
- ESGランキング
- BCCの見解
第8章 付録
- 調査手法
- 参考文献
- 企業プロファイル
- ABBOTT
- ABBVIE INC.
- AMGEN INC.
- BAXTER
- BAYER AG
- BOEHRINGER INGELHEIM INTERNATIONAL GMBH
- BOSTON SCIENTIFIC CORP.
- GSK PLC
- JOHNSON & JOHNSON SERVICES INC.
- LILLY
- MEDTRONIC
- MERCK & CO. INC.
- NOVARTIS AG
- PFIZER INC.
- TEVA PHARMACEUTICAL INDUSTRIES LTD.
List of Tables
- Summary Table : Global Conventional and Alternative Pain Treatment Market, by Pain Management Type, Through 2029
- Table 1 : Most Common Long-Term Health Conditions in Australia, by Age Group, 2022
- Table 2 : Clinical Trials for Pain Management at UCSF, 2024
- Table 3 : Additional Clinical Trials for Pain Management, 2024
- Table 4 : Complementary and Alternative Medicines, by Types
- Table 5 : Global Conventional and Alternative Pain Treatment Market, by Pain Management Type, Through 2029
- Table 6 : Global Conventional and Alternative Pain Treatment Market for Pharmaceuticals/Drug Therapy, by Region, Through 2029
- Table 7 : Global Conventional and Alternative Pain Treatment Market for Pharmaceuticals/Drug Therapy, by Type, Through 2029
- Table 8 : List of NSAIDs
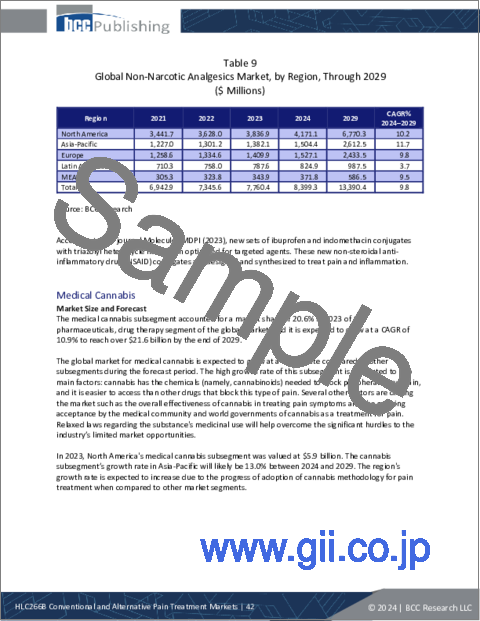
- Table 9 : Global Non-Narcotic Analgesics Market, by Region, Through 2029
- Table 10 : Global Medical Cannabis Market, by Region, Through 2029
- Table 11 : Global Narcotic Analgesics Market, by Region, Through 2029
- Table 12 : Global Antimigraine Agents Market, by Region, Through 2029
- Table 13 : Global CNS Treatments Market, by Region, Through 2029
- Table 14 : Global Anesthetics Market, by Region, Through 2029
- Table 15 : Global Other Classes Market of Pharmaceutical Drug Therapy, by Region, Through 2029
- Table 16 : Global Conventional and Alternative Pain Treatment Market for Devices, by Type, Through 2029
- Table 17 : Global Conventional and Alternative Pain Treatment Market for Devices, by Region, Through 2029
- Table 18 : Global Spine Stimulators Market, by Region, Through 2029
- Table 19 : Global Electrotherapy/Muscle Stimulation Market, by Region, Through 2029
- Table 20 : Global Other Devices Market, by Region, Through 2029
- Table 21 : Global Conventional and Alternative Pain Treatment Market, by Application, Through 2029
- Table 22 : Global Orthopedic and Musculoskeletal Pain Application Market, by Region, Through 2029
- Table 23 : Global General and Broad Pain Management Application Market, by Region, Through 2029
- Table 24 : Global Surgical Pain Management Application Market, by Region, Through 2029
- Table 25 : Global Migraine/Headache Application Market, by Region, Through 2029
- Table 26 : Global Neuropathic Pain Application Market, by Region, Through 2029
- Table 27 : Cancer Pain Medication
- Table 28 : Global Cancer Pain Application Market, by Region, Through 2029
- Table 29 : Global Fibromyalgia Pain Application Market, by Region, Through 2029
- Table 30 : Global Other Pain Applications Market, by Region, Through 2029
- Table 31 : Global Conventional and Alternative Pain Treatment Market, by Region, Through 2029
- Table 32 : North American Conventional and Alternative Pain Treatment Market, by Country, Through 2029
- Table 33 : European Conventional and Alternative Pain Treatment Market, by Country, Through 2029
- Table 34 : Chronic Pain Rates, by Population and Percentage Affected, 2029
- Table 35 : Asia-Pacific Conventional and Alternative Pain Treatment Market, by Country, Through 2029
- Table 36 : Latin American Countries that Participated in the FEDELAT survey, 2017-2022
- Table 37 : Latin American Conventional and Alternative Pain Treatment Market, by Country, Through 2029
- Table 38 : Middle Eastern & African Conventional and Alternative Pain Treatment Market, by Sub-Region, Through 2029
- Table 39 : Medical Devices Cleared or Approved by FDA, 2023
- Table 40 : ESG Practices: Environmental Performance
- Table 41 : ESG Practices: Social Performance
- Table 42 : ESG Practices: Governance Performance
- Table 43 : ESG Rankings for Major Medical Device Companies, 2023 and 2024*
- Table 44 : Abbott: Company Snapshot
- Table 45 : Abbott: Financial Performance, 2022 and 2023
- Table 46 : Abbott: Product Portfolio
- Table 47 : Abbott: News/Key Developments, 2022 and 2023
- Table 48 : AbbVie Inc.: Company Snapshot
- Table 49 : AbbVie Inc.: Financial Performance, 2022 and 2023
- Table 50 : AbbVie Inc.: Product Portfolio
- Table 51 : AbbVie Inc.: News/Key Developments, 2024
- Table 52 : Amgen Inc.: Company Snapshot
- Table 53 : Amgen Inc.: Financial Performance, 2022 and 2023
- Table 54 : Amgen Inc.: Product Portfolio
- Table 55 : Amgen Inc.: News/Key Developments, 2022 and 2023
- Table 56 : Baxter: Company Snapshot
- Table 57 : Baxter: Financial Performance, 2022 and 2023
- Table 58 : Baxter: Product Portfolio
- Table 59 : Baxter: News/Key Developments, 2021-2024
- Table 60 : Bayer AG: Company Snapshot
- Table 61 : Bayer AG: Financial Performance, 2022 and 2023
- Table 62 : Bayer AG: Product Portfolio
- Table 63 : Bayer AG: News/Key Developments, 2023
- Table 64 : Boehringer Ingelheim International GmbH: Company Snapshot
- Table 65 : Boehringer Ingelheim International GmbH: Financial Performance, 2022 and 2023
- Table 66 : Boehringer Ingelheim International GmbH: Product Portfolio
- Table 67 : Boehringer Ingelheim International GmbH: News/Key Developments, 2022-2024
- Table 68 : Boston Scientific Corp.: Company Snapshot
- Table 69 : Boston Scientific Corp.: Financial Performance, 2022 and 2023
- Table 70 : Boston Scientific Corp.: Product Portfolio
- Table 71 : Boston Scientific Corp.: News/Key Developments, 2023 and 2024
- Table 72 : GSK Plc: Company Snapshot
- Table 73 : GSK Plc: Financial Performance, 2022 and 2023
- Table 74 : GSK Plc: Products Portfolio
- Table 75 : GSK Plc.: News/Key Developments, 2021 and 2022
- Table 76 : Johnson and Johnson Services Inc.: Company Snapshot
- Table 77 : Johnson and Johnson Services Inc.: Financial Performance, 2022 and 2023
- Table 78 : Johnson and Johnson Services Inc.: Product Portfolio
- Table 79 : Johnson and Johnson Services Inc.: News/Key Developments, 2021-2024
- Table 80 : Lilly: Company Snapshot
- Table 81 : Lilly: Financial Performance, 2022 and 2023
- Table 82 : Lilly: Product Portfolio
- Table 83 : Lilly: News/Key Developments, 2021 and 2022
- Table 84 : Medtronic: Company Snapshot
- Table 85 : Medtronic: Financial Performance, 2022 and 2023
- Table 86 : Medtronic: Product Portfolio
- Table 87 : Medtronic: News/Key Developments, 2022-2024
- Table 88 : Merck & Co. Inc.: Company Snapshot
- Table 89 : Merck & Co. Inc.: Financial Performance, 2022 and 2023
- Table 90 : Merck & Co. Inc.: Product Portfolio
- Table 91 : Merck & Co. Inc.: News/Key Developments, 2022-2024
- Table 92 : Novartis AG: Company Snapshot
- Table 93 : Novartis AG: Financial Performance, 2022 and 2023
- Table 94 : Novartis AG: Product Portfolio
- Table 95 : Novartis AG: News/Key Developments, 2022 and 2023
- Table 96 : Pfizer Inc.: Company Snapshot
- Table 97 : Pfizer Inc.: Financial Performance, 2022 and 2023
- Table 98 : Pfizer Inc.: Product Portfolio
- Table 99 : Pfizer Inc.: News/Key Developments, 2021-2024
- Table 100 : Teva Pharmaceutical Industries Ltd.: Company Snapshot
- Table 101 : Teva Pharmaceutical Industries Ltd.: Financial Performance, 2022 and 2023
- Table 102 : Teva Pharmaceutical Industries Ltd.: Product Portfolio
- Table 103 : Teva Pharmaceutical Industries Ltd.: News/Key Developments, 2021-2024
List of Figures
- Summary Figure : Global Conventional and Alternative Pain Treatment Market Shares, by Pain Management Type, 2023
- Figure 1 : Pain Management Treatments
- Figure 2 : Market Dynamics
- Figure 3 : Global Projected Shares of Elderly Population (Aged 65 Years and Older), by Region, 2050
- Figure 4 : Future Trends for Pain Management
- Figure 5 : Types of Pain Management Techniques and Their Usage
- Figure 6 : Most Popular Forms of Alternative Medicines and Therapies in the U.S., 2022
- Figure 7 : Global Conventional and Alternative Pain Treatment Market Shares, by Pain Management Type, 2023
- Figure 8 : Global Conventional and Alternative Pain Treatment Market Shares for Pharmaceuticals/Drug Therapy, by Type, 2023
- Figure 9 : Global Conventional and Alternative Pain Treatment Market Shares for Device, by Type, 2023
- Figure 10 : Global Conventional and Alternative Pain Treatment Market Shares, by Application, 2023
- Figure 11 : Projections of Osteoarthritis, 2050
- Figure 12 : Global Conventional and Alternative Pain Treatment Market Shares, by Region, 2023
- Figure 13 : North American Conventional and Alternative Pain Treatment Market Shares, by Pain Management Type, 2023
- Figure 14 : North American Conventional and Alternative Pain Treatment Market Shares for Pharmaceuticals/Drug Therapy, by Type, 2023
- Figure 15 : North American Conventional and Alternative Pain Treatment Market Shares for Devices, by Type, 2023
- Figure 16 : North American Conventional and Alternative Pain Treatment Market Shares, by Application, 2023
- Figure 17 : North American Conventional and Alternative Pain Treatment Market Shares, by Country, 2023
- Figure 18 : European Conventional and Alternative Pain Treatment Market Shares, by Pain Management Type, 2023
- Figure 19 : European Conventional and Alternative Pain Treatment Market Shares for Pharmaceuticals/Drug Therapy, by Type, 2023
- Figure 20 : European Conventional and Alternative Pain Treatment Market Shares for Devices, by Type, 2023
- Figure 21 : European Conventional and Alternative Pain Treatment Market Shares, by Application, 2023
- Figure 22 : European Conventional and Alternative Pain Treatment Market Shares, by Country, 2023
- Figure 23 : Spanish Spending Across All Healthcare Categories
- Figure 24 : Asia-Pacific Conventional and Alternative Pain Treatment Market Shares, by Pain Management Type, 2023
- Figure 25 : Asia-Pacific Conventional and Alternative Pain Treatment Market Shares for Pharmaceuticals/Drug Therapy, by Type, 2023
- Figure 26 : Asia-Pacific Conventional and Alternative Pain Treatment Market Shares for Devices, by Type, 2023
- Figure 27 : Asia-Pacific Conventional and Alternative Pain Treatment Market Shares, by Application, 2023
- Figure 28 : Asia-Pacific Conventional and Alternative Pain Treatment Market Shares, by Country, 2023
- Figure 29 : Latin American Conventional and Alternative Pain Treatment Market Shares, by Pain Management Type, 2023
- Figure 30 : Latin American Conventional and Alternative Pain Treatment Market Shares for Pharmaceuticals/Drug Therapy, by Type, 2023
- Figure 31 : Latin American Conventional and Alternative Pain Treatment Market Shares for Devices, by Type, 2023
- Figure 32 : Latin American Conventional and Alternative Pain Treatment Market Shares, by Application, 2023
- Figure 33 : Latin American Conventional and Alternative Pain Treatment Market Shares, by Country, 2023
- Figure 34 : Middle Eastern & African Conventional and Alternative Pain Treatment Market Shares, by Pain Management Type, 2023
- Figure 35 : Middle Eastern & African Conventional and Alternative Pain Treatment Market Shares for Pharmaceuticals/Drug Therapy, by Type, 2023
- Figure 36 : Middle Eastern & African Conventional and Alternative Pain Treatment Market Shares for Devices, by Type, 2023
- Figure 37 : Middle Eastern & African Conventional and Alternative Pain Treatment Market Shares, by Application, 2023
- Figure 38 : Middle Eastern & African Conventional and Alternative Pain Treatment Market Shares, by Sub-Region, 2023
- Figure 39 : Leading Players in the Conventional and Alternative Pain Treatment Market, 2023
- Figure 40 : Snapshot: Key ESG Trends in the Conventional and Alternative Pain Treatment Industry
- Figure 41 : Viewpoints on Sustainable Medical Devices
- Figure 42 : Abbott: Revenue Shares, by Business Unit, 2023
- Figure 43 : Abbott: Revenue Shares, by Country/Region, 2023
- Figure 44 : AbbVie Inc.: Revenue Shares, by Business Unit, 2023
- Figure 45 : AbbVie Inc.: Revenue Shares, by Country/Region, 2023
- Figure 46 : Amgen Inc.: Revenue Shares, by Business Unit, 2023
- Figure 47 : Amgen Inc.: Revenue Shares, by Country/Region, 2023
- Figure 48 : Baxter.: Revenue Shares, by Business Unit, 2023
- Figure 49 : Baxter: Revenue Shares, by Country/Region, 2023
- Figure 50 : Bayer AG: Revenue Shares, by Country/Region, 2023
- Figure 51 : Bayer AG: Revenue Shares, by Business Unit, 2023
- Figure 52 : Boehringer Ingelheim International GmbH: Revenue Shares, by Business Unit, 2023
- Figure 53 : Boehringer Ingelheim International GmbH: Revenue Shares, by Country/Region, 2023
- Figure 54 : Boston Scientific Corp.: Revenue Shares, by Business Unit, 2023
- Figure 55 : Boston Scientific Corp.: Revenue Shares, by Country/Region, 2023
- Figure 56 : GSK Plc: Revenue Shares, by Business Unit, 2023
- Figure 57 : GSK Plc: Revenue Shares, by Country/Region, 2023
- Figure 58 : Johnson and Johnson Services Inc.: Revenue Shares, by Business Unit, 2023
- Figure 59 : Johnson and Johnson Services Inc.: Revenue Shares, by Country/Region, 2023
- Figure 60 : Lilly: Revenue Shares, by Business Unit, 2023
- Figure 61 : Lilly: Revenue Shares, by Country/Region, 2023
- Figure 62 : Medtronic.: Revenue Shares, by Business Unit, 2023
- Figure 63 : Medtronic: Revenue Shares, by Country/Region, 2023
- Figure 64 : Merck & Co. Inc.: Revenue Shares, by Business Unit, 2023
- Figure 65 : Merck & Co. Inc.: Revenue Shares, by Country/Region, 2023
- Figure 66 : Novartis AG: Revenue Shares, by Business Unit, 2023
- Figure 67 : Novartis AG: Revenue Shares, by Country/Region, 2023
- Figure 68 : Pfizer Inc.: Revenue Shares, by Business Unit, 2023
- Figure 69 : Pfizer Inc.: Revenue Shares, by Country/Region, 2023
- Figure 70 : Teva Pharmaceutical Industries Ltd.: Revenue Shares, Business Unit, 2023
- Figure 71 : Teva Pharmaceutical Industries Ltd.: Revenue Shares, by Country/Region, 2023
The global market for conventional and alternative pain treatment is expected to grow from $96.2 billion in 2024 and is projected to reach $144.2 billion by the end of 2029, at a compound annual growth rate (CAGR) of 8.4% during the forecast period of 2024 to 2029.
The pharmaceuticals/drug therapy segment of conventional and alternative pain treatment market is expected to grow from $61.5 billion in 2024 and is projected to reach $96.3 billion by the end of 2029, at a CAGR of 9.4% during the forecast period of 2024 to 2029.
The devices segment of conventional and alternative pain treatment market is expected to grow from $34.7 billion in 2024 and is projected to reach $47.9 billion by the end of 2029, at a CAGR of 6.7% during the forecast period of 2024 to 2029.
Report Scope
This report covers the conventional and alternative pain treatments used by patients with chronic or acute pain. It provides the current and future market potential of conventional and alternative pain treatments and includes a detailed analysis of the competitive environment. The report covers the drivers, restraints and opportunities in the market; surveys the prevalence of or incidence of chronic diseases; and highlights emerging technologies for alternative treatment procedures. It includes market projections for 2029 and provides the market shares of key players.
In this analysis, the conventional and alternative pain treatment market is segmented based on pain management type into pharmaceuticals/drug therapy and devices. The pharmaceuticals/drug therapy segment is further segmented into non-narcotic analgesics, medical cannabis, narcotic analgesics, antimigraine agents, central nervous system (CNS) treatments, anesthetics, and other classes of pharmaceutical drug therapy. The devices segment of the conventional and alternative pain treatment market is further segmented into spine stimulators, electrotherapy/muscle stimulation, and other devices. Based on application, the overall conventional and alternative pain treatment market is segmented into orthopedic and musculoskeletal pain, general and broad pain management, surgical pain management, migraine/headache pain, neuropathic pain, cancer pain, fibromyalgia pain, and other pain types.
The overall conventional and alternative pain treatment market has also been segmented by geography into North America, Europe, Asia-Pacific, Latin America and Middle East & Africa (MEA). Each regional analysis covers the region's leading countries, namely, the U.S., Germany, the U.K., Italy, France, Spain, Japan, China, India, Brazil, Mexico and GCC countries. Market data is provided for 2023, which serves as the base year; estimates are given for 2024 and forecast values for 2029.
Report Includes
- 48 data tables and 56 additional tables
- Analysis of the global market for conventional and alternative pain treatments
- Analyses of global market trends, with market revenue data from 2012-2023, estimates for 2024, and projected CAGRs through 2029
- Estimate of the current market size and revenue prospects of the global market, along with a market share analysis by pain management type, application and region
- Facts and figures pertaining to the market dynamics, technological advances, regulations, and the influence of macroeconomic factors
- A Porter's Five Forces analysis, a global supply chain analysis and a SWOT analysis
- Overview of sustainability trends and ESG developments, with emphasis on consumer attitudes, ESG score analysis, and the ESG practices of leading companies
- A look at recent patent grants
- Analysis of the industry structure and competitive landscape, including company market shares, strategic alliances, M&A activity and venture funding outlook
- Profiles of market leaders, including Medtronic, Abbott, GSK, Pfizer Inc., and Johnson & Johnson
Table of Contents
Chapter 1 Executive Summary
- Market Outlook
- Scope of Report
- Market Summary
Chapter 2 Market Overview of Types of Pain and Its Treatment
- Introduction
- The Perception of Pain
- How Pain is Treated
- Pain Management Techniques: Electrical Stimulation
- Pain Management Procedures
- Alternative Methods of Pain Management
- Growing Trend in Cannabis Treatment for Pain
- Treatment Using Alternatives for Chronic Pain
Chapter 3 Market Dynamics
- Introduction
- Market Drivers
- Rise in the Aging Population
- Increasing Integration of Artificial Intelligence in Medical Devices
- Rising Incidence of Chronic Diseases
- Growth of Public Health Programs That Address Chronic Pain
- Improvement in the Non-Drug Techniques
- Market Restraints
- Failure in Medical Device Designs
- Supply Chain Issues and Quality Concerns
- Market Opportunities
- Expanding Usage of Wearable Devices
- Technological Development for Conventional and Alternative Pain Treatment
- Future Trends and Possibilities
Chapter 4 Emerging Technologies and Developments
- Introduction
- Regenerative Medicine
- Advantages of Regenerative Pain Management
- Minuteman Procedure
- Peripheral Nerve Stimulation (PNS)
- VIA Disc Treatment
- Other Technologies
- Wearable Devices and Biofeedback
- Virtual Reality (VR) Therapy
- Artificial Intelligence (AI) in Pain Prediction
- Pain Management Clinical Trials
- Trends in Development of Conventional and Alternative Pain Treatment
Chapter 5 Market Segmentation Analysis
- Segmentation Breakdown
- Market Breakdown by Pain Management Type
- Market Size and Forecast
- Pharmaceuticals/Drug Therapy
- Market Size and Forecast
- Non-Narcotic Analgesics
- Medical Cannabis
- Narcotic Analgesics
- Antimigraine Agents
- Central Nervous System (CNS) Treatments
- Anesthetics
- Other Classes
- Devices
- Market Size and Forecast
- Spine Stimulators
- Electrotherapy/Muscle Stimulation
- Other Devices
- Market Breakdown by Application
- Market Size and Forecast
- Orthopedic and Musculoskeletal Pain
- Market Size and Forecast
- General and Broad Pain Management
- Market Size and Forecast
- Surgical Pain Management
- Market Size and Forecast
- Migraine/Headache
- Market Size and Forecast
- Neuropathic Pain
- Market Size and Forecast
- Cancer Pain
- Market Size and Forecast
- Fibromyalgia Pain
- Market Size and Forecast
- Other Pain Types
- Market Size and Forecast
- Geographical Breakdown
- Market Analysis by Region
- Market Size and Forecast
- North America
- Market Size and Forecast
- U.S.
- Canada
- Mexico
- Europe
- Market Size and Forecast
- Germany
- France
- U.K.
- Italy
- Spain
- Rest of Europe
- Asia-Pacific
- Market Size and Forecast
- China
- Japan
- India
- Australia and New Zealand
- Rest of Asia-Pacific
- Latin America
- Market Size and Forecast
- Brazil
- Argentina
- Rest of Latin America
- Middle East & Africa
- Market Size and Forecast
- South Africa
- GCC Countries
- Rest of the Middle East & Africa
Chapter 6 Competitive Intelligence
- Introduction
- Global Analysis of the Market and Its Leading Players
- Agreements, Collaborations and Partnerships
- 2023 Device Approvals
Chapter 7 Sustainability
- Importance of ESG in the Conventional and Alternative Pain Treatment Industry
- ESG Practices in the Pain Treatment Medical Device Industry
- Environmental Performance
- Social Performance
- Governance Performance
- ESG Ranking
- BCC Research Viewpoint
Chapter 8 Appendix
- Research Methodology
- References
- Company Profiles
- ABBOTT
- ABBVIE INC.
- AMGEN INC.
- BAXTER
- BAYER AG
- BOEHRINGER INGELHEIM INTERNATIONAL GMBH
- BOSTON SCIENTIFIC CORP.
- GSK PLC
- JOHNSON & JOHNSON SERVICES INC.
- LILLY
- MEDTRONIC
- MERCK & CO. INC.
- NOVARTIS AG
- PFIZER INC.
- TEVA PHARMACEUTICAL INDUSTRIES LTD.
