|
|
市場調査レポート
商品コード
1572712
ナノろ過:世界の市場と各種技術Global Markets and Technologies for Nanofiltration |
||||||
|
|||||||
| ナノろ過:世界の市場と各種技術 |
|
出版日: 2024年10月18日
発行: BCC Research
ページ情報: 英文 149 Pages
納期: 即納可能
|
全表示
- 概要
- 図表
- 目次
世界のナノろ過の市場規模は、2024年の15億米ドルから、予測期間中はCAGR 17.6%で推移し、2029年末には34億米ドルの規模に成長すると予測されています。
当レポートでは、世界のナノろ過の市場を調査し、市場概要、市場影響因子および市場機会の分析、法規制環境、新興技術および技術開発の動向、市場規模の推移・予測、各種区分・地域別の詳細分析、競合情勢、主要企業のプロファイルなどをまとめています。
目次
第1章 エグゼクティブサマリー
- 市場見通し
- 調査範囲
- 市場概要
第2章 市場概要
- 概要
- 水処理の手法:概要
- 物理的な汚染物質の除去
- ナノろ過:概要
- ナノろ過技術の必要性
- ナノろ過プロセス
第3章 市場力学
- 市場力学
- 市場促進要因
- 逆浸透膜に対する利点
- 廃水処理への政府の介入
- 淡水化プロセスにおける応用
- 抑制要因と課題
- エネルギー集約型
- 膜汚染が発生しやすい
- 機会
- 非化学薬品による水処理への需要の増加
- ナノろ過技術の研究開発への注力
第4章 新興技術と開発
- 生体模倣膜と先進膜材料
- スマートナノろ過膜
- ナノろ過膜の3Dプリント
- 特許分析
- 特許の重要性
- 原産国別の特許分析
- 出願人に基づく特許分析
- 発行年に基づく特許分析
第5章 市場セグメンテーション分析
- セグメンテーションの内訳
- 市場分析:材料タイプ別
- 有機材料
- 無機材料
- ハイブリッド素材
- 市場分析:構成別
- 螺旋巻き・管巻き
- 中空繊維
- プレート&フレーム
- 市場分析:フィルタリング技術別
- クロスフロー
- デッドエンド
- 市場分析:用途別
- 水・排水処理
- 食品・飲料
- ライフサイエンス
- 化学・石油化学
- その他
- 地理的内訳
- 地域別市場
- 北米
- アジア太平洋
- 欧州
- その他
第6章 競合情報
- 産業構造
- 世界のナノろ過市場のシェア
- 戦略分析
- 製品発売
- 拡大
- 提携・買収
第7章 ナノろ過産業における持続可能性:ESGの観点
- ナノろ過業界におけるESGの重要性
- ナノろ過業界におけるESGの実践
- BCCによる総論
- 環境目標
- 社会的目標
- ガバナンス目標
第8章 付録
- 調査手法
- 出典
- 略語
- 企業プロファイル
- 3M
- ALFA LAVAL
- DONALDSON CO. INC.
- DUPONT
- HYDRANAUTICS (A NITTO GROUP CO.)
- KOVALUS SEPARATION SOLUTIONS
- MANN+HUMMEL
- NX FILTRATION BV
- PARKER HANNIFIN CORP.
- PROMINENT
- SIMPORE
- SYNDER FILTRATION INC.
- TERAPORE TECHNOLOGIES
- TORAY INDUSTRIES INC.
- VEOLIA
- XYLEM
List of Tables
- Summary Table : Global Market for Nanofiltration, by Application, Through 2029
- Table 1 : Comparison of Membrane Filtration Processes
- Table 2 : Common Properties of Reverse Osmosis and Nanofiltration Technology
- Table 3 : Percentage of Safely Treated Domestic Wastewater, by Country
- Table 4 : Classification of Water Quality
- Table 5 : Developments in Nanofiltration, 2021-2024
- Table 6 : Toxic Solvents Used in Membrane Fabrication and Related Health Effects
- Table 7 : Number of Patents in Nanofiltration, by Country, January 2021 to August 2024
- Table 8 : Number of Patents in Nanofiltration, by Applicant, January 2021 to August 2024
- Table 9 : Patent Trends for Nanofiltration, January 2021 to August 2024
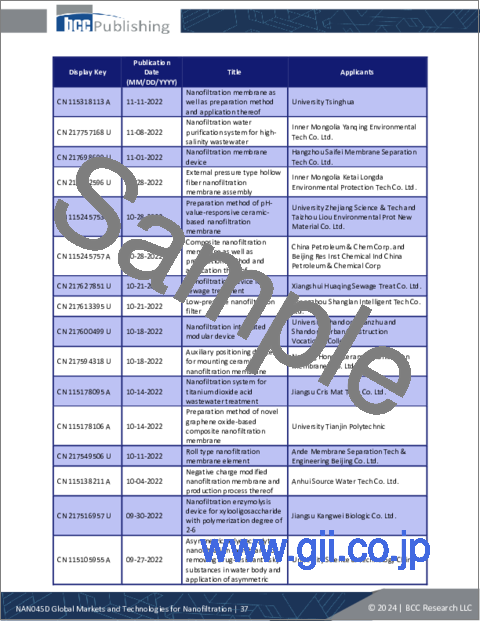
- Table 10 : List of Patents in Nanofiltration, January 2021 to August 2024
- Table 11 : Global Market for Nanofiltration, by Material Type, Through 2029
- Table 12 : Global Market for Organic Materials in Nanofiltration, by Region, Through 2029
- Table 13 : Global Market for Inorganic Materials in Nanofiltration, by Region, Through 2029
- Table 14 : Global Market for Hybrid Materials in Nanofiltration, by Region, Through 2029
- Table 15 : Comparison of Features of Membrane Configurations
- Table 16 : Global Market for Nanofiltration, by Configuration, Through 2029
- Table 17 : Global Market for Spiral Wound and Tubular Configurations in Nanofiltration, by Region, Through 2029
- Table 18 : Global Market for Hollow Fiber Configurations in Nanofiltration, by Region, Through 2029
- Table 19 : Global Market for Plate-and-Frame Configurations in Nanofiltration, by Region, Through 2029
- Table 20 : Global Market for Nanofiltration, by Filtering Technique, Through 2029
- Table 21 : Global Market for Crossflow Filtering Technique in Nanofiltration, by Region, Through 2029
- Table 22 : Global Market for Dead-End Filtering Technique in Nanofiltration, by Region, Through 2029
- Table 23 : Global Market for Nanofiltration, by Application, Through 2029
- Table 24 : Global Market for Water and Wastewater Treatment Application in Nanofiltration, by Region, Through 2029
- Table 25 : Global Market for Food and Beverage Applications in Nanofiltration, by Region, Through 2029
- Table 26 : Applications of Nanofiltration in Life Sciences
- Table 27 : Global Market for Life Sciences Applications in Nanofiltration, by Region, Through 2029
- Table 28 : Global Market for Chemical and Petrochemical Applications in Nanofiltration, by Region, Through 2029
- Table 29 : Global Market for Other Applications in Nanofiltration, by Region, Through 2029
- Table 30 : Global Market for Nanofiltration, by Region, Through 2029
- Table 31 : North American Market for Nanofiltration, by Country, Through 2029
- Table 32 : North American Market for Nanofiltration, by Material Type, Through 2029
- Table 33 : North American Market for Nanofiltration, by Configuration, Through 2029
- Table 34 : North American Market for Nanofiltration, by Filtering Technique, Through 2029
- Table 35 : North American Market for Nanofiltration, by Application, Through 2029
- Table 36 : Asia-Pacific Market for Nanofiltration, by Country, Through 2029
- Table 37 : Asia-Pacific Market for Nanofiltration, by Material Type, Through 2029
- Table 38 : Asia-Pacific Market for Nanofiltration, by Configuration, Through 2029
- Table 39 : Asia-Pacific Market for Nanofiltration, by Filtering Technique, Through 2029
- Table 40 : Asia-Pacific Market for Nanofiltration, by Application, Through 2029
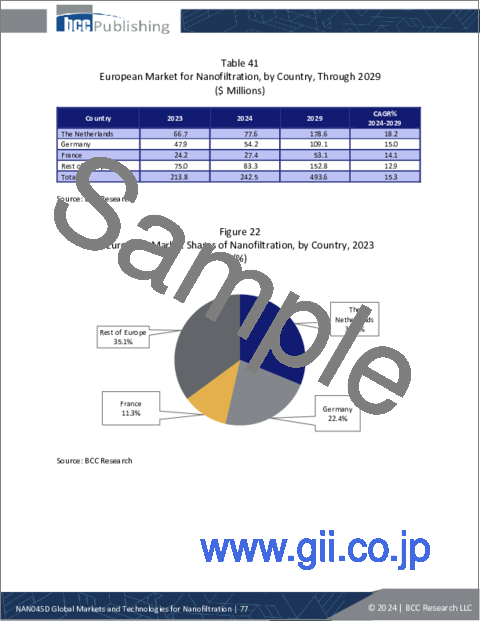
- Table 41 : European Market for Nanofiltration, by Country, Through 2029
- Table 42 : European Market for Nanofiltration, by Material Type, Through 2029
- Table 43 : European Market for Nanofiltration, by Configuration, Through 2029
- Table 44 : European Market for Nanofiltration, by Filtering Technique, Through 2029
- Table 45 : European Market for Nanofiltration, by Application, Through 2029
- Table 46 : RoW Market for Nanofiltration, by Sub-Region, Through 2029
- Table 47 : RoW Market for Nanofiltration, by Material Type, Through 2029
- Table 48 : RoW Market for Nanofiltration, by Configuration, Through 2029
- Table 49 : RoW Market for Nanofiltration, by Filtering Technique, Through 2029
- Table 50 : RoW Market for Nanofiltration, by Application, Through 2029
- Table 51 : Market Shares of Leading Companies in the Nanofiltration Industry, 2023
- Table 52 : Key Developments in the Nanofiltration Industry, 2022-2024
- Table 53 : Analysis of ESG Diversity Issues
- Table 54 : Analysis of ESG Employee Safety and Labor Practices Issues
- Table 55 : Analysis of ESG Resource Efficiency and Emissions Issues
- Table 56 : Analysis of ESG Waste Reduction Issues
- Table 57 : Analysis of ESG Sustainable Supply Chain Issues
- Table 58 : Analysis of ESG Corporate Behavior Issues
- Table 59 : ESG Goals, by Company, 2023
- Table 60 : Report Sources
- Table 61 : Abbreviations Used in this Report
- Table 62 : 3M: Company Snapshot
- Table 63 : 3M: Financial Performance, FY 2022 and 2023
- Table 64 : 3M: Product Portfolio
- Table 65 : Alfa Laval: Company Snapshot
- Table 66 : Alfa Laval Inc.: Financial Performance, FY 2022 and 2023
- Table 67 : Alfa Laval Inc.: Product Portfolio
- Table 68 : Alfa Laval Inc.: Key Developments, 2022
- Table 69 : Donaldson Co. Inc.: Company Snapshot
- Table 70 : Donaldson Co. Inc.: Financial Performance, FY 2022 and 2023
- Table 71 : Donaldson Co. Inc.: Product Portfolio
- Table 72 : DuPont: Company Snapshot
- Table 73 : DuPont: Financial Performance, FY 2022 and 2023
- Table 74 : DuPont: Product Portfolio
- Table 75 : DuPont: Key Developments, 2023 and 2024
- Table 76 : Hydranautics (A Nitto Group Co.): Company Snapshot
- Table 77 : Hydranautics (A Nitto Group Co.): Product Portfolio
- Table 78 : Kovalus Separation Solutions: Company Snapshot
- Table 79 : Kovalus Separation Solutions: Product Portfolio
- Table 80 : Kovalus Separation Solutions: Key Developments, 2024
- Table 81 : MANN+HUMMEL: Company Snapshot
- Table 82 : MANN+HUMMEL: Financial Performance, FY 2022 and 2023
- Table 83 : MANN+HUMMEL: Product Portfolio
- Table 84 : NX Filtration BV: Company Snapshot
- Table 85 : NX Filtration BV: Financial Performance, FY 2022 and 2023
- Table 86 : NX Filtration BV: Product Portfolio
- Table 87 : NX Filtration BV: Key Developments, 2022-2024
- Table 88 : Parker Hannifin Corp.: Company Snapshot
- Table 89 : Parker Hannifin Corp.: Financial Performance, FY 2022 and 2023
- Table 90 : Parker Hannifin Corp.: Product Portfolio
- Table 91 : Parker Hannifin Corp.: Key Developments, 2023
- Table 92 : ProMinent: Company Snapshot
- Table 93 : ProMinent: Product Portfolio
- Table 94 : SiMPore: Company Snapshot
- Table 95 : SiMPore: Product Portfolio
- Table 96 : Synder Filtration Inc.: Company Snapshot
- Table 97 : Synder Filtration Inc.: Product Portfolio
- Table 98 : TeraPore Technologies: Company Snapshot
- Table 99 : TeraPore Technologies: Product Portfolio
- Table 100 : TeraPore Technologies: Key Development, 2023
- Table 101 : Toray Industries Inc.: Company Snapshot
- Table 102 : Toray Industries Inc.: Financial Performance, FY 2022 and 2023
- Table 103 : Toray Industries Inc.: Product Portfolio
- Table 104 : Toray Industries Inc.: Key Developments, 2022
- Table 105 : Veolia: Company Snapshot
- Table 106 : Veolia: Financial Performance, FY 2022 and 2023
- Table 107 : Veolia: Product Portfolio
- Table 108 : Veolia: Key Developments, 2024
- Table 109 : Xylem: Company Snapshot
- Table 110 : Xylem: Financial Performance, FY 2022 and 2023
- Table 111 : Xylem: Product Portfolio
- Table 112 : Xylem: Key Developments, 2023 and 2024
List of Figures
- Summary Figure : Global Market for Nanofiltration, by Application, 2023-2029
- Figure 1 : Water Treatment Methods
- Figure 2 : Nanofiltration Process
- Figure 3 : Market Dynamics of Nanofiltration
- Figure 4 : Number of Countries Safely Treating Domestic Wastewater Flows, 2022
- Figure 5 : Causes of NF Membrane Fouling
- Figure 6 : Number of Patents in Nanofiltration, by Year Issued, January 2021 to August 2024
- Figure 7 : Global Market Shares of Nanofiltration, by Material Type, 2023
- Figure 8 : Global Market Shares of Nanofiltration, by Configuration, 2023
- Figure 9 : Global Market Shares of Nanofiltration, by Filtering Technique, 2023
- Figure 10 : Global Market Shares of Nanofiltration, by Application, 2023
- Figure 11 : Global Market Shares of Nanofiltration, by Region, 2023
- Figure 12 : North American Market Shares of Nanofiltration, by Country, 2023
- Figure 13 : North American Market Shares of Nanofiltration, by Material Type, 2023
- Figure 14 : North American Market Shares of Nanofiltration, by Configuration, 2023
- Figure 15 : North American Market Shares of Nanofiltration, by Filtering Technique, 2023
- Figure 16 : North American Market Shares of Nanofiltration, by Application, 2023
- Figure 17 : Asia-Pacific Market Shares of Nanofiltration, by Country, 2023
- Figure 18 : Asia-Pacific Market Shares of Nanofiltration, by Material Type, 2023
- Figure 19 : Asia-Pacific Market Shares of Nanofiltration, by Configuration, 2023
- Figure 20 : Asia-Pacific Market Shares of Nanofiltration, by Filtering Technique, 2023
- Figure 21 : Asia-Pacific Market Shares of Nanofiltration, by Application, 2023
- Figure 22 : European Market Shares of Nanofiltration, by Country, 2023
- Figure 23 : European Market Shares of Nanofiltration, by Material Type, 2023
- Figure 24 : European Market Shares of Nanofiltration, by Configuration, 2023
- Figure 25 : European Market Shares of Nanofiltration, by Filtering Technique, 2023
- Figure 26 : European Market Shares of Nanofiltration, by Application, 2023
- Figure 27 : RoW Market Shares of Nanofiltration, by Sub-Region, 2023
- Figure 28 : RoW Market Shares of Nanofiltration, by Material Type, 2023
- Figure 29 : RoW Market Shares of Nanofiltration, by Configuration, 2023
- Figure 30 : RoW Market Shares of Nanofiltration, by Filtering Technique, 2023
- Figure 31 : RoW Market Shares of Nanofiltration, by Application, 2023
- Figure 32 : Overview of ESG Factors
- Figure 33 : Research Methodology: Top-Down Approach
- Figure 34 : 3M: Revenue Share, by Business Unit, FY 2023
- Figure 35 : 3M: Revenue Share, by Country/Region, FY 2023
- Figure 36 : Alfa Laval Inc.: Revenue Share, by Business Unit, FY 2023
- Figure 37 : Alfa Laval Inc.: Revenue Share, by Country/Region, FY 2023
- Figure 38 : Donaldson Co. Inc.: Revenue Share, by Business Unit, FY 2023
- Figure 39 : Donaldson Co. Inc.: Revenue Share, by Country/Region, FY 2023
- Figure 40 : DuPont: Revenue Share, by Business Unit, FY 2023
- Figure 41 : DuPont: Revenue Share, by Country/Region, FY 2023
- Figure 42 : MANN+HUMMEL: Revenue Share, by Business Unit, FY 2023
- Figure 43 : MANN+HUMMEL: Revenue Share, by Country/Region, FY 2023
- Figure 44 : NX Filtration BV: Revenue Share, by Business Unit, FY 2023
- Figure 45 : NX Filtration BV: Revenue Share, by Country/Region, FY 2023
- Figure 46 : Parker Hannifin Corp.: Revenue Share, by Business Unit, FY 2023
- Figure 47 : Parker Hannifin Corp.: Revenue Share, by Country/Region, FY 2023
- Figure 48 : Toray Industries Inc.: Revenue Share, by Business Unit, FY 2023
- Figure 49 : Toray Industries Inc.: Revenue Share, by Country/Region, FY 2023
- Figure 50 : Veolia: Revenue Share, by Business Unit, FY 2023
- Figure 51 : Veolia: Revenue Share, by Country/Region, FY 2023
- Figure 52 : Xylem: Revenue Share, by Business Unit, FY 2023
- Figure 53 : Xylem: Revenue Share, by Country/Region, FY 2023
The global market for nanofiltration is expected to grow from $1.5 billion in 2024 and is projected to reach $3.4 billion by the end of 2029, at a compound annual growth rate (CAGR) of 17.6% during the forecast period of 2024 to 2029.
Report Scope
This report studies the global nanofiltration market for 2023 to 2029. In this report, 2023 is the base year, and 2024 to the end of 2029 is the forecast period. The revenue calculated in this report is in millions of U.S. dollars. This report entails an in-depth analysis of the nanofiltration industry in a qualitative and quantitative manner. The market is segmented by:
- Material type: Organic, inorganic and hybrid.
- Configuration: Spiral wound and tubular, hollow fiber and plate-and-frame.
- Filtering technique: Crossflow and dead-end.
- Application: Water and wastewater treatment, food and beverages, life sciences, chemical and petrochemical and others.
Report Includes
- 52 data tables and 61 additional tables
- An overview of the global markets and technologies for nanofiltration
- Analyses of the global market trends, with data from 2023, estimates for 2024, and projections of compound annual growth rates (CAGRs) through 2029
- Estimate of the market size and a revenue forecast for the global nanofiltration market, and a corresponding market share analysis by material type, configuration, filtering technique, application, and region
- Insight into new technological developments related to nanofiltration, while outlining current technical issues
- Information on global R&D activity related to nanofiltration membranes, resulting in the issuance of patents
- Analysis of the industry's regulatory framework and policies, and product pipeline
- A discussion of ESG challenges and ESG practices in the nanofiltration industry
- A market share analysis of the key companies of the industry and coverage of their proprietary technologies, alliances, and other market strategies
- Profiles of the leading players, including Veolia Environnement S.A., 3M, Donaldson Co., and Xylem Inc.
Table of Contents
Chapter 1 Executive Summary
- Market Outlook
- Scope of Report
- Market Summary
Chapter 2 Market Overview
- Overview
- Introduction to Water Treatment Methods
- Physical Contaminant Removal
- Introduction to Nanofiltration
- Need for Nanofiltration Technology
- Nanofiltration Process
Chapter 3 Market Dynamics
- Market Dynamics
- Market Drivers
- Advantages over Reverse Osmosis
- Government Intervention in Wastewater Treatment
- Applications in the Desalination Process
- Restraints and Challenges
- Energy-Intensive
- Prone to Membrane Contamination
- Opportunities
- Rise in Demand for Non-Chemical Water Treatment
- Focus on R&D on Nanofiltration Technologies
Chapter 4 Emerging Technologies and Developments
- Biomimetic Membranes and Advanced Membrane Materials
- Smart Nanofiltration Membrane
- 3D Printing in Nanofiltration Membranes
- Patent Analysis
- Significance of Patents
- Patent Analysis Based on Country of Origin
- Patent Analysis Based on Applicants
- Patent Analysis Based on Year Issued
Chapter 5 Market Segmentation Analysis
- Segmentation Breakdown
- Market Analysis by Material Type
- Organic Material
- Inorganic Materials
- Hybrid Material
- Market by Configuration
- Spiral Wound and Tubular
- Hollow Fiber
- Plate-and-Frame
- Market by Filtering Technique
- Crossflow
- Dead-End
- Market by Application
- Water and Wastewater Treatment
- Food and Beverages
- Life Sciences
- Chemical and Petrochemical
- Other Applications
- Geographic Breakdown
- Market by Region
- North America
- Asia-Pacific
- Europe
- Rest of World
Chapter 6 Competitive Intelligence
- Industry Structure
- Shares of Global Nanofiltration Market
- Strategic Analysis
- Product Launch
- Expansion
- Partnerships and Acquisitions
Chapter 7 Sustainability in the Nanofiltration Industry: An ESG Perspective
- Importance of ESG in the Nanofiltration Industry
- ESG Practices in the Nanofiltration Industry
- Concluding Remarks from BCC
- Environmental Goals
- Social Goals
- Governance Goals
Chapter 8 Appendix
- Methodology
- Sources
- Abbreviations
- Company Profiles
- 3M
- ALFA LAVAL
- DONALDSON CO. INC.
- DUPONT
- HYDRANAUTICS (A NITTO GROUP CO.)
- KOVALUS SEPARATION SOLUTIONS
- MANN+HUMMEL
- NX FILTRATION BV
- PARKER HANNIFIN CORP.
- PROMINENT
- SIMPORE
- SYNDER FILTRATION INC.
- TERAPORE TECHNOLOGIES
- TORAY INDUSTRIES INC.
- VEOLIA
- XYLEM


