|
|
市場調査レポート
商品コード
1550161
持続可能包装:世界市場Sustainable Packaging: Global Markets |
||||||
|
|||||||
|
|||||||

| 持続可能包装:世界市場 |
|
出版日: 2024年09月04日
発行: BCC Research
ページ情報: 英文 141 Pages
納期: 即納可能
|

全表示
- 概要
- 図表
- 目次
世界の持続可能包装の市場規模は、2023年の2,781億米ドルから、予測期間中はCAGR 6.0%で推移し、2029年には3,911億米ドルの規模に達すると予測されています。
欧州地域は、2023年の1,116億米ドルから、CAGR 6.8%で推移し、2029年には1,633億米ドルに達すると予測されています。また、アジア太平洋地域は、2023年の786億米ドルから、CAGR 6.2%で推移し、2029年には1,119億米ドルに達すると予測されています。
当レポートでは、世界の持続可能包装の市場を調査し、市場概要、市場影響因子および市場機会の分析、法規制環境、新興技術および技術開発の動向、市場規模の推移・予測、各種区分・地域別の詳細分析、競合情勢、主要企業のプロファイルなどをまとめています。
目次
第1章 エグゼクティブサマリー
- 市場見通し
- 調査範囲
- 市場概要
第2章 市場概要
- 包装業界
- 定義:持続可能包装
- 包装廃棄物
- サプライチェーン分析
- ポーターのファイブフォース分析
第3章 市場力学
- 概要
- 市場促進要因
- 紙および紙包装のリサイクル性の向上
- リサイクル素材を使用した包装材への高い需要
- 効率性と環境目標を達成するための再利用可能な包装の成長
- 市場機会
- ヘルスケア業界における持続可能な包装の重要性
- 持続可能包装分野における技術の進歩
- 再利用可能な包装に関する環境意識、規制、循環型経済の取り組み
- 市場の課題
- プラスチックリサイクル率の低さ
- 持続可能な素材と比較した使い捨てプラスチックコストの低さ
第4章 規制状況
- 規制分析
第5章 新興技術
- バイオプラスチック包装の進歩
- リサイクル技術
- プラスチックリサイクル技術
- 紙リサイクル技術
- 金属リサイクル技術
- ガラスリサイクル技術
第6章 市場セグメンテーション分析
- セグメンテーションの内訳
- 素材別
- 紙
- プラスチック
- 金属
- その他
- プロセス別
- リサイクル包装
- 再利用可能な包装
- 生分解性およびバイオベースの包装
- エンドユーザー別
- 食品・飲料
- 工業・化学
- ヘルスケア
- パーソナルケア・ホームケア
- その他
- 地理的内訳
- 地域別
- 北米
- 欧州
- アジア太平洋
- その他の地域
第7章 競合情勢
- 市場競争力
- 市場参入企業のポジショニング
- 市場参入企業のポジショニング分析
- 戦略分析
- M&A分析
第8章 持続可能包装産業における持続可能性:ESGの観点
- 持続可能包装業界におけるESGの重要性
- 持続可能包装業界におけるESGの実践
- 新たな持続可能性の動向
- BCCからの結論
第9章 付録
- 調査手法
- 情報源
- 参考文献
- 略語
- 企業プロファイル
- 3M
- AMCOR PLC
- ARDAGH GROUP S.A.
- BALL CORP.
- BERRY GLOBAL INC.
- DUPONT
- HUHTAMAKI
- INTERNATIONAL PAPER
- MONDI
- NATUREWORKS LLC.
- PLASTIPAK HOLDINGS INC.
- SONOCO PRODUCTS CO.
- STOELZLE GLASS GROUP
- SMURFIT WESTROCK
- SEALED AIR
- TETRA PAK INTERNATIONAL S.A.
List of Tables
- Summary Table : Global Market for Sustainable Packaging, by Region, Through 2029
- Table 1 : Regulations/Standards/Certification for the Recycled Packaging Market, 2024
- Table 2 : Regulations on Bio-Based Plastic Packaging Market, 2024
- Table 3 : Global Market for Sustainable Packaging, by Material, Through 2029
- Table 4 : Global Market for Sustainable Paper Packaging, by Type, Through 2029
- Table 5 : Global Market for Sustainable Paper Packaging, by Region, Through 2029
- Table 6 : Global Market for Sustainable Plastic Packaging, by Type, Through 2029
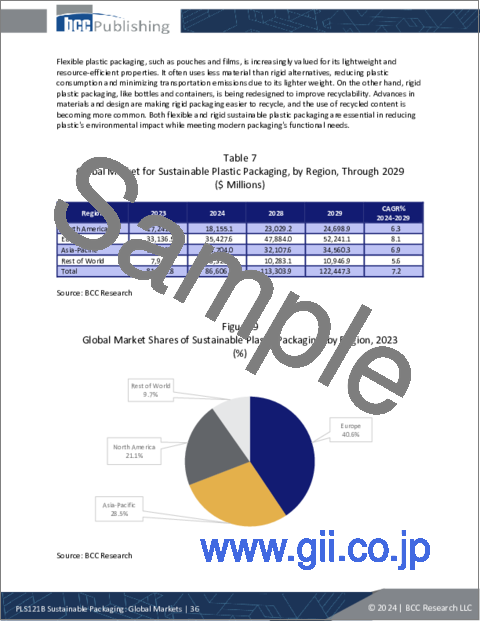
- Table 7 : Global Market for Sustainable Plastic Packaging, by Region, Through 2029
- Table 8 : Global Market of Sustainable Metal Packaging, by Region, Through 2029
- Table 9 : Global Market for Sustainable Other Materials Packaging, by Region, Through 2029
- Table 10 : Global Market for Sustainable Packaging, by Process, Through 2029
- Table 11 : Global Market for Recycled Packaging, by Region, Through 2029
- Table 12 : Global Market for Reusable Packaging, by Region, Through 2029
- Table 13 : Global Market of Biodegradable and Bio-Based Packaging, by Region, Through 2029
- Table 14 : Global Market for Sustainable Packaging, by End User, Through 2029
- Table 15 : Global Market for Sustainable Packaging for Food and Beverage End Users, by Region, Through 2029
- Table 16 : Global Market for Sustainable Packaging for Industrial and Chemical End Users, by Region, Through 2029
- Table 17 : Global Market for Sustainable Packaging for Healthcare End Users, by Region, Through 2029
- Table 18 : Global Market for Sustainable Packaging for Personal and Home Care End User, by Region, Through 2029
- Table 19 : Global Market for Sustainable Packaging for Other End Users, by Region, Through 2029
- Table 20 : Global Market for Sustainable Packaging, by Region, Through 2029
- Table 21 : North American Market for Sustainable Packaging, by Country, Through 2029
- Table 22 : North American Market for Sustainable Packaging, by Material, Through 2029
- Table 23 : North American Market for Sustainable Paper Packaging, by Type, Through 2029
- Table 24 : North American Market for Sustainable Plastic Packaging, by Type, Through 2029
- Table 25 : North American Market for Sustainable Packaging, by Process, Through 2029
- Table 26 : North American Market of Sustainable Packaging, by End User, Through 2029
- Table 27 : European Market for Sustainable Packaging, by Country, Through 2029
- Table 28 : European Market for Sustainable Packaging, by Material, Through 2029
- Table 29 : European Market for Sustainable Paper Packaging, by Type, Through 2029
- Table 30 : European Market for Sustainable Plastic Packaging, by Type, Through 2029
- Table 31 : European Market for Sustainable Packaging, by Process, Through 2029
- Table 32 : European Market of Sustainable Packaging, by End User, Through 2029
- Table 33 : Asia-Pacific Market for Sustainable Packaging, by Country, Through 2029
- Table 34 : Asia-Pacific Market for Sustainable Packaging, by Material, Through 2029
- Table 35 : Asia-Pacific Market for Sustainable Paper Packaging, by Type, Through 2029
- Table 36 : Asia-Pacific Market of Sustainable Plastic Packaging, by Type, Through 2029
- Table 37 : Asia-Pacific Market for Sustainable Packaging, by Process, Through 2029
- Table 38 : Asia-Pacific Market for Sustainable Packaging, by End User, Through 2029
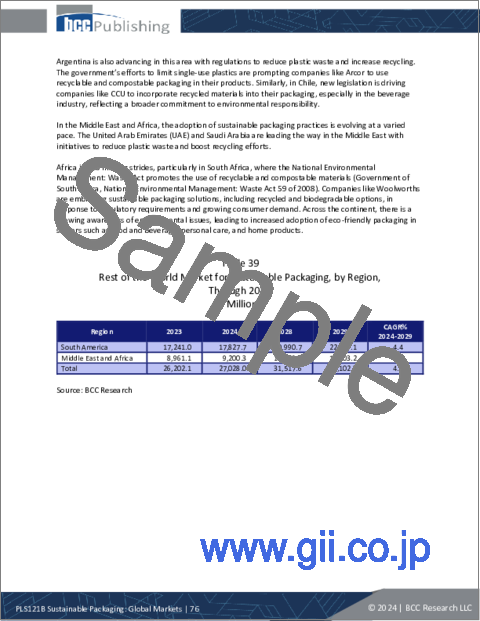
- Table 39 : Rest of the World Market for Sustainable Packaging, by Region, Through 2029
- Table 40 : Rest of the World Market for Sustainable Packaging, by Material, Through 2029
- Table 41 : Rest of the World Market for Sustainable Paper Packaging, by Type, Through 2029
- Table 42 : Rest of the World Market for Sustainable Plastic Packaging, by Type, Through 2029
- Table 43 : Rest of the World Market for Sustainable Packaging, by Process, Through 2029
- Table 44 : Rest of the World Market for Sustainable Packaging, by End User, Through 2029
- Table 45 : Mergers and Acquisitions in the Global Market for Sustainable Packaging, 2023-2024
- Table 46 : ESG Carbon Footprint Issue Analysis
- Table 47 : Acronyms Used in This Report
- Table 48 : 3M: Company Snapshot
- Table 49 : 3M: Financial Performance, F.Y. 2022 and 2023
- Table 50 : 3M: Product Portfolio
- Table 51 : 3M: News/Key Developments, 2022-2024
- Table 52 : Amcor plc: Company Snapshot
- Table 53 : Amcor plc: Financial Performance, FY 2022 and 2023
- Table 54 : Amcor plc: Product Portfolio
- Table 55 : Amcor plc: News/Key Developments, 2023 and 2024
- Table 56 : Ardagh Group S.A.: Company Snapshot
- Table 57 : Ardagh Group S.A.: Financial Performance, FY 2022 and 2023
- Table 58 : Ardagh Group S.A.: Product Portfolio
- Table 59 : Ardagh Group S.A.: News/Key Developments, 2023 and 2024
- Table 60 : Ball Corp.: Company Snapshot
- Table 61 : Ball Corp.: Financial Performance, F.Y. 2022 and 2023
- Table 62 : Ball Corp.: Product Portfolio
- Table 63 : Ball Corp.: News/Key Developments, 2022-2024
- Table 64 : Berry Global Inc.: Company Snapshot
- Table 65 : Berry Global Inc.: Financial Performance, FY 2022 and 2023
- Table 66 : Berry Global Inc.: Product Portfolio
- Table 67 : Berry Global Inc.: News/Key Developments, 2023 and 2024
- Table 68 : DuPont: Company Snapshot
- Table 69 : DuPont: Financial Performance, FY 2022 and 2023
- Table 70 : DuPont: Product Portfolio
- Table 71 : DuPont: News/Key Developments, 2024
- Table 72 : Huhtamaki: Company Snapshot
- Table 73 : Huhtamaki: Financial Performance, FY 2022 and 2023
- Table 74 : Huhtamaki: Product Portfolio
- Table 75 : Huhtamaki: News/Key Developments, 2023
- Table 76 : International Paper: Company Snapshot
- Table 77 : International Paper: Financial Performance, FY 2022 and 2023
- Table 78 : International Paper: Product Portfolio
- Table 79 : International Paper: News/Key Developments, 2023 and 2024
- Table 80 : Mondi: Company Snapshot
- Table 81 : Mondi: Financial Performance, FY 2022 and 2023
- Table 82 : Mondi: Product Portfolio
- Table 83 : Mondi: News/Key Developments, 2023 and 2024
- Table 84 : NatureWorks LLC.: Company Snapshot
- Table 85 : NatureWorks LLC.: Product Portfolio
- Table 86 : Plastipak Holdings Inc.: Company Snapshot
- Table 87 : Plastipak Holdings Inc.: Product Portfolio
- Table 88 : Plastipak Holdings Inc.: News/Key Developments, 2023 and 2024
- Table 89 : Sonoco Products Co.: Company Snapshot
- Table 90 : Sonoco Products Co.: Financial Performance, FY 2022 and 2023
- Table 91 : Sonoco Products Co.: Product Portfolio
- Table 92 : Sonoco Products Co.: News/Key Developments, 2023
- Table 93 : Stoelzle Glass Group: Company Snapshot
- Table 94 : Stoelzle Glass Group: Product Portfolio
- Table 95 : Smurfit Westrock: Company Snapshot
- Table 96 : Smurfit Westrock: Product Portfolio
- Table 97 : Sealed Air: Company Snapshot
- Table 98 : Sealed Air: Financial Performance, FY 2022 and 2023
- Table 99 : Sealed Air: Product Portfolio
- Table 100 : Sealed Air: News/Key Developments, 2023 and 2024
- Table 101 : Tetra Pak International S.A.: Company Snapshot
- Table 102 : Tetra Pak International S.A.: Product Portfolio
- Table 103 : Tetra Pak International S.A.: News/Key Developments, 2024
List of Figures
- Summary Figure : Global Market for Sustainable Packaging, by Region, 2023-2029
- Figure 1 : Ecosystem of Supply Chain Partners: Sustainable Packaging
- Figure 2 : Porter's Five Forces Analysis: Market for Sustainable Packaging
- Figure 3 : Market Dynamics of Sustainable Packaging
- Figure 4 : Potential Market for Chemical Recycling, 2022
- Figure 5 : Global Market Shares of Sustainable Packaging, by Material, 2023
- Figure 6 : Global Market Shares of Sustainable Paper Packaging, by Type, 2023
- Figure 7 : Global Market Shares of Sustainable Paper Packaging, by Region, 2023
- Figure 8 : Global Market Shares of Sustainable Plastic Packaging, by Type, 2023
- Figure 9 : Global Market Shares of Sustainable Plastic Packaging, by Region, 2023
- Figure 10 : Global Market Shares for Sustainable Metal Packaging, by Region, 2023
- Figure 11 : Global Market Shares of Sustainable Other Materials Packaging, by Region, 2023
- Figure 12 : Global Market Shares of Sustainable Packaging, by Process, 2023
- Figure 13 : Global Market Shares of Recycled Packaging, by Region, 2023
- Figure 14 : Global Market Shares of Reusable Packaging, by Region, 2023
- Figure 15 : Global Market Shares of Biodegradable and Bio-Based Packaging, by Region, 2023
- Figure 16 : Global Market Shares of Sustainable Packaging, by End User, 2023
- Figure 17 : Global Market Shares of Sustainable Packaging for Food and Beverage End Users, by Region, 2023
- Figure 18 : Global Market Shares of Sustainable Packaging for Industrial and Chemical End Users, by Region, 2023
- Figure 19 : Global Market Shares of Sustainable Packaging for Healthcare End Users, by Region, 2023
- Figure 20 : Global Market Shares of Sustainable Packaging for Personal and Home Care End User, by Region, 2023
- Figure 21 : Global Market Shares of Sustainable Packaging for Other End User, by Region, 2023
- Figure 22 : Global Market Shares of Sustainable Packaging, by Region, 2023
- Figure 23 : North American Market Shares of Sustainable Packaging, by Country, 2023
- Figure 24 : North American Market Shares of Sustainable Packaging, by Material, 2023
- Figure 25 : North American Market Shares of Sustainable Paper Packaging, by Type, 2023
- Figure 26 : North American Market Shares of Sustainable Plastic Packaging, by Type, 2023
- Figure 27 : North American Market Shares of Sustainable Packaging, by Process, 2023
- Figure 28 : North American Market Shares of Sustainable Packaging, by End User, 2023
- Figure 29 : European Market Shares of Sustainable Packaging, by Country, 2023
- Figure 30 : European Market Shares of Sustainable Packaging, by Material, 2023
- Figure 31 : European Market Shares of Sustainable Paper Packaging, by Type, 2023
- Figure 32 : European Market Shares of Sustainable Plastic Packaging, by Type, 2023
- Figure 33 : European Market Shares of Sustainable Packaging, by Process, 2023
- Figure 34 : European Market Shares of Sustainable Packaging, by End User, 2023
- Figure 35 : Asia-Pacific Market Shares of Sustainable Packaging, by Country, 2023
- Figure 36 : Asia-Pacific Market Shares of Sustainable Packaging, by Material, 2023
- Figure 37 : Asia-Pacific Market Shares of Sustainable Paper Packaging, by Type, 2023
- Figure 38 : Asia-Pacific Market Shares of Sustainable Plastic Packaging, by Type, 2023
- Figure 39 : Asia-Pacific Market Shares of Sustainable Packaging, by Process, 2023
- Figure 40 : Asia-Pacific Market Shares of Sustainable Packaging, by End User, 2023
- Figure 41 : Rest of the World Market Shares of Sustainable Packaging, by Region, 2023
- Figure 42 : Rest of the World Market Shares of Sustainable Packaging, by Material, 2023
- Figure 43 : Rest of the World Market Shares of Sustainable Paper Packaging, by Type, 2023
- Figure 44 : Rest of the World Market Shares of Sustainable Plastic Packaging, by Type, 2023
- Figure 45 : Rest of the World Market Shares of Sustainable Packaging, by Process, 2023
- Figure 46 : Rest of the World Market Shares of Sustainable Packaging, by End User, 2023
- Figure 47 : Market Entry Strategies: Suggestions for Small- and Medium-Sized Players
- Figure 48 : Market Player Positioning Analysis
- Figure 49 : ESG Factors in the Market for Sustainable Packaging
- Figure 50 : 3M: Revenue Shares, by Business Unit, F.Y. 2023
- Figure 51 : 3M: Revenue Share, by Country/Region, F.Y. 2023
- Figure 52 : Amcor plc: Revenue Shares, by Business Unit, FY 2023
- Figure 53 : Amcor plc: Revenue Share, by Country/Region, FY 2023
- Figure 54 : Ardagh Group S.A.: Revenue Shares, by Business Unit, FY 2023
- Figure 55 : Ardagh Group S.A.: Revenue Share, by Country/Region, FY 2023
- Figure 56 : Ball Corp.: Revenue Shares, by Business Unit, F.Y. 2023
- Figure 57 : Ball Corp.: Revenue Share, by Country/Region, F.Y. 2023
- Figure 58 : Berry Global Inc.: Revenue Shares, by Business Unit, FY 2023
- Figure 59 : Berry Global Inc.: Revenue Share, by Country/Region, FY 2023
- Figure 60 : DuPont: Revenue Shares, by Business Unit, FY 2023
- Figure 61 : DuPont: Revenue Share, by Country/Region, FY 2023
- Figure 62 : Huhtamaki: Revenue Shares, by Business Unit, FY 2023
- Figure 63 : Huhtamaki: Revenue Share, by Country/Region, FY 2023
- Figure 64 : International Paper: Revenue Shares, by Business Unit, FY 2023
- Figure 65 : International Paper: Revenue Share, by Country/Region, FY 2023
- Figure 66 : Mondi: Revenue Shares, by Business Unit, FY 2023
- Figure 67 : Mondi: Revenue Share, by Country/Region, FY 2023
- Figure 68 : Sonoco Products Co.: Revenue Shares, by Business Unit, FY 2023
- Figure 69 : Sonoco Products Co.: Revenue Share, by Country/Region, FY 2023
- Figure 70 : Sealed Air: Revenue Shares, by Business Unit, FY 2023
- Figure 71 : Sealed Air: Revenue Share, by Country/Region, FY 2023
- Figure 72 : Tetra Pak International S.A.: Revenue Share, by Country/Region, FY 2023
The global market for sustainable packaging is estimated to increase from $278.1 billion in 2023 to reach $391.1 billion by 2029, at a compound annual growth rate (CAGR) of 6.0% from 2024 through 2029.
The European market for sustainable packaging is estimated to increase from $111.6 billion in 2023 to reach $163.3 billion by 2029, at a CAGR of 6.8% from 2024 through 2029.
The Asia-Pacific market for sustainable packaging is estimated to increase from $78.6 billion in 2023 to reach $111.9 billion by 2029, at a CAGR of 6.2% from 2024 through 2029.
Report Scope:
This report analyzes the global sustainable packaging market, segmenting it based on material, process, and end user. Materials include paper, plastic, metal, and others (such as glass, wood, and textile). The paper-based packaging segment is further divided into corrugated/cardboard, boxboard/carton board, and flexible paper. Plastic-based packaging is divided into flexible and rigid packaging.
Based on the process, the market is further segmented into recycled, reusable, and biodegradable and bio-based packaging. The sustainable packaging market is segmented based on end user into food and beverage, industrial and chemical, healthcare, personal and home care, and others.
These market segments are analyzed at the global and regional levels. The base year for this analysis is 2023, and market estimates and forecasts are given from 2024 through 2029. The market estimates are provided in terms of revenue (in millions of U.S. dollars).
Report Includes:
- 54 data tables and 49 additional tables
- An overview of the global market for sustainable packaging
- Analyses of the global market trends, with data from 2021-2023, estimates for 2024, and projections of compound annual growth rates (CAGRs) through 2029
- Evaluation of the market potential for sustainable packaging materials, based on material, process, end use, region and country
- Coverage of the latest technological developments in the industry
- Discussion of environmental issues concerning the use of plastic packaging material, the production of eco-friendly material packaging for food and beverages and consumer goods industries and the stringent government regulation of packaging materials
- Overview of the sustainability trends and ESG developments in the industry, with emphasis on the ESG practices followed by leading companies, their ESG ratings, and consumer attitudes
- Competitive intelligence, including companies' market shares, recent M&A activity and venture funding
- Company profiles of major players within the industry, including Amcor, Berry Global Inc., International Paper, Smurfit Westrock, and Sealed Air
Table of Contents
Chapter 1 Executive Summary
- Market Outlook
- Scope of Report
- Market Summary
Chapter 2 Market Overview
- Packaging Industry
- Definition: Sustainable Packaging
- Packaging Waste
- Supply Chain Analysis
- Feedstock
- Sustainable Packaging
- Distribution and Logistics
- Consumers
- Porter's Five Forces Analysis
- Bargaining Power of Suppliers: Moderate
- Competition in the Industry: High
- Threat of Substitutes: High
- Threat of Market Entry: Moderate
- Bargaining Power of Buyers: Moderate
Chapter 3 Market Dynamics
- Overview
- Market Drivers
- Increase in Recyclability of Paper and Paper Packaging
- High Demand for Recycled Material-Based Packaging
- Growth in Reusable Packaging to Achieve Efficiency and Environmental Goals
- Market Opportunities
- Importance of Sustainable Packaging in the Healthcare Industry
- Technology Advances in the Sustainable Packaging Sector
- Environmental Awareness, Regulatory Pressures, and Circular Economy Initiatives Regarding Reusable Packaging
- Market Challenges
- Low Plastic Recycling Rate
- Lower Cost of Single-Use Plastic Compared to Sustainable Materials
Chapter 4 Regulatory Landscape
- Regulatory Analysis
Chapter 5 Emerging Technologies
- Advances in Bioplastic Packaging
- Recycling Technology
- Plastic Recycling Technology
- Paper Recycling Technologies
- Metal Recycling Technologies
- Glass Recycling Technologies
Chapter 6 Market Segmentation Analysis
- Segmentation Breakdown
- By Material
- Paper
- Plastics
- Metal
- Other Materials
- By Process
- Recycled Packaging
- Reusable Packaging
- Biodegradable and Bio-Based Packaging
- By End User
- Food and Beverage
- Industrial and Chemical
- Healthcare
- Personal and Home Care
- Other End Users
- Geographic Breakdown
- By Region
- North America
- Europe
- Asia-Pacific
- Rest of the World
Chapter 7 Competitive Landscape
- Market Competitiveness
- Market Player Positioning
- Market Player Positioning Analysis
- Strategic Analysis
- Merger and Acquisition Analysis
Chapter 8 Sustainability in Sustainable Packaging Industry: An ESG Perspective
- Importance of ESG in the Sustainable Packaging Industry
- ESG Practices in the Sustainable Packaging Industry
- Emerging Sustainability Trends
- Concluding Remarks from BCC Research
Chapter 9 Appendix
- Methodology
- Information Sources
- References
- Abbreviations
- Company Profiles
- 3M
- AMCOR PLC
- ARDAGH GROUP S.A.
- BALL CORP.
- BERRY GLOBAL INC.
- DUPONT
- HUHTAMAKI
- INTERNATIONAL PAPER
- MONDI
- NATUREWORKS LLC.
- PLASTIPAK HOLDINGS INC.
- SONOCO PRODUCTS CO.
- STOELZLE GLASS GROUP
- SMURFIT WESTROCK
- SEALED AIR
- TETRA PAK INTERNATIONAL S.A.

