|
|
市場調査レポート
商品コード
1517527
グリーンマイニング:世界市場Green Mining: Global Market |
||||||
|
|||||||
| グリーンマイニング:世界市場 |
|
出版日: 2024年07月18日
発行: BCC Research
ページ情報: 英文 124 Pages
納期: 即納可能
|
全表示
- 概要
- 図表
- 目次
世界のグリーンマイニングの市場規模は、2023年の114億米ドルから、予測期間中はCAGR 7.4%で推移し、2029年には169億米ドルに達すると予測されています。
欧州地域は、2023年の40億米ドルから、CAGR 6.7%で推移し、2029年には57億米ドルに達すると予測されています。また、アジア太平洋地域は、2023年の26億米ドルから、CAGR 9.2%で推移し、2029年には42億米ドルに達すると予測されています。
当レポートでは、世界のグリーンマイニングの市場を調査し、市場概要、市場影響因子および市場機会の分析、新興技術および技術開発の動向、市場規模の推移・予測、各種区分・地域別の詳細分析、競合情勢、主要企業のプロファイルなどをまとめています。
目次
第1章 エグゼクティブサマリー
- 市場見通し
- 調査範囲
- 市場概要
第2章 市場概要
- 概要
- グリーンマイニングの5つの柱
- 材料とエネルギー効率の促進
- 将来に向けた鉱物資源の確保
- 環境と社会への悪影響の最小化
- 業務と組織慣行の改善
- 鉱山閉鎖後の持続可能な土地利用の確保
- サプライチェーン分析
- グリーンマイニング業界の主な規制当局
第3章 市場力学
- 市場力学
- 市場促進要因
- 市場抑制要因
- 市場機会
第4章 新興技術と開発
- 概要
- 最新技術
- AI
- リアルタイム位置情報システム
- 防塵技術
- 直接リチウム抽出
- 液膜エマルジョン技術
- バイオマイニング
- 乾式尾鉱管理
- 地下鉱山におけるハイブリッドディーゼル電気機器
- 主な展開
- 特許分析
第5章 市場セグメンテーション分析
- セグメンテーションの内訳
- 市場分析:掘削タイプ別
- 露天採掘
- 地下採掘
- 市場分析:技術別
- 電力削減
- 排出削減
- 燃料とメンテナンスの削減
- 節水
- その他
- 地理的内訳
- 市場分析:地域別
- 北米
- 欧州
- アジア太平洋
- 南米
- 中東・アフリカ
第6章 競合情報
- 概要
- 主要企業ランキング分析
- 戦略分析
第7章 グリーンマイニング市場における持続可能性:ESGの観点
- グリーンマイニングにおける環境、社会、ガバナンスの重要性
- ESG格付けと指標:データの理解
- グリーンマイニングにおけるESG実践
- グリーンマイニング市場におけるESGの現状
- ESGスコア分析
- リスクスケール、露出スケール、管理スケール
- リスクスケール
- 露出スケール
- 経営規模
- ESGの未来:新たな動向と機会
- BCCによる見解
第8章 付録
- 調査手法
- 参考文献
- 頭字語
- 企業プロファイル
- ANGLO AMERICAN
- BHP
- DUNDEE PRECIOUS METALS INC.
- FREEPORT-MCMORAN
- GLENCORE
- JIANGXI COPPER CORP.
- MA'ADEN
- NEWMONT CORP.
- RIO TINTO
- SUMITOMO METAL MINING CO. LTD.
List of Tables
- Summary Table : Global Market for Green Mining, by Region, Through 2029
- Table 1 : Regulations in Green Mining
- Table 2 : Patents on Green Mining, 2022-2024
- Table 3 : Global Market for Green Mining, by Mining Type, Through 2029
- Table 4 : Global Market for Surface Mining, by Region, Through 2029
- Table 5 : Global Market for Underground Mining, by Region, Through 2029
- Table 6 : Global Market for Green Mining, by Technology, Through 2029
- Table 7 : Global Market for Green Mining in Power Reduction Technology, by Region, Through 2029
- Table 8 : Global Market for Green Mining in Emission Reduction Technology, by Region, Through 2029
- Table 9 : Global Market for Green Mining in Fuel and Maintenance Reduction Technology, by Region, Through 2029
- Table 10 : Global Market for Green Mining in Water Reduction Technology, by Region, Through 2029
- Table 11 : Global Market for Green Mining in Other Technologies, by Region, Through 2029
- Table 12 : Global Market for Green Mining, by Region, Through 2029
- Table 13 : North American Market for Green Mining, by Country, Through 2029
- Table 14 : North American Market for Green Mining, by Mining Type, Through 2029
- Table 15 : North American Market for Green Mining, by Technology, Through 2029
- Table 16 : European Market for Green Mining, by Country, Through 2029
- Table 17 : European Market for Green Mining, by Mining Type, Through 2029
- Table 18 : European Market for Green Mining, by Technology, Through 2029
- Table 19 : Asia-Pacific Market for Green Mining, by Country, Through 2029
- Table 20 : Asia-Pacific Market for Green Mining, by Mining Type, Through 2029
- Table 21 : Asia-Pacific Market for Green Mining, by Technology, Through 2029
- Table 22 : South American Market for Green Mining, by Country, Through 2029
- Table 23 : South American Market for Green Mining, by Mining Type, Through 2029
- Table 24 : South American Market for Green Mining, by Technology, Through 2029
- Table 25 : Middle East and African Market for Green Mining, by Country, Through 2029
- Table 26 : Middle East and African Market for Green Mining, by Mining Type, Through 2029
- Table 27 : Middle East and African Market for Green Mining, by Technology, Through 2029
- Table 28 : Top 5 Players Ranking in the Global Green Mining Market, 2023
- Table 29 : Strategic Collaborations 2022-2024
- Table 30 : Data Interpretation
- Table 31 : ESG Carbon Footprint Issue Analysis
- Table 32 : ESG Water and Waste Reduction Issues Analysis
- Table 33 : ESG Diversity Issue Analysis
- Table 34 : ESG Employee Safety and Labor Practices Issue Analysis
- Table 35 : ESG Sustainable Supply Chain Issue Analysis
- Table 36 : ESG Score Analysis of Green Mining Market
- Table 37 : Risk Scale
- Table 38 : Exposure Scale
- Table 39 : Management Scale
- Table 40 : Acronyms used in this Report
- Table 41 : Anglo American: Company Snapshot
- Table 42 : Anglo American: Financial Performance, FY 2022 and 2023
- Table 43 : Anglo American: Product Portfolio
- Table 44 : Anglo American: News/Key Developments, 2022-2024
- Table 45 : BHP: Company Snapshot
- Table 46 : BHP: Financial Performance, FY 2022 and 2023
- Table 47 : BHP: Product Portfolio
- Table 48 : BHP: News/Key Developments, 2022-2024
- Table 49 : Dundee Precious Metals Inc.: Company Snapshot
- Table 50 : Dundee Precious Metals Inc.: Financial Performance, FY 2022 and 2023
- Table 51 : Dundee Precious Metals Inc.: Product Portfolio
- Table 52 : Dundee Precious Metals Inc.: News/Key Developments, 2022-2024
- Table 53 : Freeport-McMoRan: Company Snapshot
- Table 54 : Freeport-McMoRan: Financial Performance, FY 2022 and 2023
- Table 55 : Freeport-McMoRan: Product Portfolio
- Table 56 : Freeport-McMoRan: News/Key Developments, 2023
- Table 57 : Glencore: Company Snapshot
- Table 58 : Glencore: Financial Performance, FY 2022 and 2023
- Table 59 : Glencore: Product Portfolio
- Table 60 : Glencore: News/Key Developments, 2022 and 2023
- Table 61 : Jiangxi Copper Corp.: Company Snapshot
- Table 62 : Jiangxi Copper Corp.: Financial Performance, FY 2022 and 2023
- Table 63 : Jiangxi Copper Corp.: Product Portfolio
- Table 64 : Jiangxi Copper Corp.: News/Key Developments, 2022 and 2023
- Table 65 : Ma'aden: Company Snapshot
- Table 66 : Ma'aden: Financial Performance, FY 2022 and 2023
- Table 67 : Ma'aden: Product Portfolio
- Table 68 : Ma'aden: News/Key Developments, 2022-2024
- Table 69 : Newmont Corp.: Company Snapshot
- Table 70 : Newmont Corp.: Financial Performance, FY 2022 and 2023
- Table 71 : Newmont Corp.: Product Portfolio
- Table 72 : Newmont Corp.: News/Key Developments, 2022 and 2023
- Table 73 : Rio Tinto: Company Snapshot
- Table 74 : Rio Tinto: Financial Performance, FY 2022 and 2023
- Table 75 : Rio Tinto: Product Portfolio
- Table 76 : Rio Tinto: News/Key Developments, 2023 and 2024
- Table 77 : Sumitomo Metal Mining Co. Ltd.: Company Snapshot
- Table 78 : Sumitomo Metal Mining Co. Ltd.: Financial Performance, FY2021 and 2022
- Table 79 : Sumitomo Metal Mining Co. Ltd.: Product Portfolio
- Table 80 : Sumitomo Metal Mining Co. Ltd.: News/Key Developments, 2022-2024
- Table 81 : Tata Steel Ltd.: Company Snapshot
- Table 82 : Tata Steel Ltd.: Financial Performance, FY 2022 and 2023
- Table 83 : Tata Steel Ltd.: Product Portfolio
- Table 84 : Tata Steel Ltd.: News/Key Developments, 2022-2024
- Table 85 : Vale S.A.: Company Snapshot
- Table 86 : Vale S.A.: Financial Performance, FY 2022 and 2023
- Table 87 : Vale S.A.: Product Portfolio
- Table 88 : Vale S.A.: News/Key Developments, 2022-2024
List of Figures
- Summary Figure : Global Market Shares of Green Mining, by Region, 2023
- Figure 1 : Five Pillar of Green Mining
- Figure 2 : Supply Chain Analysis of Green Mining
- Figure 3 : Market Dynamics of Green Mining Market
- Figure 4 : Renewable Electricity Capacity Growth, by Country or Region, Main Case, 2017-2022 and 2023-2028
- Figure 5 : Emerging Technologies in the Green Mining Market
- Figure 6 : Global Market Shares of Green Mining, by Mining Type, 2023
- Figure 7 : Global Market Shares of Surface Mining, by Region, 2023
- Figure 8 : Global Market Shares of Underground Mining, by Region, 2023
- Figure 9 : Global Market Shares of Green Mining, by Technology, 2023
- Figure 10 : Global Market Shares of Green Mining in Power Reduction Technology, by Region, 2023
- Figure 11 : Global Market Shares of Green Mining in Emission Reduction Technology, by Region, 2023
- Figure 12 : Global Market Shares of Green Mining in Fuel and Maintenance Reduction Technology, by Region, 2023
- Figure 13 : Physicochemical and Biological Characteristics of Iron Ore Mine Tailings
- Figure 14 : Global Market Shares of Green Mining in Water Reduction Technology, by Region, 2023
- Figure 15 : Global Market Shares of Green Mining in Other Technologies, by Region, 2023
- Figure 16 : Global Market Shares of Green Mining, by Region, 2023
- Figure 17 : North American Market Shares of Green Mining, by Country, 2023
- Figure 18 : North American Market Shares of Green Mining, by Mining Type, 2023
- Figure 19 : North American Market Shares of Green Mining, by Technology, 2023
- Figure 20 : European Market Shares of Green Mining, by Country, 2023
- Figure 21 : European Market Shares of Green Mining, by Mining Type, 2023
- Figure 22 : European Market Shares of Green Mining, by Technology, 2023
- Figure 23 : Asia-Pacific Market Shares of Green Mining, by Country, 2023
- Figure 24 : Asia-Pacific Market Shares of Green Mining, by Mining Type, 2023
- Figure 25 : Asia-Pacific Market Shares of Green Mining, by Technology, 2023
- Figure 26 : South American Market Shares of Green Mining, by Country, 2023
- Figure 27 : South American Market Shares of Green Mining, by Mining Type, 2023
- Figure 28 : South American Market Shares of Green Mining, by Technology, 2023
- Figure 29 : Middle East and African Market Shares of Green Mining, by Country, 2023
- Figure 30 : Middle East and African Market Shares of Green Mining, by Mining Type, 2023
- Figure 31 : Middle East and African Market Shares of Green Mining, by Technology, 2023
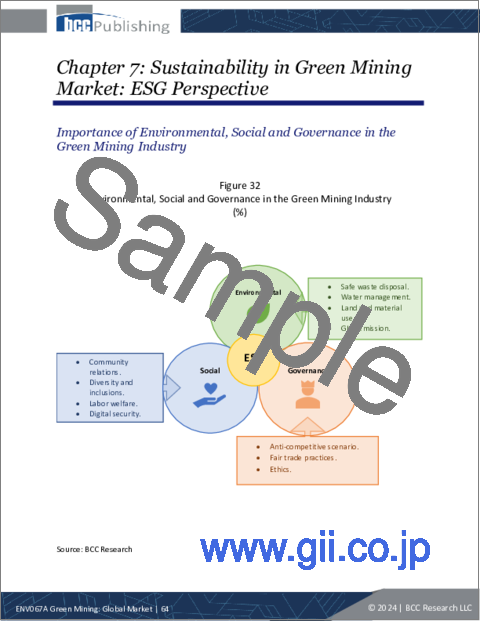
- Figure 32 : Environmental, Social and Governance in the Green Mining Industry
- Figure 33 : Anglo American: Revenue Shares, by Business Unit, FY 2023
- Figure 34 : Anglo American: Revenue Share, by Country/Region, FY 2023
- Figure 35 : BHP: Revenue Shares, by Business Unit, FY 2023
- Figure 36 : BHP: Revenue Share, by Country/Region, FY 2023
- Figure 37 : Dundee Precious Metals Inc.: Revenue Shares, by Business Unit, FY 2023
- Figure 38 : Freeport-McMoRan: Revenue Shares, by Business Unit, FY 2023
- Figure 39 : Freeport-McMoRan: Revenue Share, by Country/Region, FY 2023
- Figure 40 : Glencore: Revenue Shares, by Business Unit, FY 2023
- Figure 41 : Glencore: Revenue Share, by Country/Region, FY 2023
- Figure 42 : Jiangxi Copper Corp.: Revenue Shares, by Business Unit, FY 2023
- Figure 43 : Jiangxi Copper Corp.: Revenue Share, by Country/Region, FY 2023
- Figure 44 : Ma'aden: Revenue Shares, by Business Unit, FY 2023
- Figure 45 : Ma'aden: Revenue Share, by Country/Region, FY 2023
- Figure 46 : Newmont Corp.: Revenue Shares, by Business Unit, FY 2023
- Figure 47 : Newmont Corp.: Revenue Share, by Country/Region, FY 2023
- Figure 48 : Rio Tinto: Revenue Shares, by Business Unit, FY 2023
- Figure 49 : Rio Tinto: Revenue Share, by Country/Region, FY 2023
- Figure 50 : Sumitomo Metal Mining Co. Ltd.: Revenue Shares, by Business Unit, FY 2023
- Figure 51 : Sumitomo Metal Mining Co. Ltd.: Revenue Share by Country/Region, FY 2022
- Figure 52 : Tata Steel Ltd.: Revenue Shares, by Business Unit, FY 2023
- Figure 53 : Tata Steel Ltd.: Revenue Share, by Country/Region, FY 2023
- Figure 54 : Vale S.A.: Revenue Shares, by Business Unit, FY 2023
- Figure 55 : Vale S.A.: Revenue Share, by Country/Region, FY 2023
The global market for green mining is estimated to increase from $11.4 billion in 2023 to reach $16.9 billion by 2029, at a compound annual growth rate (CAGR) of 7.4% from 2024 through 2029.
The European market for green mining is estimated to increase from $4.0 billion in 2023 to reach $5.7 billion by 2029, at a CAGR of 6.7% from 2024 through 2029.
The Asia-Pacific market for green mining is estimated to increase from $2.6 billion in 2023 to reach $4.2 billion by 2029, at a CAGR of 9.2% from 2024 through 2029.
Report Scope:
The scope of green mining encompasses various aspects of mining operations that prioritize environmental sustainability and minimize the impact on ecosystems. The global green mining market covers segments by mining type (e.g., surface, underground), technology (e.g., power reduction, fuel and maintenance reduction, emission reduction, water reduction) and regional (i.e., North America, Europe, Asia-Pacific, South America, Middle East and Africa). The base year for the market study is 2023, and the estimates and forecasts are for 2024 through 2029. Market estimates are in U.S. dollars (millions). This report concentrates on green mining technologies currently in mining use; other promising technologies that are not likely to make it out of the laboratory are not covered in the report. The market size includes the revenue mining companies generate by incorporating green mining technologies.
Report Includes:
- 38 data tables and 51 additional tables
- An overview of the global markets for green mining
- Estimation of market size and analyses of global market trends, with data from 2023, estimates for 2024, and projections of compound annual growth rates (CAGRs) through 2029
- Highlights of the market potential and characterization of green mining market by region, type, and technology
- Insights into social and environmental concerns related to carbon footprint and discussion on how that can minimize by implementing recycling initiatives
- Coverage of government laws and regulations related to mining companies and an overview of environmental standards and practices
- Identification of new innovations in the raw materials sector, generation of sustainable mining technologies, resource efficiency, and the development of alternative raw materials
- Examination of the key drivers and constraints that will shape the market and discussion on the upcoming market opportunities and areas of focus to forecast the market into various segments and sub-segments
- Coverage of recent advances, emerging technologies, and developments of the industry
- Evaluation of key industry acquisitions and strategic alliances and market share analysis of the leading suppliers of the industry
- Company profiles of major players within the industry, including Rio Tinto, BHP, Vale S.A., and Anglo American
Table of Contents
Chapter 1 Executive Summary
- Market Outlook
- Scope of Report
- Market Summary
Chapter 2 Market Overview
- Overview
- Five Pillars of Green Mining
- Promoting Materials and Energy Efficiency
- Ensuring the Availability of Mineral Resources for the Future
- Minimizing Adverse Environmental and Social Impacts
- Improving Work and Organizational Practices
- Ensuring Sustainable Land Use Following Mine Closure
- Supply Chain Analysis
- Key Regulators in the Green Mining Industry
Chapter 3 Market Dynamics
- Market Dynamics
- Market Drivers
- Growing Environmental Legislation and Regulatory Pressures
- Rising Green Finance
- Rapid Integration of Renewable Energy in Mining Operations
- Growing Responsible Sourcing Requirements
- Market Restraints
- High Cost of Adoption of Green Technology
- Resistance from Conventional Mining Businesses
- Regulatory Obstacles
- Monitoring and Enforcement Difficulties
- Market Opportunities
- Technological Innovation
- Water Resource Management
- Electrification of Mining Equipment
Chapter 4 Emerging Technologies and Developments
- Overview
- Newest Technologies
- Artificial Intelligence
- Real-Time Location Systems
- Dust-Suppression Technology
- Direct Lithium Extraction
- Liquid Membrane Emulsion Technology
- Biomining
- Dry Tailings Management
- Hybrid Diesel Electric Equipment in Underground Mining
- Key Developments
- Patent Analysis
Chapter 5 Market Segmentation Analysis
- Segmentation Breakdown
- Market Analysis by Mining Type
- Surface Mining
- Underground Mining
- Market Analysis by Technology
- Power Reduction
- Emission Reduction
- Fuel and Maintenance Reduction
- Water Reduction
- Other Technologies
- Geographic Breakdown
- Market Analysis by Region
- North America
- Europe
- Asia-Pacific
- South America
- Middle East and Africa
Chapter 6 Competitive Intelligence
- Overview
- Top Players Ranking Analysis
- Strategic Analysis
Chapter 7 Sustainability in Green Mining Market: ESG Perspective
- Importance of Environmental, Social and Governance in the Green Mining Industry
- ESG Ratings and Metrics: Understanding the Data
- ESG Practices in the Green Mining Industry
- Current Status of ESG in the Green Mining Market
- ESG Score Analysis
- Risk Scale, Exposure Scale and Management Scale
- Risk Scale
- Exposure Scale
- Management Scale
- Future of ESG: Emerging Trends and Opportunities
- Concluding Remarks from BCC Research
Chapter 8 Appendix
- Methodology
- References
- Acronyms
- Company Profiles
- ANGLO AMERICAN
- BHP
- DUNDEE PRECIOUS METALS INC.
- FREEPORT-MCMORAN
- GLENCORE
- JIANGXI COPPER CORP.
- MA'ADEN
- NEWMONT CORP.
- RIO TINTO
- SUMITOMO METAL MINING CO. LTD.
- TATA STEEL LIMITED
- VALE S.A.


