|
|
市場調査レポート
商品コード
1517519
血液疾患の治療薬および診断薬:世界市場Drugs and Diagnostics for Hematological Disorders: Global Markets |
||||||
|
|||||||
|
|||||||

| 血液疾患の治療薬および診断薬:世界市場 |
|
出版日: 2024年07月02日
発行: BCC Research
ページ情報: 英文 133 Pages
納期: 即納可能
|

全表示
- 概要
- 図表
- 目次
世界の血液疾患の治療薬および診断薬の市場規模は、2024年の1,312億米ドルから、予測期間中はCAGR 7.6%で推移し、2029年末には1,893億米ドルに達すると予測されています。
北米地域は、2024年の589億米ドルから、CAGR 7.8%で推移し、2029年末までに857億米ドルに達すると予測されています。また、欧州地域は、2024年の341億米ドルから、CAGR 7.0%で推移し、2029年末には478億米ドルに達すると予測されています。
当レポートでは、世界の血液疾患の治療薬および診断薬の市場を調査し、市場概要、市場影響因子および市場機会の分析、新興技術および技術開発の動向、市場規模の推移・予測、各種区分・地域別の詳細分析、競合情勢、主要企業のプロファイルなどをまとめています。
目次
第1章 エグゼクティブサマリー
- 市場見通し
- 調査範囲
- 市場概要
第2章 市場概要
- 概要
- PESTEL分析
- ポーターのファイブフォース分析
- 血液検査機器のサプライチェーンと物流
第3章 市場力学
- 市場促進要因
- 市場抑制要因
- 市場機会
第4章 医薬品の特許情勢と最近の開発状況
- 特許情勢
- 新規承認
第5章 新興技術と開発
- 概要
- 新技術
- AI支援診断
- 次世代シーケンシング (NGS)
- マイクロ流体工学とラボオンチップデバイス
- 遺伝子治療
- 免疫療法
- 臨床試験
第6章 市場セグメンテーション分析
- セグメンテーションの内訳
- 市場別分類
- 血液疾患診断市場
- 血液疾患診断市場:製品タイプ別
- 血液疾患診断市場:エンドユーザー別
- 血液学医薬品市場
- 血液学医薬品市場:医薬品タイプ別
- 地理的内訳
- 北米
- 欧州
- アジア太平洋
- その他の地域
第7章 競合情報
- 主要企業
- 血液疾患の診断薬
- 血液疾患の治療薬
- 希少血液疾患治療薬の新たな開発者
第8章 付録
- 調査手法
- 出典
- 略語
- 企業プロファイル
- ABBOTT
- AMGEN INC.
- BIO-RAD LABORATORIES INC.
- BRISTOL MYERS SQUIBB CO.
- DANAHER CORP.
- F. HOFFMANN-LA ROCHE LTD.
- NOVARTIS AG
- SANOFI
- SYSMEX CORP.
- TAKEDA PHARMACEUTICAL CO. LTD.
List of Tables
- Summary Table : Global Market for Drugs and Diagnostics for Hematological Disorders, by Region, Through 2029
- Table 1 : Blood-Related Disorders
- Table 2 : Incidence of Blood Cancer Types in U.S., 2023
- Table 3 : Total Cost of Care for CLL Patients Treated in the U.S., 2023
- Table 4 : Hematology Drugs and their Patent Expiration Dates, 2024
- Table 5 : Approved Hematology Drugs, 2023
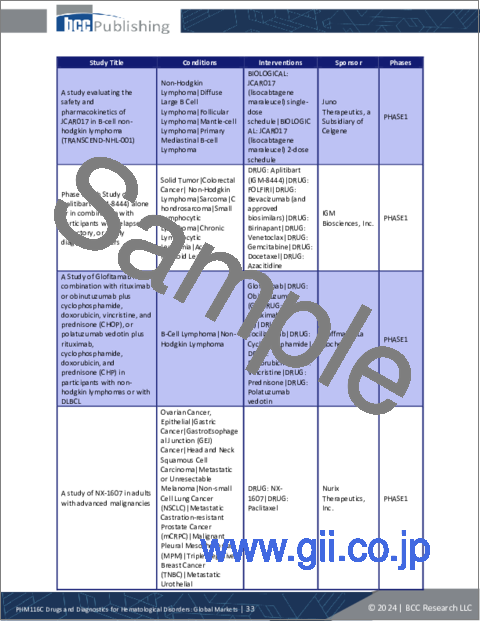
- Table 6 : Clinical Trial Studies on Leukemia, March 2024
- Table 7 : Clinical Trial Studies on Lymphoma, March 2024
- Table 8 : Clinical Trial Studies on Bleeding Disorders, March 2024
- Table 9 : Clinical Trial Studies on Myelofibrosis, March 2024
- Table 10 : Clinical Trial Studies on Anemia, March 2024
- Table 11 : Clinical Trial Studies on Multiple Myeloma, March 2024
- Table 12 : Clinical Trial Studies on Thalassemia, March 2024
- Table 13 : Global Market for Drugs and Diagnostics for Hematological Disorders, by Segment, Through 2029
- Table 14 : Global Market for Diagnostics for Hematological Disorders, by Region, Through 2029
- Table 15 : Global Market for Diagnostics for Hematological Disorders, by Product Type, Through 2029
- Table 16 : Global Market for Hematology Instruments and Software, by Region, Through 2029
- Table 17 : Global Market for Hematology Reagents, by Region, Through 2029
- Table 18 : Global Market for Diagnostics for Hematological Disorders, by End User, Through 2029
- Table 19 : Global Market for Hematology Diagnosis in Diagnostic Centers, by Region, Through 2029
- Table 20 : Global Market for Hematology Diagnosis in Hospitals and Clinics, by Region, Through 2029
- Table 21 : Global Market for Hematology Diagnosis in Other End Users, by Region, Through 2029
- Table 22 : Global Market for Hematology Drugs, by Region, Through 2029
- Table 23 : Global Market for Hematology Drugs, by Drug Type, Through 2029
- Table 24 : Drugs Approved for Hematologic Cancers
- Table 25 : Global Market for Hematology Oncology Drugs, by Region, Through 2029
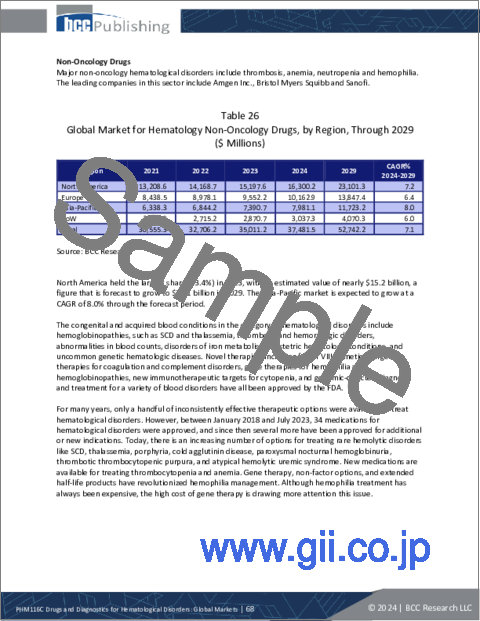
- Table 26 : Global Market for Hematology Non-Oncology Drugs, by Region, Through 2029
- Table 27 : Global Market for Drugs and Diagnostics for Hematological Disorders, by Region, Through 2029
- Table 28 : North American Market for Drugs and Diagnostics for Hematological Disorders, by Country, Through 2029
- Table 29 : North American Market for Drugs and Diagnostics for Hematological Disorders, by Segment, Through 2029
- Table 30 : North American Market for Diagnostics for Hematological Disorders, by Product Type, Through 2029
- Table 31 : North American Market for Diagnostics for Hematological Disorders, by End User, Through 2029
- Table 32 : North American Market for Hematology Drugs, by Drug Type, Through 2029
- Table 33 : European Market for Drugs and Diagnostics for Hematological Disorders, by Country, Through 2029
- Table 34 : European Market for Drugs and Diagnostics for Hematological Disorders, by Segment, Through 2029
- Table 35 : European Market for Diagnostics for Hematological Disorders, by Product Type, Through 2029
- Table 36 : European Market for Diagnostics for Hematological Disorders, by End User, Through 2029
- Table 37 : European Market for Hematology Drugs, by Drug Type, Through 2029
- Table 38 : Incidence of Blood-Related Cancers, by Country, 2022
- Table 39 : Asia-Pacific Market for Drugs and Diagnostics for Hematological Disorders, by Country, Through 2029
- Table 40 : Asia-Pacific Market for Drugs and Diagnostics for Hematological Disorders, by Segment, Through 2029
- Table 41 : Asia-Pacific Market for Diagnostics for Hematological Disorders, by Product Type, Through 2029
- Table 42 : Asia-Pacific Market for Diagnostics for Hematological Disorders, by End User, Through 2029
- Table 43 : Asia-Pacific Market for Hematology Drugs, by Drug Type, Through 2029
- Table 44 : Asia-Pacific Incidence of Blood-Related Cancers, by Country, 2022
- Table 45 : RoW Market for Drugs and Diagnostics for Hematological Disorders, by Segment, Through 2029
- Table 46 : RoW Market for Diagnostics for Hematological Disorders, by Product Type, Through 2029
- Table 47 : RoW Market for Diagnostics for Hematological Disorders, by End User, Through 2029
- Table 48 : RoW Market for Hematology Drugs, by Drug Type, Through 2029
- Table 49 : Revenue Generated by Drugs for Hematology Disorders, 2023
- Table 50 : New Developers of Drugs for Hematology Disorders
- Table 51 : Report Sources
- Table 52 : Abbreviations Used in This Report
- Table 53 : Abbott: Company Snapshot
- Table 54 : Abbott: Financial Performance, F.Y. 2022 and 2023
- Table 55 : Abbott: Product Portfolio
- Table 56 : Abbott: News/Key Developments, 2023
- Table 57 : Amgen Inc.: Company Snapshot
- Table 58 : Amgen Inc.: Financial Performance, FY 2022 and 2023
- Table 59 : Amgen Inc.: Product Portfolio
- Table 60 : Amgen Inc.: News/Key Developments, 2021-2024
- Table 61 : Bio-Rad Laboratories Inc.: Company Snapshot
- Table 62 : Bio-Rad Laboratories Inc.: Financial Performance, FY 2022 and 2023
- Table 63 : Bio-Rad Laboratories Inc.: Product Portfolio
- Table 64 : Bio-Rad Laboratories Inc.: News/Key Developments, 2023
- Table 65 : Bristol Myers Squibb Co.: Company Snapshot
- Table 66 : Bristol Myers Squibb Co.: Financial Performance, FY 2022 and 2023
- Table 67 : Bristol Myers Squibb Co.: Product Portfolio
- Table 68 : Bristol Myers Squibb Co.: News/Key Developments, 2023 and 2024
- Table 69 : Danaher Corp.: Company Snapshot
- Table 70 : Danaher Corp.: Financial Performance, FY 2022 and 2023
- Table 71 : Danaher Corp.: Product Portfolio
- Table 72 : Danaher Corp.: News/Key Developments, 2022-2024
- Table 73 : F. Hoffmann-La Roche Ltd.: Company Snapshot
- Table 74 : F. Hoffmann-La Roche Ltd.: Financial Performance, FY 2022 and 2023
- Table 75 : F. Hoffmann-La Roche Ltd: Product Portfolio
- Table 76 : F. Hoffmann-La Roche Ltd.: News/Key Developments, 2022-2024
- Table 77 : Novartis AG: Company Snapshot
- Table 78 : Novartis AG: Financial Performance, FY 2022 and 2023
- Table 79 : Novartis AG: Product Portfolio
- Table 80 : Novartis AG: News/Key Developments, 2022
- Table 81 : Sanofi: Company Snapshot
- Table 82 : Sanofi: Financial Performance, FY 2022 and 2023
- Table 83 : Sanofi: Product Portfolio
- Table 84 : Sanofi: News/Key Developments, 2023
- Table 85 : Sysmex Corp.: Company Snapshot
- Table 86 : Sysmex Corp.: Financial Performance, FY 2022 and 2023
- Table 87 : Sysmex Corp.: Product Portfolio
- Table 88 : Sysmex Corp.: News/Key Developments, 2021-2023
- Table 89 : Takeda Pharmaceutical Co. Ltd.: Company Snapshot
- Table 90 : Takeda Pharmaceutical Co. Ltd.: Financial Performance, FY 2021 and 2022
- Table 91 : Takeda Pharmaceutical Co. Ltd.: Product Portfolio
- Table 92 : Takeda Pharmaceutical Co. Ltd.: News/Key Developments, 2023
List of Figures
- Summary Figure : Global Market for Drugs and Diagnostics for Hematological Disorders, by Region, 2021-2029
- Figure 1 : Market Dynamics of Drugs and Diagnostics for Hematological Disorders
- Figure 2 : Incidence of Blood Cancer Types, by Region, 2022
- Figure 3 : Clinical Trial Phases of Drugs for Various Blood-Related Disorders, March 2024
- Figure 4 : Global Market Shares of Drugs and Diagnostics for Hematological Disorders, by Segment, 2023
- Figure 5 : Global Market Shares of Diagnostics for Hematological Disorders, by Product Type, 2023
- Figure 6 : Global Market Shares of Diagnostics for Hematological Disorders, by End User, 2023
- Figure 7 : Global Market Shares of Hematology Drugs, by Drug Type, 2023
- Figure 8 : North American Market Shares of Drugs and Diagnostics for Hematological Disorders, by Country, 2023
- Figure 9 : New Cases of Leukemia, Lymphoma and Myeloma in U.S., 2023
- Figure 10 : European Market Shares of Drugs and Diagnostics for Hematological Disorders, by Country, 2023
- Figure 11 : Asia-Pacific Market Shares of Drugs and Diagnostics for Hematological Disorders, by Country, 2023
- Figure 12 : Abbott: Revenue Shares, by Business Unit, F.Y. 2023
- Figure 13 : Abbott: Revenue Shares, by Country/Region, FY 2023
- Figure 14 : Amgen Inc.: Revenue Shares, by Business Unit, FY 2023
- Figure 15 : Amgen Inc.: Revenue Shares, by Country/Region, FY 2023
- Figure 16 : Bio-Rad Laboratories Inc.: Revenue Shares, by Business Unit, FY 2023
- Figure 17 : Bio-Rad Laboratories Inc.: Revenue Shares, by Country/Region, FY 2023
- Figure 18 : Bristol Myers Squibb Co.: Revenue Shares, by Business Unit, FY 2023
- Figure 19 : Bristol Myers Squibb Co.: Revenue Shares, by Country/Region, FY 2023
- Figure 20 : Danaher Corp.: Revenue Shares, by Business Unit, FY 2023
- Figure 21 : Danaher Corp.: Revenue Shares, by Country/Region, FY 2023
- Figure 22 : F. Hoffmann-La Roche Ltd.: Revenue Shares, by Business Unit, FY 2023
- Figure 23 : F. Hoffmann-La Roche Ltd.: Revenue Shares, by Country/Region, FY 2023
- Figure 24 : Novartis AG: Revenue Shares, by Business Unit, FY 2023
- Figure 25 : Novartis AG: Revenue Shares, by Country/Region, FY 2023
- Figure 26 : Sanofi: Revenue Shares, by Business Unit, FY 2023
- Figure 27 : Sanofi: Revenue Shares, by Country/Region, FY 2023
- Figure 28 : Sysmex Corp.: Revenue Shares, by Business Unit, FY 2023
- Figure 29 : Sysmex Corp.: Revenue Shares, by Country/Region, FY 2023
- Figure 30 : Takeda Pharmaceutical Co. Ltd.: Revenue Shares, by Country/Region, FY 2022
The global market for drugs and diagnostics for hematological disorders is expected to grow from $131.2 billion in 2024 and is projected to reach $189.3 billion by the end of 2029, at a compound annual growth rate (CAGR) of 7.6% during the forecast period of 2024 to 2029.
The North American market for drugs and diagnostics for hematological disorders is expected to grow from $58.9 billion in 2024 and is projected to reach $85.7 billion by the end of 2029, at a CAGR of 7.8% during the forecast period of 2024 to 2029.
The European market for drugs and diagnostics for hematological disorders is expected to grow from $34.1 billion in 2024 and is projected to reach $47.8 billion by the end of 2029, at a CAGR of 7.0% during the forecast period of 2024 to 2029.
Report Scope
This report covers the worldwide market for the drugs used to treat hematological disorders, as well as the devices and reagents used to diagnose these diseases. Based on product type, the diagnostic market for hematological disorders is divided into reagents & instruments and software. By end user, the market is segmented into hospitals, diagnostic labs, and others. On the basis of drug type, the drugs used to treat hematological disorders are divided into oncology drugs and non-oncology drugs.
The market is divided into four geographic regions: North America, Europe, Asia-Pacific, and Rest of the World (RoW). For market estimates, data has been provided for 2023 as the base year, with forecasts for 2024 through 2029. The report also covers approved drugs, the pipeline analysis, innovative research, opportunities within the market, and profiles of leading companies.
The growing number of individuals with leukemia is the main reason for the market's growth and the development of more effective drugs.
Report Includes
- 49 data tables and 44 additional tables
- An overview of the current and future global markets for drugs and diagnostics for hematological disorders
- Analyses of the global market trends, with market revenue data for 2021-2023, estimates for 2024, forecasts for 2029, and projected CAGRs through 2029
- Estimate of the current market size and revenue growth prospects, along with a market share analysis by segment, product, end user, drug type, and region
- Facts and figures pertaining to the market dynamics, current and emerging technologies, regulations, cancer incidence, and the impact of various macroeconomic factors
- A look at treatment strategies, such as hematological therapeutics and drugs, chemotherapy, radiotherapy and immunotherapy, as well as testing and screening methods for diagnosis
- Review of technological developments, product introductions, and other recent industry activity of the major players
- Discussion of sustainability trends and ESG developments in the industry, with a focus on consumer attitudes, companies' ESG score rankings and their ESG practices
- An analysis of recent patents
- A look at the competitive landscape, including companies' market shares, M&A activity and venture funding
- Profiles of the leading market players, including Danaher, Abbott, Sysmex Corp., Bristol Myers Squibb Co., and F. Hoffmann-La Roche Ltd.
Table of Contents
Chapter 1 Executive Summary
- Market Outlook
- Scope of Report
- Market Summary
Chapter 2 Market Overview
- Overview
- PESTEL Analysis
- Political
- Economic
- Social
- Technological
- Environmental
- Legal
- Porter's Five Forces Analysis
- Bargaining Power of Buyers
- Bargaining Power of Suppliers
- Potential of New Entrants
- Threat of Substitutes
- Competition in the Industry
- Supply Chain and Logistics for Hematological Instruments
Chapter 3 Market Dynamics
- Market Drivers
- Incidence of Blood Disorders
- Rising Use of Automation
- Diagnosis of Hematology Disorders
- Increasing Government and Private Funding for Treatment
- Market Restraints
- High Cost of Instruments
- High Cost of Treatment
- Reimbursement Challenges for Physicians
- Market Opportunities
- Rising Health Awareness
- Emerging Economies
Chapter 4 Patent Landscape and Current Developments in Drugs
- Patent Landscape
- New Approvals
Chapter 5 Emerging Technologies and Developments
- Overview
- Emerging Technologies
- AI-Assisted Diagnosis
- Next-Generation Sequencing (NGS)
- Microfluidics and Lab-on-a-Chip Devices
- Gene Therapies
- Immunotherapies
- Clinical Trials
Chapter 6 Market Segmentation Analysis
- Segmentation Breakdown
- Segmentation by Market
- Hematological Disorders Diagnostics Market
- Hematological Disorders Diagnostic Market, By Product Type
- Hematological Disorders Diagnostic Market, By End User
- Hematology Drug Market
- Hematology Drug Market, By Drug Type
- Geographic Breakdown
- North America
- Europe
- Asia-Pacific
- Rest of the World
Chapter 7 Competitive Intelligence
- Leading Companies
- Hematological Disorder Diagnostics
- Hematological Disorder Drugs
- New Developers of Drugs for Rare Hematology Disorders
Chapter 8 Appendix
- Methodology
- Sources
- Abbreviations
- Company Profiles
- ABBOTT
- AMGEN INC.
- BIO-RAD LABORATORIES INC.
- BRISTOL MYERS SQUIBB CO.
- DANAHER CORP.
- F. HOFFMANN-LA ROCHE LTD.
- NOVARTIS AG
- SANOFI
- SYSMEX CORP.
- TAKEDA PHARMACEUTICAL CO. LTD.

