|
|
市場調査レポート
商品コード
1411290
ジェネリック医薬品の世界市場Global Markets for Generic Drugs |
||||||
|
|
|||||||
|
|||||||


| ジェネリック医薬品の世界市場 |
|
出版日: 2024年01月15日
発行: BCC Research
ページ情報: 英文 126 Pages
納期: 即納可能
|

- 全表示
- 概要
- 図表
- 目次
世界のジェネリック医薬品の市場規模は、2023年の4,353億米ドルから、予測期間中は8.5%のCAGRで推移し、2028年末には6,558億米ドルの規模に成長すると予測されています。
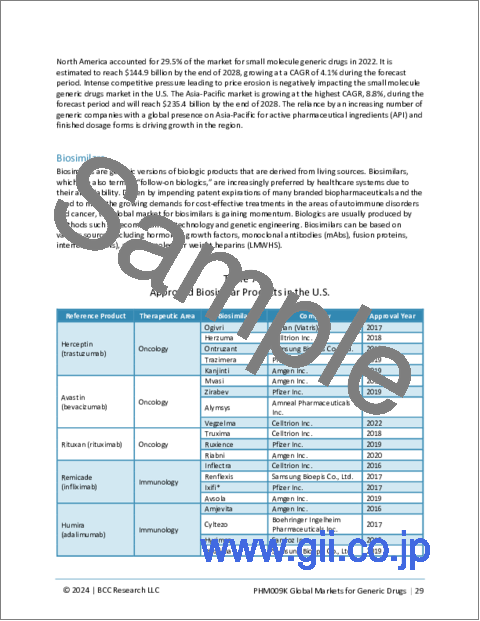
世界の低分子ジェネリック医薬品の市場規模は、2023年の4,026億米ドルから、同期間中は6.6%のCAGRで推移し、2028年末には5,547億米ドルに達すると予測されています。また、バイオシミラー医薬品の市場規模は、2023年の327億米ドルから、25.3%のCAGRで推移し、2028年末には1,011億米ドルに達すると予測されています。
当レポートでは、世界のジェネリック医薬品の市場を調査し、市場概要、市場影響因子の分析、市場規模の推移・予測、各種区分・地域別の詳細分析、主要動向、法規制環境、ESGの展望、競合情勢、主要企業のプロファイルなどをまとめています。
目次
第1章 イントロダクション
第2章 サマリー・ハイライト
- 市場の見通し
- 市場サマリー
第3章 市場概要
- 適切な市場規模
- 特許切れの治療薬
- 依然として使用されている古い製品
- 長期使用
- 容易な製造技術
- プライマリケアで使用される薬剤
- バイオシミラー
第4章 市場力学
- 市場促進要因
- 増加する特許の崖と独占権の喪失
- 有利なヘルスケア政策
- 医師の意識の変化
- 市場の課題
- 価格設定の圧力と低い利益率
- イノベーター企業の特許延長戦略
第5章 市場内訳:分子タイプ別
- 世界のジェネリック医薬品市場
- 世界のジェネリック医薬品市場:分子タイプ別
- 低分子ジェネリック医薬品
- バイオシミラー
第6章 市場内訳:地域別
- 北米
- 米国
- カナダ
- 欧州
- ドイツ
- フランス
- イタリア
- 英国
- スペイン
- その他の欧州
- アジア太平洋
- 中国
- 日本
- インド
- その他のアジア太平洋地域
- 世界のその他の地域
第7章 持続可能性:ESGの観点
- ESG:イントロダクション
- ジェネリック医薬品業界の持続可能性:ESGの観点から
- ESGの主要な問題
- 主要ジェネリック医薬品企業の環境面のパフォーマンス
- 主要ジェネリック医薬品企業の社会面のパフォーマンス
- 主要ジェネリック医薬品企業のガバナンス面のパフォーマンス
- ケーススタディ
- BCCによる総論
第8章 新しい動向・展開
- 主要市場動向
- R&Dにおけるコラボレーション
- 免疫学および腫瘍学における複雑なジェネリック医薬品の台頭
- ポートフォリオ効率の向上
- 新興市場への焦点
第9章 規制状況
- 法規制の概要
- 米国
- 進化する米国情勢
- 欧州連合
- 日本
- バイオシミラーの規制
- EUの規定
- 認可されたジェネリック医薬品
第10章 競合情勢
- 競合情勢
- M&A分析
第11章 企業プロファイル
- ASPEN PHARMACARE
- AUROBINDO PHARMA
- CIPLA INC.
- DR. REDDY'S LABORATORIES LTD.
- FRESENIUS KABI
- LUPIN LTD.
- SANDOZ
- SUN PHARMACEUTICAL INDUSTRIES LTD.
- TEVA PHARMACEUTICAL INDUSTRIES LTD.
- VIATRIS INC.
List of Tables
- Summary Table A : Global Market for Generic Drugs, by Molecule Type, Through 2028
- Summary Table B : Global Market for Generic Drugs, by Region, Through 2028
- Table 1 : List of Block Buster Drugs Undergoing Patent Expiry in Coming Years
- Table 2 : Global Market for Generic Drugs Compared with the Total Pharmaceutical Market, Through 2028
- Table 3 : Global Market for Generic Drugs, by Top 10 Countries, Through 2028
- Table 4 : Global Top Selling Pharmaceuticals, 2022
- Table 5 : Global Market for Generic Drugs, by Molecule Type, Through 2028
- Table 6 : Global Market for Small Molecule Generics, by Region, Through 2028
- Table 7 : Approved Biosimilar Products in the U.S.
- Table 8 : Global Market for Biosimilars, by Region, Through 2028
- Table 9 : Global Market for Generic Drugs, by Region, Through 2028
- Table 10 : North American Market for Generic Drugs, Through 2028
- Table 11 : U.S. Market for Generic Drugs Compared with the Total Pharmaceutical Market, Through 2028
- Table 12 : Canadian Key Therapeutic Areas in Retail and Hospital Purchases, 2022
- Table 13 : Canadian Market for Generic Drugs Compared with the Total Pharmaceutical Market, Through 2028
- Table 14 : European Market for Generic Drugs, by Country, Through 2028
- Table 15 : German Market for Generic Drugs Compared with the Total Pharmaceutical Market, Through 2028
- Table 16 : French Market for Generic Drugs Compared with the Total Pharmaceutical Market, Through 2028
- Table 17 : Italian Market for Generic Drugs Compared with the Total Pharmaceutical Market, Through 2028
- Table 18 : U.K. Market for Generic Drugs Compared with the Total Pharmaceutical Market, Through 2028
- Table 19 : Spanish Market for Generic Drugs Compared with the Total Pharmaceutical Market, Through 2028
- Table 20 : Penetration of Generic Drugs in the Pharmaceutical Market in Other European Countries, 2022
- Table 21 : Rest of the European Market for Generic Drugs Compared with the Total Pharmaceutical Market, Through 2028
- Table 22 : Asia-Pacific Market for Generic Drugs, by Country, Through 2028
- Table 23 : Chinese Market for Generic Drugs Compared with the Total Pharmaceutical Market, Through 2028
- Table 24 : Japanese Market for Generic Drugs Compared with the Total Pharmaceutical Market, Through 2028
- Table 25 : Indian Market for Generic Drugs Compared with the Total Pharmaceutical Market, Through 2028
- Table 26 : Rest of Asia-Pacific Market for Generic Drugs Compared with the Total Pharmaceutical Market, Through 2028
- Table 27 : RoW Market for Generic Drugs Compared with the Total Pharmaceutical Market, Through 2028
- Table 28 : ESG Rankings for Major Generic Drugs Companies, 2023*
- Table 29 : ESG: Environmental Overview
- Table 30 : ESG: Social Overview
- Table 31 : ESG: Governance Overview
- Table 32 : Teva: ESG Ratings Received, 2022
- Table 33 : Collaborations for R&D and Licensing Agreements, 2022 and 2023
- Table 34 : Portfolio Expansion Activities of Key Generic Companies
- Table 35 : Requirements for NDA and ANDA Applications
- Table 36 : Leading Generic Drug Companies, by Sales, 2022
- Table 37 : Comparative Analysis of Top Three Competitors
- Table 38 : M&A Analysis of Generic Drugs Markets, 2022 and 2023
- Table 39 : Aspen Pharmacare Holdings Ltd.: Company Snapshot
- Table 40 : Aspen Pharmacare Holdings Ltd.: Financials, 2021 and 2022
- Table 41 : Aspen Pharmacare Holdings Ltd: Key Product Portfolio
- Table 42 : Aspen Pharmacare Holdings Ltd.: Recent Developments, 2023
- Table 43 : Aurobindo Pharma Ltd.: Company Snapshot
- Table 44 : Aurobindo Pharma Ltd.: Financials, 2021 and 2022
- Table 45 : Aurobindo Pharma Ltd.: Recent Developments, 2022
- Table 46 : Cipla Inc.: Company Snapshot
- Table 47 : Cipla Inc.: Financials, 2021 and 2022
- Table 48 : Cipla Inc.: Key Product Launches, by Region, 2022
- Table 49 : Cipla Inc.: Recent Developments, 2023
- Table 50 : Dr. Reddy's Laboratories Ltd.: Company Snapshot
- Table 51 : Dr. Reddy's Laboratories Ltd.: Financials, 2021 and 2022
- Table 52 : Dr. Reddy's Laboratories Ltd.: Biosimilars Portfolio
- Table 53 : Dr. Reddy's Laboratories Ltd.: Recent Developments, 2022-2023
- Table 54 : Fresenius Kabi AG: Company Snapshot
- Table 55 : Fresenius Kabi AG: Biosimilars Portfolio
- Table 56 : Fresenius Kabi AG: Biosimilar Products in Pipeline
- Table 57 : Fresenius Kabi AG: Recent Developments, 2022-2023
- Table 58 : Lupin Ltd.: Company Snapshot
- Table 59 : Lupin Ltd.: Financials, 2021 and 2022
- Table 60 : Lupin Ltd.: Recent Developments, 2023
- Table 61 : Sandoz Group AG: Company Snapshot
- Table 62 : Sandoz Group AG: Financials, 2021 and 2022
- Table 63 : Sandoz Group AG: Product Portfolio
- Table 64 : Sandoz Group AG: Key Biosimilar Products in Phase III and Registration
- Table 65 : Sandoz Group AG: Recent Developments, 2023
- Table 66 : Sun Pharmaceutical Industrial Ltd.: Company Snapshot
- Table 67 : Sun Pharmaceutical Industrial Ltd.: Financials, 2021 and 2022
- Table 68 : Teva Pharmaceutical Industrial Ltd.: Company Snapshot
- Table 69 : Teva Pharmaceutical Industrial Ltd.: Financials, 2021 and 2022
- Table 70 : Teva Pharmaceutical Industrial Ltd.: Biosimilars Portfolio
- Table 71 : Teva Pharmaceutical Industrial Ltd.: Recent Developments, 2023
- Table 72 : Viatris Inc.: Company Snapshot
- Table 73 : Viatris Inc.: Financials, 2021 and 2022
- Table 74 : Viatris Inc.: Recent Developments, 2022-2023
List of Figures
- Summary Figure A : Global Market for Generic Drugs, by Molecule Type, 2020-2028
- Summary Figure B : Global Market for Generic Drugs, by Region, 2020-2028
- Figure 1 : Generic Drugs Market Dynamics
- Figure 2 : Generic Drugs Approved in the U.S., 2019-2022
- Figure 3 : Regulatory Pathways for Small Molecule Generics and Biosimilars
- Figure 4 : Global Market Shares of Generic Drugs, by Molecule Type, 2022
- Figure 5 : Global Market for Small Molecule Generics, 2020-2028
- Figure 6 : Global Market for Biosimilars, 2020-2028
- Figure 7 : Snapshot of Global Market for Generic Drugs, by Region
- Figure 8 : Global Market Shares of Generic Drugs, by Region, 2022
- Figure 9 : Annual Savings from Biosimilars and Generics in the U.S., 2019-2022
- Figure 10 : European Market Shares of Generic Drugs, by Country, 2022
- Figure 11 : Asia-Pacific Market Shares of Generic Drugs, by Country, 2022
- Figure 12 : ESG Pillars
- Figure 13 : Advantages of ESG for Companies in the Generic Drugs Market
- Figure 14 : Key Focus Areas in ESG Metrics in the Generics Market
- Figure 15 : Teva: ESG Indicators, 2022
- Figure 16 : Emerging Trends in the Generic Drugs Market
- Figure 17 : Aspen Pharmacare Holdings Ltd.: Financials, 2021 and 2022
- Figure 18 : Aspen Pharmacare Holdings Ltd.: Market Share, by Business Segment, 2022
- Figure 19 : Aspen Pharmacare Holdings Ltd.: Revenue Share, by Region, 2022
- Figure 20 : Aurobindo Pharma Ltd.: Financials, 2021 and 2022
- Figure 21 : Aurobindo Pharma Ltd.: Revenue Share, by Business Segment, 2022
- Figure 22 : Aurobindo Pharma Ltd.: ANDA Filings, by Region, FY2022
- Figure 23 : Cipla Inc.: Financials, 2021 and 2022
- Figure 24 : Cipla Inc.: Revenue Share, by Business Segment, 2022
- Figure 25 : Cipla Inc.: ANDAs Pipeline, FY 2022
- Figure 26 : Dr. Reddy's Laboratories Ltd.: Financials, 2021 and 2022
- Figure 27 : Dr. Reddy's Laboratories Ltd.: Revenue Share, by Business Segment, 2022
- Figure 28 : Dr. Reddy's Laboratories Ltd.: Global Generics Revenue Share, by Therapeutic Area, 2022
- Figure 29 : Dr. Reddy's Laboratories Ltd.: Revenue Share, by Country, 2022
- Figure 30 : Lupin Ltd.: Financials, 2021 and 2022
- Figure 31 : Lupin Ltd.: Revenue Share, by Business Segment, 2022
- Figure 32 : Lupin Ltd.: India Revenue Share, by Therapeutic Area, 2022
- Figure 33 : Timeline of Novartis and Sandoz Separation
- Figure 34 : Sandoz Group AG: Financials, 2021 and 2022
- Figure 35 : Sandoz Group AG: Market Share, by Business Segment, 2022
- Figure 36 : Sandoz Group AG: Revenue Share, by Region, 2022
- Figure 37 : Sun Pharmaceutical Industrial Ltd.: Financials, 2021 and 2022
- Figure 38 : Sun Pharmaceutical Industrial Ltd.: Revenue Share, by Business Segment, 2022
- Figure 39 : Cumulative ANDAs Filed and Approved in the U.S., FY 2019-FY 2023
- Figure 40 : Teva Pharmaceutical Industrial Ltd.: Financials, 2021 and 2022
- Figure 41 : Teva Pharmaceutical Industrial Ltd.: Revenue Share, by Region, 2022
- Figure 42 : Viatris Inc.: Financials, 2021 and 2022
- Figure 43 : Viatris Inc.: Market Share, by Business Segment, 2022
- Figure 44 : Viatris Inc.: Revenue Share, by Region, 2022
Highlights:
The global market for generic drugs is expected to grow from $435.3 billion in 2023 and projected to reach $655.8 billion by the end of 2028, at a compound annual growth rate (CAGR) of 8.5% from 2023 to 2028.
The global market for small molecule generic drugs is expected to grow from $402.6 billion in 2023 and projected to reach $554.7 billion by the end of 2028, at a CAGR of 6.6% from 2023 to 2028.
The global market for biosimilar drugs is expected to grow from $32.7 billion in 2023 and projected to reach $101.1 billion by the end of 2028, at a CAGR of 25.3% from 2023 to 2028.
Report Scope:
The report discusses the current size and growth of the market for generic drugs, both in global terms and broken down by the most important national markets. The report covers small molecule drugs and biosimilars. It includes market drivers and challenges in the generic drug industry. The competitive landscape includes generic drug sales of key competitors and their ranking in the market. It also covers the emerging trends in the generic drugs industry.
By geographical region, the market has been segregated into North America, Europe, Asia-Pacific, and the Rest of the World. The North America region includes countries such as the U.S., Canada and Mexico; Europe includes Germany, U.K., Italy, and Rest of Europe; Asia-Pacific includes China, India, Japan, and Rest of Asia-Pacific. The estimated values used are based on drug manufacturers' total revenues.
Report Includes:
- 37 data tables and 39 additional tables
- An overview of the global markets for generic (pharmaceutical) drugs
- Analyses of the global market trends, with historical market revenue data (sales figures) from 2020 to 2022, estimates for 2023, and projections of compound annual growth rates (CAGRs) through 2028
- Estimate of the market size and revenue forecast of the market for generic drugs, and corresponding market share analysis based on molecule type and geographic region
- Evaluation of the current and future market potential of generic drugs, as well as the major generics, regulatory landscape and patent cliff within the biopharmaceutical industry
- Discussion of the major market drivers, opportunities and challenges, emerging technologies, and regulations
- Data and market value analyses for the U.S., Canada, Mexico, Germany, the U.K., Italy, China, India and Japan
- Overview of the sustainability trends and factors in the market for generic drugs, with emphasis on consumer attitudes, ESG scores, case studies and the ESG practices of leading companies
- Analysis of the pipeline for new generic drugs and their impact on the growth of the overall biopharmaceutical products market
- Patent review and analysis of key patent grants
- An analysis of the industry structure, including company market shares, recent M&A activity, and venture funding
- Analysis of the top market players, their global rankings, recent developments, key financials and segmental revenues, and product portfolios
- Profiles of the leading market players
Table of Contents
Chapter 1 Introduction
- Study Goals and Objectives
- Reasons for Doing This Study
- Scope of Report
- What's New in this Update?
- Research Methodology
- Information Sources
- Regional Breakdown
- Segmentation Breakdown
Chapter 2 Summary and Highlights
- Market Outlook
- Market Summary
Chapter 3 Market Overview
- Introduction
- Adequate Market Size
- Patent-Expired Therapies
- Older Products Still Used
- Long-Term Use
- Straightforward Production Technology
- Drugs Used in Primary Care
- Biosimilars
Chapter 4 Market Dynamics
- Market Drivers
- Increasing Patent Cliffs and Loss of Exclusivities
- Favorable Healthcare Policies
- Changing Physician Attitudes
- Market Challenges
- Pricing Pressures and Low Profit Margins
- Patent Extension Strategies of Innovator Companies
Chapter 5 Market Breakdown by Molecule Type
- Global Market for Generic Drugs
- Global Generic Drugs Market, by Molecule Type
- Small Molecule Generics
- Biosimilars
Chapter 6 Market Breakdown by Region
- Introduction
- North America
- U.S.
- Canada
- Europe
- Germany
- France
- Italy
- U.K.
- Spain
- Rest of Europe
- Asia-Pacific
- China
- Japan
- India
- Rest of Asia-Pacific
- Rest of the World
Chapter 7 Sustainability: An ESG Perspective
- Introduction to ESG
- Sustainability in the Generic Drugs Industry: An ESG Perspective
- Key ESG Issues
- Environmental Performance of Key Generic Drug Companies
- Social Performance of Key Generic Drug Companies
- Governance Performance of Key Generic Drug Companies
- Case Study
- Concluding Remarks from BCC
Chapter 8 Emerging Trends and Developments
- Key Trends in the Market
- Collaborations for R&D
- Rise of Complex Generics in Immunology and Oncology
- Improving Portfolio Efficiency
- Focus on Emerging Markets
Chapter 9 Regulatory Landscape
- Regulatory Overview
- U.S.
- Evolving Situation in the U.S.
- European Union
- Japan
- Regulation of Biosimilars
- EU Provisions
- Authorized Generic Drugs
Chapter 10 Competitive Landscape
- Competitive Landscape
- M&A Analysis
Chapter 11 Company Profiles
- ASPEN PHARMACARE
- AUROBINDO PHARMA
- CIPLA INC.
- DR. REDDY'S LABORATORIES LTD.
- FRESENIUS KABI
- LUPIN LTD.
- SANDOZ
- SUN PHARMACEUTICAL INDUSTRIES LTD.
- TEVA PHARMACEUTICAL INDUSTRIES LTD.
- VIATRIS INC.