|
|
市場調査レポート
商品コード
1393948
バイオセンサーおよびナノセンサー:世界の市場と各種技術Biosensors and Nanosensors: Global Markets and Technologies |
||||||
|
|
|||||||
|
|||||||


| バイオセンサーおよびナノセンサー:世界の市場と各種技術 |
|
出版日: 2023年12月07日
発行: BCC Research
ページ情報: 英文 188 Pages
納期: 即納可能
|

- 全表示
- 概要
- 図表
- 目次
世界のバイオセンサーおよびナノセンサーの市場規模は、2023年の306億米ドルから、予測期間中は7.3%のCAGRで推移し、2028年には435億米ドルの規模に成長すると予測されています。
地域別では、北米地域が2023年の111億米ドルから、7.7%のCAGRで推移し、2028年には161億米ドルの規模に成長すると予測されています。また、アジア太平洋地域は、2023年の56億米ドルから、8.3%のCAGRで推移し、2028年には83億米ドルの規模に成長すると予測されています。
当レポートでは、世界のバイオセンサーおよびナノセンサーの市場を調査し、市場および技術の概要、市場影響因子および市場機会の分析、市場規模の推移・予測、各種区分・地域/主要国別の詳細分析、特許動向、ESGの展開、競合情勢、主要企業のプロファイルなどをまとめています。
目次
第1章 イントロダクション
第2章 サマリー・ハイライト
第3章 市場概要
- 概要
- バイオセンサーの特徴
- バイオセンサーの生体コンポーネント
- バイオセンサーの物理コンポーネント
- バイオセンサーの基本特性
- 特定用途向けバイオセンサー
- バイオセンサーおよびナノセンサーの製造
- マイクロマシニング
- エッチング
- レーザーマイクロ加工
- ナノパターニング
- ナノセンサー
- バイオセンサーおよびナノセンサー市場の将来
- 規制基準
- バリューチェーン分析
- ポーターのファイブフォース分析
- COVID-19の市場への影響の評価
- ロシア・ウクライナ戦争が市場に与える影響の評価
第4章 市場力学
- 概要
- 市場促進要因
- ナノテクノロジーベースのバイオセンサーの出現
- ウェアラブルデバイスのセンサーの小型化・統合化
- 在宅ベースのPOC (ポイントオブケア) 機器の需要の急増
- 市場抑制要因
- 開発・製造コスト
- データのプライバシーとセキュリティに関する懸念
- 市場機会
- 持続可能性とグリーンテクノロジーへの注目の高まり
- IoTとの統合の強化
第5章 新たな技術と開発
- 概要
- 現在の市場動向
- ヘルスケアの優位性
- ウェアラブルバイオセンサー
- POC検査
- IoTの統合
- 新技術
- グラフェンベースのバイオセンサー
- 合成生物学と遺伝子工学
- ナノ粒子と量子ドット
- ラボオンチップ (LOC)
- マイクロ流体工学
- AIとML
- 3Dプリント
第6章 市場内訳:製品タイプ別
- 概要
- バイオセンサー
- ナノセンサー
- 背景
- ナノ粒子
- カーボンナノチューブ
- グラフェン
- ナノリボン
- ナノワイヤー
- ナノセラミックス
- その他のナノ構造材料
第7章 市場内訳:技術別
- 概要
- 電気化学バイオセンサー
- MEMSバイオセンサー
- 光電バイオセンサー
- サーミスターバイオセンサー
- IoT対応バイオセンサー
- その他のバイオセンサー
- ナノセンサー
- ナノケミカルセンサー
- ナノフォースセンサー
- ナノバイオセンサー
- ナノ放射線センサー
- ナノサーマルセンサー
第8章 市場内訳:用途別
- 概要
- ヘルスケア
- 環境
- プロセス産業
- 農業
- 食品モニタリング
- 生物防御
- その他
第9章 市場内訳:地域別
- 概要
- 北米
- 欧州
- アジア太平洋
- その他の地域
第10章 環境・社会・ガバナンス (ESG) の展望
- 概要
- バイオセンサーおよびナノセンサー市場におけるESGパフォーマンス
- 環境への影響
- 社会への影響
- ガバナンスへの影響
- バイオセンサーおよびナノセンサー市場におけるESGの現状
- バイオセンサーおよびナノセンサー市場における主要なESG問題
- バイオセンサーおよびナノセンサー市場におけるESGに対する消費者の態度
- ケーススタディ
- BCCによる総論
第11章 特許分析
- 概要
- 地域的パターン
第12章 M&A・資金調達の見通し
- M&A分析
- 新興企業への資金提供
第13章 競合情勢
- 主要企業
第14章 企業プロファイル
- ABBOTT LABORATORIES INC.
- ACON LABORATORIES
- ANALOG DEVICES INC.
- BAYER AG
- BIOSENSORS INTERNATIONAL GROUP
- CONTEC MEDICAL SYSTEMS CO. LTD.
- DEXCOM INC.
- F. HOFFMAN-LA ROCHE AG
- HONEYWELL INTERNATIONAL INC.
- HUMMINGBIRD DIAGNOSTICS GMBH
- I-SENS INC.
- KIONIX INC.
- LIFESCAN INC.
- MEDTRONIC INC.
- MEMSIC INC.
- MURATA MANUFACTURING CO. LTD.
- NXP SEMICONDUCTORS N.V.
- OMRON INDUSTRIAL AUTOMATION
- OPTISCAN BIOMEDICAL CORP.
- SENSONOR AS
- SIEMENS HEALTHCARE GMBH
- SILICON DESIGNS INC.
- SILICON SENSING SYSTEMS LTD.
- STMICROELECTRONICS
- TAIDOC TECHNOLOGY
- TEXAS INSTRUMENTS INC.
- TRIVIDIA HEALTH INC.
第15章 付録:頭字語のリスト
List of Tables
- Summary Table : Global Market for Biosensors and Nanosensors, by Region, Through 2028
- Table 1 : Key Trends in Biosensors and Nanosensors
- Table 2 : Porter's Five Forces Analysis: Overview
- Table 3 : Global Market for Biosensors and Nanosensors, by Product Type, Through 2028
- Table 4 : Global Market for Biosensors, by Region, Through 2028
- Table 5 : Global Market for Nanosensors, by Region, Through 2028
- Table 6 : Global Market for Biosensors and Nanosensors, by Technology, Through 2028
- Table 7 : Global Market for Global Electrochemical Biosensors, by Region, Through 2028
- Table 8 : Global Market for MEMS Biosensors, by Region, Through 2028
- Table 9 : Global Market for Optoelectric Biosensors, by Region, Through 2028
- Table 10 : Global Market for Thermistor Biosensors, by Region, Through 2028
- Table 11 : Global IoT-Enabled Biosensors Market, by Region, Through 2028
- Table 12 : Global Market for Other Types of Biosensors by Region, Through 2028
- Table 13 : Global Market for Nanosensors, by Region, Through 2028
- Table 14 : Global Market for Biosensors and Nanosensors, by Application, Through 2028
- Table 15 : Global Market for Biosensors and Nanosensors in Healthcare Applications, by Region, Through 2028
- Table 16 : Global Market for Biosensors and Nanosensors in Environmental Applications, by Region, Through 2028
- Table 17 : Global Market for Biosensors and Nanosensors in Process Industries, by Region, Through 2028
- Table 18 : Global Market for Biosensors and Nanosensors in Biodefense Applications, by Region, Through 2028
- Table 19 : Global Market for Biosensors and Nanosensors in Other Applications, by Region, Through 2028
- Table 20 : Global Market for Biosensors and Nanosensors, by Region, Through 2028
- Table 21 : North American Market for Biosensors and Nanosensors, by Product Type, Through 2028
- Table 22 : North American Market for Biosensors and Nanosensors, by Technology, Through 2028
- Table 23 : North American Market for Biosensors and Nanosensors, by Application, Through 2028
- Table 24 : European Market for Biosensors and Nanosensors, by Product Type, Through 2028
- Table 25 : European Market for Biosensors and Nanosensors, by Technology, Through 2028
- Table 26 : European Market for Biosensors and Nanosensors, by Application, Through 2028
- Table 27 : Asia-Pacific Market for Biosensors and Nanosensors, by Product Type, Through 2028
- Table 28 : Asia-Pacific Market for Biosensors and Nanosensors, by Technology, Through 2028
- Table 29 : Asia-Pacific Market for Biosensors and Nanosensors, by Application, Through 2028
- Table 30 : Rest of World Market for Biosensors and Nanosensors, by Product Type, Through 2028
- Table 31 : Rest of World Market for Biosensors and Nanosensors, by Technology, Through 2028
- Table 32 : Rest of World Market for Biosensors and Nanosensors, by Application, Through 2028
- Table 33 : ESG Risk Ratings Metric, by Company, 2022
- Table 34 : List of Patents Granted on Biosensors, Global, 2023
- Table 35 : List of Global Patents Granted on Nanosensors, 2021-2023
- Table 36 : Global M&A Transactions in Point-of-Care Testing Field, May 2021-July 2023
- Table 37 : M&A Transactions in Glucose Monitoring Field, Global, February 2021-March 2023
- Table 38 : Funding of Start-ups in the Glucose Monitoring Field , May 2021-January 2023
- Table 39 : Start-up Funding in the Glucose Monitoring Field, January 2021-June 2023
- Table 40 : Market Shares of Top Biosensors and Nanosensors Providers, 2022
- Table 41 : Abbott Laboratories Inc.: Financial Performance, FY 2022
- Table 42 : Abbott Laboratories Inc.: Product Portfolio
- Table 43 : Analog Devices Inc.: Financial Performance, FY 2022
- Table 44 : Analog Devices Inc.: Product Portfolio
- Table 45 : Bayer AG: Financial Performance, FY 2022
- Table 46 : Bayer AG: Product Portfolio
- Table 47 : Dexcom Inc.: Financial Performance, FY 2022
- Table 48 : Dexcom Inc.: Product Portfolio
- Table 49 : F. Hoffmann-La Roche AG: Financial Performance, FY 2022
- Table 50 : F. Hoffmann-La Roche AG: Product Portfolio
- Table 51 : Honeywell International Inc.: Financial Performance, FY 2022
- Table 52 : Honeywell International Inc.: Product Portfolio
- Table 53 : Medtronic Inc.: Financial Performance, FY 2022
- Table 54 : Medtronic Inc.: Product Portfolio
- Table 55 : Murata Manufacturing Co. Ltd.: Financial Performance, FY 2021
- Table 56 : NXP Semiconductors N.V.: Financial Performance, FY 2022
- Table 57 : Omron Industrial Automation: Product Portfolio
- Table 58 : Siemens AG: Financial Performance, FY 2022
- Table 59 : Siemens AG: Product Portfolio
- Table 60 : STMicroelectronics N.V.: Financial Performance, FY 2022
- Table 61 : Texas Instruments Inc.: Financial Performance, FY 2022
- Table 62 : Texas Instruments Inc.: Product Portfolio
- Table 63 : Acronyms Used in This Report
List of Figures
- Summary Figure : Global Market Shares of Biosensors and Nanosensors, by Region, 2022
- Figure 1 : Sacrificial Layer Etching
- Figure 2 : LIGA Process
- Figure 3 : Isotropic vs. Anisotropic Etching
- Figure 4 : Value Chain Analysis for Biosensors and Nanosensors
- Figure 5 : Market for Biosensors and Nanosensors: Porter's Five Forces Analysis
- Figure 6 : Market for Biosensors and Nanosensors: Bargaining Power of Suppliers
- Figure 7 : Market for Biosensors and Nanosensors: Bargaining Power of Consumers
- Figure 8 : Market for Biosensors and Nanosensors: Threat of New Entrants
- Figure 9 : Market for Biosensors and Nanosensors: Competition in the Industry
- Figure 10 : Emerging Technologies in the Market for Biosensors and Nanosensors
- Figure 11 : Global Market Shares of Biosensors and Nanosensors, by Product Type, 2022
- Figure 12 : Global Market Shares of Biosensors, by Region, 2022
- Figure 13 : Global Market Shares of Nanosensors, by Region, 2022
- Figure 14 : Global Market Shares of Biosensors and Nanosensors, by Technology, 2022
- Figure 15 : Global Market Shares of Electrochemical Biosensors, by Region, 2022
- Figure 16 : Global Market Shares of MEMS Biosensors, by Region, 2022
- Figure 17 : Global Market Shares of Optoelectric Biosensors, by Region, 2022
- Figure 18 : Global Market Shares of Thermistor Biosensors, by Region, 2022
- Figure 19 : Global IoT-Enabled Biosensors Market Share, by Region, 2022
- Figure 20 : Global Market Shares of Other Types of Biosensors, by Region, 2022
- Figure 21 : Global Market Shares of Nanosensors, by Region, 2022
- Figure 22 : Global Market Shares of Biosensors and Nanosensors, by Application, 2022
- Figure 23 : Global Market Shares of Biosensors and Nanosensors in Healthcare Applications, by Region, 2022
- Figure 24 : Global Market Shares of Biosensors and Nanosensors in Environmental Applications, by Region, 2022
- Figure 25 : Global Market Shares of Biosensors and Nanosensors in Process Industries, by Region, 2022
- Figure 26 : Global Market Shares of Biosensors and Nanosensors in Biodefense Applications, by Region, 2022
- Figure 27 : Global Market Shares of Biosensors and Nanosensors in Other Applications, by Region, 2022
- Figure 28 : Global Market Shares of Biosensors and Nanosensors, by Region, 2022
- Figure 29 : North American Market Shares of Biosensors and Nanosensors, by Product Type, 2022
- Figure 30 : North American Market Shares of Biosensors and Nanosensors, by Technology, 2022
- Figure 31 : North American Market Shares of Biosensors and Nanosensors, by Application, 2022
- Figure 32 : European Market Shares of Biosensors and Nanosensors, by Product Type, 2022
- Figure 33 : European Market Shares of Biosensors and Nanosensors, by Technology, 2022
- Figure 34 : European Market Shares of Biosensors and Nanosensors, by Application, 2022
- Figure 35 : Asia-Pacific Market Shares of Biosensors and Nanosensors, by Product Type, 2022
- Figure 36 : Asia-Pacific Market Shares of Biosensors and Nanosensors, by Technology, 2022
- Figure 37 : Asia-Pacific Market Shares of Biosensors and Nanosensors, by Application, 2022
- Figure 38 : Rest of World Market Shares of Biosensors and Nanosensors, by Product Type, 2022
- Figure 39 : Rest of World Market Shares of Biosensors and Nanosensors, by Technology, 2022
- Figure 40 : Rest of World Market Shares of Biosensors and Nanosensors, by Application, 2022
- Figure 41 : Share of Published Biosensor-Related Patents and Patent Applications, by Applicant in Key Countries, 2022-2023
- Figure 42 : Share of Published Nanosensor-Related Patents and Patent Applications, by Applicants in Key Countries, 2021-2023
- Figure 43 : M&A Transactions in Point-of-Care Testing Field, by Deal Size, 2021-2023
- Figure 44 : Share of M&A Transactions in Point-of-Care Testing Field, by Region, 2021-2023
- Figure 45 : M&A Transactions in Glucose Monitoring Field, by Deal Size, 2021-2023
- Figure 46 : Share of M&A Transactions in Glucose Monitoring Field, by Region, 2021-2023
- Figure 47 : Start-up Funding in the Glucose Monitoring Field, by Amount Raised, 2021-2023
- Figure 48 : Abbott Laboratories Inc.: Financial Performance, 2021 and 2022
- Figure 49 : Abbott Laboratories Inc.: Revenue Share, by Segment, FY 2022
- Figure 50 : Abbott Laboratories Inc.: Revenue Share, by Region, FY 2022
- Figure 51 : Analog Devices Inc.: Financial Performance, 2021 and 2022
- Figure 52 : Analog Devices Inc.: Revenue Share, by Business Segment, FY 2022
- Figure 53 : Analog Devices Inc.: Revenue Share, by Sales Channel, FY 2022
- Figure 54 : Analog Devices Inc.: Revenue Share, by Region, FY 2022
- Figure 55 : Bayer AG: Financial Performance, 2021 and 2022
- Figure 56 : Bayer AG: Revenue Share, by Segment, FY 2022
- Figure 57 : Bayer AG: Revenue Share, by Region, FY 2022
- Figure 58 : Dexcom Inc.: Financial Performance, 2021 and 2022
- Figure 59 : Dexcom Inc.: Revenue Share, by Sales Channel, FY 2022
- Figure 60 : Dexcom Inc.: Revenue Share, by Region, FY 2022
- Figure 61 : F. Hoffmann-La Roche AG: Financial Performance, 2021 and 2022
- Figure 62 : F. Hoffmann-La Roche AG: Revenue Share, by Segment, FY 2022
- Figure 63 : Honeywell International Inc.: Financial Performance, 2021 and 2022
- Figure 64 : Honeywell International Inc.: Revenue Share, by Segment, FY 2022
- Figure 65 : Honeywell International Inc.: Revenue Share, by Region, FY 2022
- Figure 66 : Medtronic Inc.: Financial Performance, 2021 and 2022
- Figure 67 : Medtronic Inc.: Revenue Share, by Segment, FY 2022
- Figure 68 : Medtronic Inc.: Revenue Share, by Region, FY 2022
- Figure 69 : Murata Manufacturing Co. Ltd.: Financial Performance, FY 2020 and 2021
- Figure 70 : Murata Manufacturing Co. Ltd.: Revenue Share, by Segment, FY 2021
- Figure 71 : Murata Manufacturing Co. Ltd.: Revenue Share, by Region, FY 2022
- Figure 72 : NXP Semiconductors N.V.: Annual Revenue, 2021 and 2022
- Figure 73 : NXP Semiconductors N.V.: Revenue Share, by End Market, FY 2022
- Figure 74 : NXP Semiconductors N.V.: Revenue Share, by Sales Channel, FY 2022
- Figure 75 : NXP Semiconductors N.V.: Revenue Share, by Region, FY 2022
- Figure 76 : Siemens AG: Financial Performance, 2021 and 2022
- Figure 77 : Siemens AG: Revenue Share, by Business Segment, FY 2022
- Figure 78 : Siemens AG: Revenue Share, by Region, FY 2022
- Figure 79 : STMicroelectronics N.V.: Financial Performance, 2021 and 2022
- Figure 80 : STMicroelectronics N.V.: Revenue Share, by Product Group, FY 2022
- Figure 81 : STMicroelectronics N.V.: Revenue Share, by Region, FY 2022
- Figure 82 : Texas Instruments Inc.: Financial Performance, 2021 and 2022
- Figure 83 : Texas Instruments Inc.: Revenue Share, by Business Segment, FY 2022
- Figure 84 : Texas Instruments Inc.: Revenue Share, by Region, FY 2022
Highlights:
The global market for biosensors and nanosensors is expected to grow from $30.6 billion in 2023 to $43.5 billion by 2028, at a compound annual growth rate (CAGR) of 7.3% from 2023 to 2028.
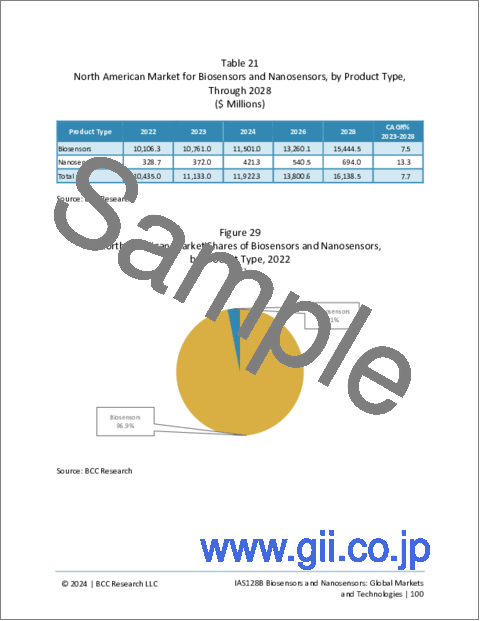
The North American market for biosensors and nanosensors is expected to grow from $11.1 billion in 2023 to $16.1 billion by 2028, at a CAGR of 7.7% from 2023 to 2028.
The Asia-Pacific market for biosensors and nanosensors is expected to grow from $5.6 billion in 2023 to $8.3 billion by 2028, at a CAGR of 8.3% from 2023 to 2028.
##img_0##
Report Scope:
This report represents an in-depth analysis of the global market for biosensors and nanosensors by product type, technology, application and geography. The scope of the report includes an overview of the global market trends, with 2022 considered as the base year, as well as estimates for 2023 through 2028, with projections of CAGR across this forecast period.
The report also includes a discussion of technological, regulatory and competitive elements as well as the economic trends affecting the market. It also explains the major drivers and regional dynamics of the global market for biosensors and nanosensors and identifies the current trends within the industry. The report concludes with detailed profiles of the major vendors in the global market.
Report Includes:
- 44 data tables and 20 additional tables
- An overview of the global market landscape related to the biosensor and nanosensor technologies
- In-depth analysis of the global market trends, featuring historical revenue data for 2022, estimated figures for 2023, as well as forecasts for 2024, 2026, and 2028. This analysis includes projections of Compound Annual Growth Rates (CAGRs) spanning through 2028
- Evaluation of the current market size and revenue growth prospects specific to biosensor and nanosensor technologies, accompanied by a comprehensive market share analysis categorized by product type, technology, application, and geographical region
- Detailed description about types of biosensor components i.e. biological and physical, basic characteristics and types of biosensors; and discussion on future of biosensors and nanosensors market with regulatory standards
- An outlook of the ESG perspectives in the market for biosensors and nanosensors
- Analysis of patents published on the biosensors and nanosensors
- Overview of merger and acquisition (M&A) activities and venture fundings in the biosensors and nanosensors industry
- Company profiles of the leading market participants
Table of Contents
Chapter 1 Introduction
- Study Goals and Objectives
- Reasons for Doing This Study
- Scope of Report
- What's New in This Update?
- Research Methodology
- Information Sources
- Geographic Breakdown
- Segmentation Breakdown
Chapter 2 Summary and Highlights
- Market Outlook
- Market Summary
Chapter 3 Market Overview
- Overview
- Features of Biosensors
- Biological Component of Biosensors
- Physical Components of Biosensors
- Basic Characteristics of a Biosensor
- Biosensors for Specific Purposes
- Biosensor and Nanosensor Manufacturing
- Micromachining
- Etching
- Laser Microfabrication
- Nanopatterning
- Nanosensors
- Future of Market for Biosensors and Nanosensors
- Regulatory Standards
- Value Chain Analysis
- Porter's Five Forces Analysis
- Bargaining Power of Suppliers
- Bargaining Power of Consumers
- Threat of New Entrants
- Competition in the Industry
- Threat of Substitutes
- Assessment of the Impact of COVID-19 on the Market
- Assessment of Russia-Ukraine War Impact on the Market
Chapter 4 Market Dynamics
- Overview
- Market Drivers
- Emergence of Nanotechnology-Based Biosensors
- Increasing Miniaturization and Integration of Sensors for Wearable Devices
- Surging Demand for Home-Based Point-of-care Devices
- Market Restraints
- Cost of Development and Manufacturing
- Data Privacy and Security Concerns
- Market Opportunities
- Increasing Focus on Sustainability and Green Technologies
- Increasing Integration with the Internet of Things (IoT)
Chapter 5 Emerging Technologies and Developments
- Overview
- Current Market Trends
- Healthcare Dominance
- Wearable Biosensors
- Point-of-Care Testing
- IoT Integration
- Emerging Technologies
- Graphene-Based Biosensors
- Synthetic Biology and Genetic Engineering
- Nanoparticles and Quantum Dots
- Lab-on-a-Chip (LOC)
- Microfluidics
- AI and ML
- 3D Printing
Chapter 6 Market Breakdown by Product Type
- Overview
- Biosensors
- Nanosensors
- Background
- Nanoparticles
- Carbon Nanotubes
- Graphene
- Nanoribbons
- Nanowires
- Nanoceramics
- Other Nanostructured Materials
Chapter 7 Market Breakdown by Technology
- Overview
- Electrochemical Biosensors
- MEMS Biosensors
- Optoelectric Biosensors
- Thermistor Biosensors
- IoT-Enabled Biosensors
- Other Biosensors
- Nanosensors
- Nanochemical Sensors
- Nanoforce Sensors
- Nanobiosensors
- Nanoradiation Sensors
- Nanothermal Sensors
Chapter 8 Market Breakdown by Application
- Overview
- Healthcare
- Environmental
- Process Industries
- Agriculture
- Food Monitoring
- Biodefense
- Other Applications
Chapter 9 Market Breakdown by Region
- Overview
- North America
- Europe
- Asia-Pacific
- Rest of World (RoW)
Chapter 10 Environmental, Social, and Governance (ESG) Perspective
- Overview
- ESG Performance in Market for Biosensors and Nanosensors
- Environmental Impact
- Social Impact
- Governance Impact
- Current Status of ESG in the Market for Biosensors and Nanosensors
- Key ESG Issues in the Market for Biosensors and Nanosensors
- Consumer Attitudes towards ESG in Market for Biosensors and Nanosensors
- Case Study
- Concluding Remarks from BCC
Chapter 11 Patent Analysis
- Overview
- Geographical Patterns
Chapter 12 M&A and Funding Outlook
- M&A Analysis
- Funding of Start-ups in the Glucose Monitoring Field
Chapter 13 Competitive Landscape
- Top Companies
Chapter 14 Company Profiles
- ABBOTT LABORATORIES INC.
- ACON LABORATORIES
- ANALOG DEVICES INC.
- BAYER AG
- BIOSENSORS INTERNATIONAL GROUP
- CONTEC MEDICAL SYSTEMS CO. LTD.
- DEXCOM INC.
- F. HOFFMAN-LA ROCHE AG
- HONEYWELL INTERNATIONAL INC.
- HUMMINGBIRD DIAGNOSTICS GMBH
- I-SENS INC.
- KIONIX INC.
- LIFESCAN INC.
- MEDTRONIC INC.
- MEMSIC INC.
- MURATA MANUFACTURING CO. LTD.
- NXP SEMICONDUCTORS N.V.
- OMRON INDUSTRIAL AUTOMATION
- OPTISCAN BIOMEDICAL CORP.
- SENSONOR AS
- SIEMENS HEALTHCARE GMBH
- SILICON DESIGNS INC.
- SILICON SENSING SYSTEMS LTD.
- STMICROELECTRONICS
- TAIDOC TECHNOLOGY
- TEXAS INSTRUMENTS INC.
- TRIVIDIA HEALTH INC.
